Abstract
The objective of this work was to develop Artificial Neural Network (ANN) based thermal conductivity (K) prediction model for Iranian flat breads. Experimental data needed for ANN models were obtained from a pilot-scale set-up. Breads were made from three different cultivars of wheat and were baked in an eclectic oven at three different baking temperatures (232°C, 249°C and 260°C). A data set of 205 conditions was used for developing ANN and empirical models. To model K using ANN, 16 different MLP (multilayer perceptron) configurations ranging from one to two hidden layers of neurons were investigated and their prediction performances were evaluated. The (4-3-5-1)-MLP network, that is a network having two hidden layers, with three neurons in its first hidden layer and five neurons in its second hidden layer, had the best results in predicting the thermal conductivity of flat bread. For this network, R2, MRE, MAE and SE were 0.988, 0.6323, 1.66×10− 3, and 8.56×10⁻⁴, respectively. Overall, ANN models (with R2 ≥ 0.95) performed superior than the empirical model (with R2 = 0. 870).
INTRODUCTION
Bread is considered the main food source in Iran. It provides the majority of energy and protein requirements. The type of wheat and the quality of the bread are the most important factors that determine the suitability of wheat varieties in the baking industry in Iran and the Middle East. Several varieties of wheat are grown in Iran. Here, Marvdasht, Chamran, and Pishtaz, which are three commercial wheat varieties grown in Iran, are considered. They are used to produce most bread types.
Baking is crucial in determining the quality of bread. It is pointed out that baking of bread cause a series of physical, chemical, and biochemical changes in dough, as well as changes in color.[Citation1] A limited number of researches have been done on flat bread throughout the world. The flour quality requirements for different flat breads such as Baladi, Chapatti, Barbari, Tanoor and Sangak breads was reported.[Citation2] Flat breads are generally produced from soft white wheat flours of higher extraction levels.[Citation3] Among bread types, they have a better chance of incorporation of high levels of dietary fiber without causing a drastic deterioration in quality.[Citation4] Among the different Iranian flat breads, Lavash is the most consumed and has the highest losses (39.1%) followed by Baribari (13.8%) and Sangak (10.7%) during baking, handling, distribution and consumption processes.[Citation2 Citation–3] In bread baking practice, material properties which changes with temperature and moisture content are not readily available. The effects of temperature and relative humidity on the specific heat of the bread was explored.[Citation5] The possibility of mixing two types of barley flour (Rum and ACSAD 176) with two commonly used types of wheat flours in Jordan was investigated.[Citation1] A steady-state technique was used to measure thermal conductivity of whole wheat dough and baked Chapati at various stages of cooking.[Citation6] Based on the experimental data of Chapati at various stages of cooking, he proposed a linear equation for thermal conductivity of wheat flour dough and baked Chapati at different moisture and temperature levels.
Thermal conductivity is one of the most important thermo-physical characteristics of bread since it is needed in the analysis of heat transfer during processing.[Citation7] Three factors affect the thermal conductivity of foods: composition, structure, and processing conditions. Considering the wide variations in materials, and processing conditions makes it difficult to develop an analytical model for prediction of thermal conductivity under a wide range of conditions. While several modeling approaches have been proposed to predict thermal properties of a material at desired conditions, none of them can be used over a wide range of foods.[Citation8] There has been consistent effort spent in developing generalized correlations to predict properties of food materials for the use in process design and optimization. Sweat[Citation9] proposed a linear correlation for predicting the thermal conductivity of fruits and vegetables giving predictive results within ± 15% for most experimental values. The most promising approach for prediction of thermal conductivity is based on chemical composition, temperature, and physical characteristics. The series model of specific heat, density and thermal diffusivity has been successfully applied to many food materials including porous materials such as bakery products.[Citation10] However, for the prediction of thermal conductivity of porous food, there is still some theoretical argument for the use of the structural models.[Citation8, Citation11] For instance, Murakami and Okos[Citation8] evaluated nine different structural models with specific types of porous foods and found that parallel and perpendicular models showed 12–97% and 18–61% standard error. Hence most thermal conductivity models reported so far are empirical rather than theoretical.
Recently, Artificial Neural Network (ANN) models and Adaptive Network-based Fuzzy Inference Systems (ANFIS), which are heuristic models, have gained momentum for process modeling and control.[Citation12] ANN models are recognized as a good tool for dynamics modeling because they do not require parameters of physical models, have ability to learn from experimental data, and are capable to handle complex systems with nonlinearities and interactions between decision variables.[Citation13 Citation–14] Applications of ANN models include fermentation, extrusion processes, filtration, drying processes, food quality prediction, sorting and quality inspection, etc.[Citation7, Citation13–24 More specific to the present study, ANN has been used in the prediction of drying kinetics of foodstuffs,[Citation14–Citation15] dough rheological properties,[Citation16] physical properties of ground wheat,[Citation17] biscuit baking,[Citation18] isotherms of dates,[Citation19] food quality,[Citation20–Citation21] thermal conductivity prediction of fruits and vegetables,[Citation22] prediction of heat penetration parameters in Stumbo's method of thermal process calculations,[Citation23] prediction of thermal conductivity of bakery and food products.[Citation7, Citation10, Citation24] The bakery products considered in Sablani et al.[Citation7, Citation10] work were bread, bread dough, French bread, yellow cake, tortilla chip, whole wheat dough, baked Chapati, and cup cake. They modeled the thermal conductivity of these bakery products as a function of product moisture content, temperature and apparent density. A total of 83 data points collected from literature were used in developing ANN model for predicting thermal conductivity of bakery products. In Sablani and Rahman,[Citation24] a total of 676 data points collected from 12 journal papers for 10 different materials were used in developing ANN model for predicting thermal conductivity of food products in the training and validation of ANN models.
Previous studies have shown that the utilization of wheat is determined by its physical and chemical properties.[Citation1] The effects of initial moisture content, vacuum level and frying temperature on physicochemical properties of donuts, such as moisture loss, oil absorption, and quality were investigated.[Citation25] The oil uptake to moisture loss ratio might vary with different frying products and conditions.[Citation26] Donuts are characterized by a golden-brown exterior color, a crisp crust, and an inner core that resembles a baked product more than a fried food. The fat content of the finished donuts varied in the range of 10–26 g/100 g sample, depended on the formulation and frying conditions.[Citation27] Recently, we studied (i) the physicochemical properties of Iranian flat bread, made from three wheat cultivars, and the properties of resulting flour and dough on physical characteristics of bread,[Citation28] and (ii) the trends of temperature variations of flat bread, made from these cultivars, and baked in an electric oven.[Citation29] In this sequel, we intend to continue our investigation of Iranian flat breads. Here, the objective was to develop an ANN based thermal conductivity prediction model for Iranian flat breads as a function of product moisture content, temperature, and apparent density. Here the thermal conductivity data was obtained from a carefully designed data acquisition system using modified Fitch apparatus.
MATERIALS AND METHODS
Considering the effects of physical and chemical properties of three wheat cultivars (Marvdasht, Chamran, and Pishtaz) and the properties of resulting flour and dough on physical characteristics of bread, initially the physiochemical properties of all these wheat cultivars were studied.[Citation28] In the next stage, loaves are formed and the bread is baked in an electrical oven (Shoaleh 1250, Exciton Co., Iran) with dimensions 68 × 86.5 × 87.5 cm3 and the trends of temperature variations of flat bread, made from these cultivars, were examined. The bread was baked by traditional method at three different baking temperatures of 232, 249, and 260°C. The control of final dough temperature to a constant value is essential to ensure consistency of product quality. To measure and control temperature variations within the bread during baking, an automatic computer-based monitoring system was developed.[Citation29] shows a schematic representation of the designed data acquisition (DAQ) system for investigating the trends of temperature variations of flat bread. Further details of this pilot-scale set-up, DAQ and developed software are given in.[Citation29 Citation–30] A microcontrolled device to measure thermal conductivity of foods was also developed in.[Citation31] It was based on the utilization of the hot wire transient method. The thermal conductivities of ketchup, condensed milk, and cream milk products were determined using this device and validated against a renowned commercial one. The results obtained with the prototype were similar to the commercial one.
Figure 1 Data acquisition system for measuring bread temperature variations (color figure available online).[Citation28]
![Figure 1 Data acquisition system for measuring bread temperature variations (color figure available online).[Citation28]](/cms/asset/c6bb583f-dc98-446a-a032-7cbc0f5c4e24/ljfp_a_437587_o_f0001g.jpg)
Input Parameters Measurements
Various experiments were conducted to measure thermal conductivity K (W/m K) of bread as a function of moisture content, M (%w.b.), apparent density ρ (kg/m 3) and temperature variations at the top and bottom of the bread, Ta and Tb (°C) during baking. Detail specifications on loaf preparation and measuring apparatus has been fully covered in our recent work.[Citation28 Citation–29] Bread loaves made of three wheat cultivars (Marvdasht, Chamran, and Pishtaz) were prepared and backed in an electrical oven at baking temperatures of 232, 249, and 260°C. The bread was baked with emergency no-time method.[Citation28]
Neural network input variables (Ta, Tb, M and ρ) were carefully measured for 5, 8, 10, 12, and 14 min after being in electrical oven. The moisture content was determined from the difference between the final weight and initial weight of bread loaves. To find the decrease in bread weight and weight loss during baking, samples were baked at three different temperatures (232, 249, and 260°C) studied and the weight of loaves after being in electrical oven for 5, 8, 10, 12, and 14 min were measured. In the calculations of moisture content, the wet basis values were used. The apparent density of loaves for each sample was determined by dividing the bread loaf weight (measured 10 min after leaving the oven) by its volume. The volume of loaves was measured by National Loaf Volumemeter (suitable for volumes less than 1000 mL) according to the method of substitution of rape seed. Finally, in order to measure and control temperature variations at top and bottom of bread during baking, an automatic computer-based monitoring system was developed.[Citation29 Citation–30]
Thermal Conductivity Measurements
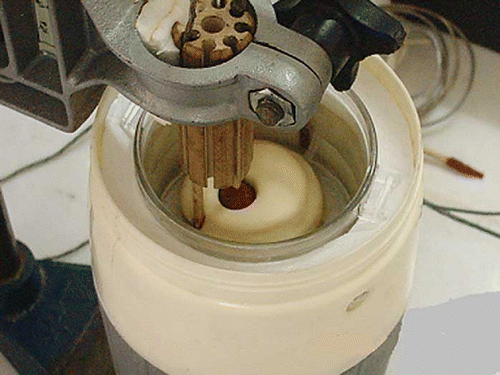
Both steady state and unsteady-state heat conduction techniques are developed for measuring thermal conductivity (K) of foodstuffs.[Citation31 Citation–32] Here we use a modified Fitch method for determining K. The procedure for determining K by Fitch method is to apply a steady heat flux to the sample, which must be in thermal equilibrium initially, and to measure the temperature rise at some point in the specimen resulting from this applied heat flux. The Fitch apparatus consists of a heat source and a heat sink. This method uses either a line heat source or one or more plane sources of heat.[Citation32] This method of measuring K is more appropriate for biological materials because of their high moisture content and the possibility of moisture migration during heating. In this work, a modified Fitch apparatus shown in was developed to measure K.[Citation30] The diameter of copper plate was comparable to the loaf samples (about 15 mm). The sample was sandwich between the copper plate and the heat source. The average sample thickness was 10 mm. Time-temperature data was taken. A record of time and temperature is taken and the following equation is used to calculate the thermal conductivity (K) of bread[Citation32]:
Figure 2 Modified Fitch apparatus developed to measure thermal conductivity (color figure available online).
Where K is thermal conductivity of sample (W/m K); m is mass of the heat sink (kg); cp is specific heat of copper (J/kg°C); t time (s); A is heat transfer area (m2 ); L is thickness of the loaf sample (m); T is temperature of copper block (°C); T0 is initial temperature (°C); and T ∞ is constant temperature of vessel bottom (°C). Once the straight line has been established in a semi-log plot, any two points corresponding to times t2 and t1 can be selected to determine the corresponding temperature T2 and T1. Thermal conductivity K can then be calculated from the constant slope part of the line. Using the fore-mentioned technique, the thermal conductivity of bread made from three wheat cultivars was obtained under different operating conditions. The baking conditions such as baking temperature, moisture content and apparent density are given in . Initially, the loaf sample and copper plate temperatures were kept at ambient temperature. Temperature difference of about 20°C is then created by adjusting the heat source. Once heat is transferred throughout the sample by diffusion mechanism, temperature variation of the K-type thermocouple connected to the copper plate is recorded. Assuming uniform temperature throughout the sample, variations of temperature as a function of time in a semi-log plot would be linear (EquationEq. 1). Therefore, using the copper plate temperature records in EquationEq. (1), K can be calculated.
Tests were run at three levels of baking temperature (232, 249, and 260°C) for three wheat cultivars (Marvdasht, Chamran, and Pishtaz) and three replications. In order to automate the experiments, a custom program was developed in Visual Basic 6.0 environment, which could automatically save data at different time intervals (one to 60 s) in MS Access file for further analysis. On the average, 840 data was collected from each sensor during baking. A summary of measured parameters is given in .
Table 1 Range of different operating variables used in the simulation model
Table 2 Thermo-physical properties of Iranian flat breads made from different cultivars
Design of ANN
A multi-layer feed forward network structure is used in this study as shown in . In this work, hyperbolic tangent function f(x) = tanh(x) is used for hidden layer(s) neurons and linear function f(x) = x is used for output layer neuron. Several ANN models were trained using the measured thermal conductivity data. The back-propagation (BP) algorithm is utilized in training of ANN models.[Citation33] It is a general method for iteratively solving for weights and biases. The BP algorithm uses the supervised training technique where the network weights and biases are initialized randomly at the beginning of the training phase. The knowledge obtained during training phase is not stored as equations or in a knowledge base, but is distributed throughout the network in the form of connection weights between neurons. For a given set of inputs to the network, the response to each neuron in the output layer is calculated and compared with the corresponding desired output response. The errors associated with desired output response are adjusted in the way that reduces these errors in each neuron from the output to the input layer. In the feed-forward networks, error minimization can be obtained by a number of procedures including Gradient Descent (GD),[Citation14] GD with momentum,[Citation13] Levenberg–Marquardt (LM),[Citation34] and Conjugate Gradient (CG). Standard BP uses a GD technique, which is very stable when a small learning rate is used, but has slow convergence properties. Several methods for speeding up BP have been used including adding a momentum term or using a variable learning rate.
Figure 3 Neural network architecture.
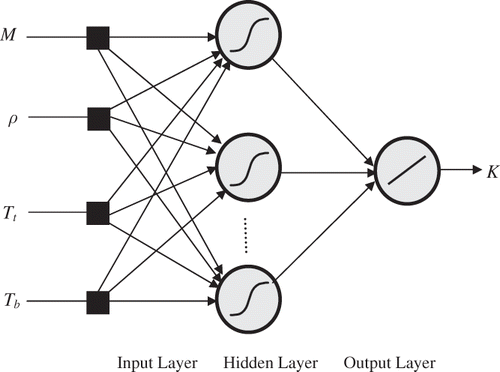
The first step in ANN modeling deals with the definition of the network architecture, which was defined by the basic processing elements (neurons) and by the way in which they are interconnected (layers). The number of neurons in input and output layers depends on independent and dependent variables, respectively. Since one dependent variable, K, (thermal conductivity of the flat bread), depends on four variables including product moisture content, temperatures (at the top and bottom) and apparent density. One and four neurons were devoted to output and input layers (), respectively. The number of hidden layers and their neurons depend on the complexity of the problem to be investigated.[Citation7, Citation13 Citation–14, Citation18] Different hidden layer neurons and arrangements have to be considered in order to select the best production results.
Statistical Analysis
The effects of three levels of baking temperatures and ten different baking time increments (from one to ten minutes) were investigated for three selected main factors of wheat varieties. In order to model thermal conductivity variations during baking, K was modeled as a function of input parameters using statistical and neural networks. In both cases, K was assumed the following functional form:
Technical Details
A total of 205 baking conditions were used for modeling K with ANN. The data were split into two parts: 70% of the data (143) for training, and the remaining 62 data points (30%) for testing of various ANN models. MLP was trained with BP algorithm. In this study, one and two hidden layer(s) including various neurons were used for the ANN models. The number of neurons in one hidden layer networks were varied from 4 to 14, whereas in two hidden layers cases were 3 (in the first hidden layer) and 4 to 16 (in the second hidden layer), respectively. After adequate training, the network weights are adapted and employed for validation in order to determine the ANN model overall performance. Out of 16 configurations, the ones that minimized the three error measuring parameters [Equation3–5)] and optimized R2 were ultimately selected as the optimum models. A summary of the results is shown in .
Table 3 Prediction errors in the thermal conductivity with different ANN configurations
One of the problems that can occur with the back propagation and associated network is the problem of overfitting. The symptom of this is when the network is performing well on the training data, but poorly on independent validation data.[Citation7] SaveBest is one of a number of ways to deal with this. In order to avoid the potential problem of overfitting, the option of saving the best configuration in NeuralWorks Professional II/Plus was selected where the network with the best result is saved during the selected long number of training cycles of 10,000. The SaveBest option allows running train/test cycles and saving the network with the best result during the run.
RESULTS AND DISCUSSION
A data set of 205 baking conditions was used for modeling K emperically with regression equation and ANN. These amount of data were obtained from the actual measured data () as well as the data generated through the interpolation between the measured intervals for baking duration of 0 and 14 min.
Modeling K with ANN
Results of the network performance for different arrangement are presented in . The error measures associated with the different ANN configurations are presented in . The optimal configuration was selected from 16 ANN configurations based on minimizing three error measures used to assess the predictive performance of each configuration. The values reported in are the MAE, MRE, SE (Equation3–5, respectively) and R2 values at the end of training on the data items from the independent test set (62 instances).
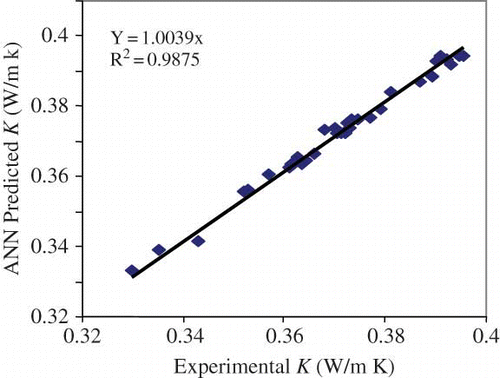
The best ANN configuration included two hidden layers with 3 and 5 neurons in the first and second hidden layer, i.e., a (4-3-5-1)-MLP. This configuration resulted in the best-suited model estimating thermal conductivity of bread. The mean relative error for this optimal configuration was 0.63. For this network, MAE and SE were 1.77E-3 and 9.36E-4, respectively. The corresponding coefficient of determination was 0.9875. Among the one hidden layer networks, the (4-7-1)-MLP topology with R2= 0.958. For this network, MAE, MRE and SE were 2.65E-03, 0.626 and 1.40E-03, respectively. To reveal the quality of prediction from the optimum ANN model, (4-3-5-1)-MLP, presented in , shows a plot of predicted vs desired values of K for all data points in the testing dataset. The figure demonstrates the excellent agreement between the predicted and desired values (R2 .0.9875).
Figure 4 Predicted vs. actual values of K for the optimum ANN configuration (color figure available online).
Regression Equation for K
The comparison of ANN models, developed in this study, with regression models of thermal conductivity for bakery products available in the literature was not possible, because the regression models reported in the literature are valid only for specific products and narrow ranges of physical conditions. Consequently, the thermal conductivity, K, was modeled empirically as a function of M, Tt, Tb and ρ using MINITAB 14.1 software. The resulting regression equation was:
Overall, ANN models (with R2 ≥ 0.95) performed superior than the empirical model (with R2 = 0.870). Of course empirical model, (EquationEq. 6), is physically interpretable, whereas the ANN models cannot be easily interpreted. Its behavior has properties of a “black box,” not giving exact information on weighting factors of individual components to the user, although various sensitivity tests and model comparisons may provide insight into their physical meanings.
When function approximation is the goal, the ANN model will often deliver close to the best fit. ANN is a universal approximator,[Citation14, Citation18] whereas the regression approach is not. The present work was motivated in this direction. Apart from model accuracy and generalization capability, other issues such as computational time, credibility, tactical issues and replicating the results have to be considered when using empirical versus ANN to estimate thermal conductivity. For example, although outperforming the empirical modeling technique, ANN has one big offset—it is hard to draw any physical information out of it. Nevertheless, because of their better results, ANNs are commonly used during the past 10 years to solve non-linear problems of high complexity. In future similar modeling efforts, the best solution will represent a trade-off between the simplicity of empirical models and the higher capacity of ANNs to simulate non-linear effects.
CONCLUSIONS
In this study, thermal conductivity of flat bread was investigated experimentally. A comparative study was performed between a regression analysis and ANN to estimate their abilities for prediction of thermal conductivity. Based on the results it can be stated: (i) The coefficient of determination (R2 = 0. 87) of the resulting regression equation was rather low, (ii) The (4-3-5-1)-MLP network, that is a network having two hidden layers, with three neurons in its first hidden layer and five neurons in its second hidden layer, had the best results in predicting the thermal conductivity of flat bread. For this network, R2, MRE, MAE and SE were 0.988, 0.6323, 1.66 × 10⁻³ and 8.56 × 10⁻⁴, respectively. (ii) Overall, ANN models (with R2 ≥ 0.95) performed superior than the empirical model (with R2 = 0. 870). (iv) ANN models were able to describe a wide range of experiments whereas the application of empirical equation is limited to a specific experiment.
ACKNOWLEDGMENTS
The financial support provided by the Research Department of University of Tehran is gratefully acknowledged.
REFERENCES
- Ereifej , K.I. , Al-Mahasneh , M.A. and Rababah , T.M. 2006 . Effect of barley flour on quality of Balady bread . International Journal of Food Properties , 9 : 39 – 49 .
- Qarooni , J. 1996 . Flat Bread Technology , Chapman & Hall Publisher : New York .
- Faridi , H.A. and Finney , P.L. 1980 . Technical and nutritional aspects of Iranian bread . Baker's Digest , 54 : 14 – 22 .
- Basman , A. and Koksel , H. 2001 . Effects of barely flour and wheat bran supplementation on the properties and composition of Turkish flat bread, Yufka . European Food Research and Technology , 212 : 198 – 202 .
- Zanoni , B. and Petronio , M. 1991 . Effect of moisture and temperature on the specific heat of bread . Journal of Food Science , 3 : 238 – 242 .
- Gupta , T.R. 1993 . Thermal conductivity of Indian unleavened flat bread (Chapati) at various stages of baking . Journal of Food Process Engineering , 16 ( 3 ) : 227 – 235 .
- Sablani , S.S. , Baik , O.D. and Marcotte , M. 2002 . Neural networks for predicting thermal conductivity of bakery products, Journal of Food Engineering , 52 : 299 – 304 .
- Murakami , E.G. and Okos , M.R. 1989 . “ Measurement and prediction of thermal properties of foods ” . In Food Properties Computer-aided Engineering of Food Processing Systems , Edited by: Singh , R.P. and Medina , A.G. 3 – 48 . Norwell, MA : Kluwer Academic Publishers .
- Sweat , V.E. and Haugh , C.G. 1974 . A thermal conductivity probe for small food samples . Transactions of ASAE , 17 ( 1 ) : 56 – 58 .
- Sablani , S.S. , Marcotte , M , Baik , O.D. and Castaigne , F. 1998 . Modeling of simultaneous heat and water transport in the baking process . Lebensmittel Wissenschaft Technologie , 31 : 201 – 209 .
- Sweat , V.E. 1985 . Thermal properties of low and intermediate moisture food . ASHRAE Transaction , 91 : 369 – 389 .
- Lertworasirikul , S. 2008 . Drying kinetics of semi-finished cassava crackers: A comparative study . Lebensmittel-Wissenschaft und-Technologie , 41 : 1360 – 1371 .
- Omid , M. , Mahmoudi , A. and Omid , M.H. 2009 . An intelligent system for sorting pistachio nut varieties . Expert Systems with Applications , 36 ( 9 ) : 11528 – 11535 .
- Omid , M. , Baharlooei , A. and Ahmadi , H. 2009 . Modeling drying kinetics of pistachio nuts with multilayer feed-forward neural network . Drying Technology , 27 ( 10 ) : 1 – 9 .
- Hernandez-Perez , J.A , Garcıa-Alvarado , M.A. , Trystram , G. and Heyd , B. 2004 . Neural networks for the heat and mass transfer prediction during drying of cassava and mango . Innovative Food Science and Emerging Technologies , 5 : 57 – 64 .
- Ruan , R. , Almaer , S. and Zhang , J. 1995 . Prediction of dough rheological properties using neural networks . Cereal Chemistry , 72 ( 3 ) : 308 – 311 .
- Fang , Q. , Bilby , G. , Haque , E. , Hanna , M.A. and Spillman , C.K. 1998 . Neural network modeling of physical properties of ground wheat . Cereal Chemistry , 75 ( 2 ) : 251 – 253 .
- Broyart , B. and Trystram , G. 2003 . Modeling of heat and mass transfer phenomena and quality changes during continuous biscuit baking using both deductive and inductive (neural network) modeling principles . Food and Bioproducts Processing , 81 ( 4 ) : 316 – 326 .
- Myhara , R.M. , Sablani , S.S. , Al-Alawi , S.M. and Taylor , M.S. 1998 . Water sorption isotherms of dates: Modeling using GAB equation and artificial neutral network approaches . Lebensmittel Wissenschaft und Technologie , 31 : 699 – 706 .
- Ni , H. and Gunasekaran , S. 1998 . Food quality prediction with neural networks . Food Technology , 52 ( 10 ) : 60 – 65 .
- Xie , G. and Xiong , R. 1999 . Use of hyperbolic and neural network models in modeling quality changes of dry peas in long time cooking . Journal of Food Engineering , 41 : 151 – 162 .
- Hussain , A.M. and Rahman , M.S. 1999 . Thermal conductivity prediction of fruits and vegetables using neutral networks . International Journal of Food Properties , 2 : 121 – 128 .
- Sablani , S.S. and Shayya , W.H. 2001 . Computerization of Stumbo's method of thermal process calculations using neural networks . Journal of Food Engineering , 47 : 233 – 240 .
- Sablani , S.S. and Rahman , M.S. 2003 . Using neural networks to predict thermal conductivity of food as a function of moisture content, temperature and apparent porosity . Food Research International , 36 ( 6 ) : 617 – 623 .
- Tan , K.J. and Mittal , G.S. 2006 . Physicochemical properties changes of donuts during vacuum frying . International Journal of Food Properties , 9 ( 1 ) : 85 – 98 .
- Velez-Ruiz , J.F. and Sosa-Morales , M.E. 2003 . Evaluation of physical properties of dough of donuts during deep-fat frying at different temperatures . International Journal of Food Properties , 6 ( 2 ) : 341 – 353 .
- Tungsangprateep , S. and Jindal , V.K. 2004 . Sorption isotherms and moisture diffusivity in fried cassava shrimp chips . International Journal of Food Properties , 7 : 215 – 227 .
- Akram , A. , Omid , M. , Golmohammadi , A. and Ghasemi-Varnamkhasti , M. 2009 . Effects of wheat flour and baking temperature on the quality of Iranian flat bread-Part I: Physico-chemical Properties . Asian Journal of Chemistry , 21 ( 5 ) : 3910 – 3920 .
- Omid , M. , Akram , A. , Golmohammadi , A. and Keramat-Jahromi , M. 2009 . Effects of wheat flour and baking temperature on the quality of Iranian flat bread-Part II . Thermophysical Properties, Asian Journal of Chemistry , 21 ( 5 ) : 3921 – 3929 .
- Golmohammadi , A. 2005 . Modeling the thermo physical properties of a flat bread during baking using artificial neural networks , Unpublished Doctoral thesis, University of Tehran . in Farsi
- Chaves , M.A . 2009 . Oliveira de Almeida, A. development of a microcontrolled instrument to determinate thermal conductivity of foods . International Journal of Food Engineering , 5 ( 4 ) : 1 – 18 .
- Rahman , M.S. 1991 . Evaluation of the precision of the modified Fitch method for thermal conductivity measurement of foods . Journal of Food Engineering , 14 : 71 – 82 .
- Bishop , C.M. 1996 . Neural networks for pattern recognition , Oxford : Oxford University Press .
- Omid , M. , Mahmoudi , A. and Omid , M. H. 2010 . Development of pistachio sorting system using principal component analysis (PCA) assisted artificial neural network (ANN) of impact acoustics . Expert Systems with Applications , 37 : 7205 – 7212 .