Abstract
The properties and structures of corn, wheat, and potato native starches and their phosphate monoester resistant starches were tested and compared. The results indicated that the resistant starch content, light transmittance, and freeze-thaw stability of the phosphate monoester resistant starch increased after modification. The native starches exhibited much higher peak viscosities compared with resistant starch (RS) and phosphate monoester resistant starches. The phosphate monoester resistant starch from corn and wheat starch exhibited a higher peak and final viscosity and lower gelatinization temperatures compared with the resistant starch, while the peak and final viscosity of the potato phosphate monoester resistant starch samples were lower than that of potato resistant starch. In the FT-IR graph, a new peak at 1244 cm−1 (P=O bond) was observed for all kinds of phosphate monoester resistant starch.
INTRODUCTION
Starch can be classified into rapidly digestible starch, slowly digestible starch, and resistant starch (RS) from the aspect of nutrition based on the rate and degree of digestion.[Citation1,Citation2] RS played a beneficial role on human health and had physiological functions similar to dietary fiber, such as altering lipid metabolism, improving cholesterol metabolism, affect on colon microflora, reducing the risk of ulcerative colitis, and the glycemic index of foods, etc.[Citation3–5]
Resistant starch has been classified into four types based on its resistance to digestion: physically inaccessible starch (RS1), granular starch (RS2), retrograded amylose or high amylose starch (RS3), and chemically modified starch (RS4).[Citation6] The researches on RS4 have focused on citrate, glutarate, and phosphorylated starches.[Citation4] Starch phosphates have been reported to give clear pastes of high consistency with good freeze-thaw stability and emulsifying properties, and may be grouped into two classes: mono starch phosphates and distarch phosphates (cross-linked starches). In general, mono starch phosphates (monoesters) can have a higher degree of substitution (DS) than distarch phosphates.[Citation7] In the previous study about starch phosphate monoesterification, it was reported that RS content was positively related to P content (DS) of phosphorylated starch.[Citation8] Whereas, there was no study carried out on the phosphate monoester resistant starch or the modification of RS in food industry. So it is very important to exploit phosphate monoester resistant starch. The purpose of this study was to investigate the properties of phosphate monoester resistant starch from corn, wheat and potato and improve their application quality.
MATERIALS AND METHODS
Materials and Chemicals
Corn starch was isolated by following the method of Sandhu et al.[Citation9] Wheat starch was extracted from the wheat cultivars according to the methods of Peng et al.[Citation10] Potato starch was prepared by using the method of Wickramasinghe et al.[Citation11] Glucoamylase (180,000 U/mL) was provided by Danish Novy Letter Company. Other chemicals, such as NaH2PO4·2H2O, KOH, HCl, and urea, were of analytical grade.
Preparation of Resistant Starch
Resistant starch was prepared according to the method of Köksel et al.[Citation12] with some modification. For resistant starch formation, the samples were subjected to a heat treatment procedure. Three groups of native starch samples were suspended in water (1:3.5, w/v), gelatinized at 85°C for 15 min and autoclaved at 121°C for 30 min. Then, the samples were cooled and stored at 4°C in a refrigerator for 24, 72, and 120 h, respectively, to obtain three kinds of resistant starch with different RS contents. After being dried at 80°C, the samples were ground to pass through a 200-μm sieve.
Preparation of Phosphate Monoester Resistant Starch
The RS was phosphorylated by using the method described by Sitohy et al.[Citation13] with slight modification. In brief, the mixture of sodium dihydrogen phosphate dihydrate (NaH2PO4·2H2O) and urea with the ratio of 10:1 (w/w) were dissolved in the distilled water at 40°C to prepare the salt solution for phosphorylation. Then starch was slurred in the salt solution and the mixture was stirred at room temperature for 30 min and dried at 40°C to a final moisture content of 10–15%. The mixture was placed in an oven at 120°C for 2 h for phosphorylation. The obtained phosphate monoester resistant starch was washed with methanol and distilled water (70:30, v/v) and then dried at 40°C.
Determination of P Content and Degree of Substitution (DS)
Phosphorus was colorimetrically determined by the reaction with ammonium molybdate according to the method described by Zhang et al.[Citation5] The DS of phosphate monoester resistant starch was calculated by Paschall's EquationEq. (1) below:
In the above equation, P indicated dry basis percentage of phosphorous in the phosphate monoester resistant starch.
Determination of RS Content
The RS content was determined according to the method of Goni et al.[Citation14] and Wang et al.[Citation15] The sample (10 mg) was dispersed with 5 mL of 2 M KOH and stirred for 30 min at ambient temperature. After the pH was adjusted to 4.5 with diluted HCl, glucoamylase (0.05 mL) was added and the mixture was incubated at 60°C for 35 min. The released glucose was measured by the glucose oxidase method. The content of resistant starch was calculated as the product of free glucose from resistant starch hydrolysis with glucoamylase and a correction factor of 0.9 as follows: resistant starch = glucose × 0.9. Each representative experiment was performed in triplicate and the average value was taken.
Light Transmittance
The transmittance of phosphate monoester resistant starch paste was determined according to the method of Lim and Seib.[Citation16] The aqueous suspension of starch (1%, w/v) near neutral pH was heated in a boiling water bath for 30 min with intermittent shaking. After the suspension was cooled for 1 h at 25°C, transmittance was read at 650 nm.
Freeze-Thaw Stability
The phosphate monoester resistant starch paste (2%, w/v) was used to determine the freeze-thaw stability following the method of Pongsawatmanit et al.[Citation17] The paste was cooled to 25°C and then 20 g of the paste was put into a centrifuge tube, stored in a freezer (−20°C) for 24 h, and then thawed at room temperature. The sample was centrifuged (10 min, 3000× g) and the residue was collected. The water separating proportion was calculated by EquationEq. (2):
Pasting Properties
The pasting properties were determined with the Rapid Visco Analyser (RVA, model superIV; Newport Scientific Instruments, Australia). The sample (3 g) was suspended in distilled water (25 mL) and placed in an aluminum can containing a plastic paddle. The slurry was first held at 50°C for 1 min, then heated to 95°C at a programmed rate of 3.75°C/min, held at 95°C for 2.5 min, and cooled to 50°C with the speed of 3.75°C/min, then held at 50°C for 2 min. The viscosity values were recorded throughout the temperature range of gelatinisation followed by subsequent retrogradation. All experiments were carried out at least in duplicate, and the averages of the measurements were reported.
Fourier Transform-Infrared (FT-IR) Spectroscopy
In order to further determine the structure of phosphate monoester resistant starch, the FT-IR spectra were obtained using FT-IR (Nicolet 470; PerkinElmer Inc., MA, USA). The spectra were recorded in transmission mode from 4000 to 400 cm−1 (mid-infrared region) at a resolution of 0.44 cm−1. The sample was diluted with KBr (1:100, w/w) before acquisition and the background value from pure KBr was acquired before the sample was scanned.
RESULTS AND DISCUSSION
Effect of RS Content on the DS of Phosphate Monoester Resistant Starch
The DS of phosphate monoester resistant starch was shown in . Under the same esterification condition, DS of phosphate monoester resistant starches from corn, wheat, and potato decreased with the increase of RS content. The result indicated that the molecular structure of resistant starch was compact, and the phosphate esterification of resistant starch was hindered. In addition, the DS of phosphate monoester resistant starch from potato was higher than that from corn and wheat.
Table 1 RS content and DS of phosphate monoester resistant starch from different starches
Effect of Phosphate Monoesterification on RS Content
The RS content of phosphate monoester resistant starch was shown in . The RS content of phosphate monoester resistant starch from corn, wheat, and potato increased after phosphate esterification. It was apparent that the anti-digestibility of resistant starch could be further enhanced after being modified with phosphate esterification. In addition, phosphate esterification had the greatest effect on potato RS content and the value increased from 7.22 to 11.79 after modification. The effect of phosphate esterification on corn RS content was weak since the value only increased 0.83. These results indicated that phosphate monoester resistant starch from potato formed a tightly packed structure. The higher the amount of tightly packed structures, the higher the amount of RS.[Citation18] Based on previous reports, RS content was positively related to P content of phosphorylated starch.[Citation8]
Table 2 Effect of phosphate monoesterization on RS content
Light Transmittance
The light transmittance of starch paste from different samples was shown in . The resistant starch samples could not form uniform paste, so the light transmittance could not be measured. However, the phosphate monoester resistant starch samples could form uniform paste, and had certain light transmittance. The light transmittance of potato phosphate monoester resistant starch was especially obvious. The repulsion between adjacent starch molecules caused by the negatively charged phosphate groups apparently reduced interchain associations and increased the levels of hydrated molecules. Therefore, the phosphate monoester resistant starch sample could form the starch paste with better light transmittance.
Table 3 Light transmittance (%) of starch paste from different samples
Freeze-Thaw Stability
Freeze-thaw stability is an important property in the food industry. In cold chain storage, thermal fluctuation and consequent phase change of water are the main causes of deterioration in frozen food, especially in the gel matrix of starch.[Citation17] During cold storage, the reorganization of starch molecules may result in the release of water (or syneresis) and this may affect the functional properties in terms of viscosity or gel behavior. showed the freeze-thaw stabilities of the starch pastes from different samples. Compared with that of native starch, the water separation from the RS paste increased, which indicated that the RS sample had poor freeze-thaw stability. The water separation from the phosphate monoester resistant starch was lower than that of the RS, which suggested that the freeze-thaw stability of RS could be improved after phosphate esterification. This was mainly because the repulsive effect of introduced phosphate groups within the starch molecules prevented reassociation and promoted water binding.
Table 4 Water separating proportion (%) of starch paste from different samples
For the three kinds of starch, the water separation of native starch, resistant starch, and phosphate monoester resistant starch from the potato was the lowest and that from corn was the highest. These results indicted that the freeze-thaw stabilities of potato starch and its modified RS were the best while those of corn starch and its modified RS were the poorest.
Pasting Properties
showed that the RVA viscosity parameters of native starch, RS, and phosphate monoester resistant starch from corn, wheat, and potato were different. It was significant that the native starches exhibited much higher peak viscosities compared with RS and phosphate monoester resistant starches. Köksel et al.[Citation18] prepared corn RS with acid hydrolysis, autoclaving, and storage (95°C for 2, 3, and 4 days) and found that RVA peak and final viscosity values of the corn RS samples decreased gradually for each storage period with increasing hydrolyzation level and RS contents increased to 13.6–16.7% as a result of storage. Lower viscosities observed for RS were attributed to its compact molecular structure.
Figure 1 RVA curves of native corn starch and corn phosphate monoester resistant starch: (1) corn starch; (2) corn resistant starch; (3) corn phosphate monoester resistant starch (DS: 0.018); (4) corn phosphate monoester resistant starch (DS: 0.021); and (5) corn phosphate monoester resistant starch (DS: 0.027).
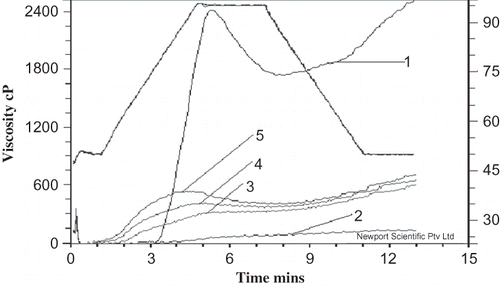
Figure 2 RVA curves of wheat phosphate monoester resistant starch: (1) wheat starch; (2) wheat resistant starch; (3) wheat phosphate monoester resistant starch (DS: 0.018); (4) wheat phosphate monoester resistant starch (DS: 0.023); and (5) wheat phosphate monoester resistant starch (DS: 0.025).
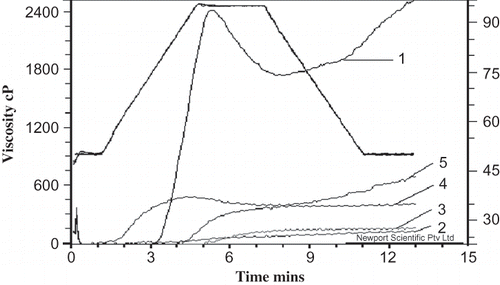
Figure 3 RVA curves of potato phosphate monoester resistant starch: (1) potato starch; (2) potato resistant starch; (3) potato phosphate monoester resistant starch (DS: 0.02); (4) potato phosphate monoester resistant starch (DS: 0.023); and (5) potato phosphate monoester resistant starch (DS: 0.026).
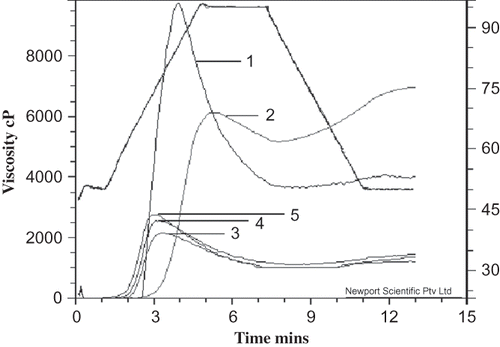
For corn () and wheat starch (), the viscosity of phosphate monoester resistant starch increased compared with resistant starch, and the peak and final viscosities increased with the increase of the DS of phosphate monoester resistant starch. The negatively charged phosphate groups are known to cause interchain repulsion and reduce hydrogen bond formation among adjacent molecules. This enables extensive water penetration and starch granule hydration, resulting in a higher peak viscosity. But potato RS () exhibited much lower peak viscosity and higher final viscosity than that of native starch. The peak, final viscosity, and pasting temperature of the potato phosphate monoester resistant starch samples decreased much compared with that of native potato starch and potato RS. The paste viscosity increased and pasting temperature decreased with the increase of the DS of potato phosphate monoester resistant starch. The reason why the viscosity of the potato phosphate monoester resistant starch was lower than that of potato RS needed to be further studied.
Fourier Transform-Infrared Spectroscopy
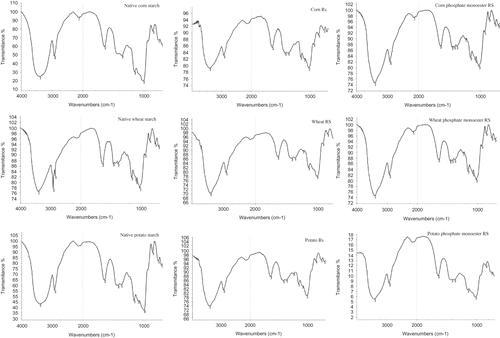
presents the FT-IR spectra of native starches and RS samples from different sources. All starches exhibited a similar pattern. The band absorbency in starch has been assigned and matched with the vibrational modes of the chemical bonds by many researchers. In our study, the native corn starches and native potato starches showed 10 peaks while the native wheat starch showed 13 peaks in the region of 3700–800 cm−1. The resistant starches and phosphate monoester resistant starches showed more peaks than the native starches. As shown in , the peaks at 3405 cm−1 and 2930 cm−1 could be attributed to O–H and C–H bond stretching, respectively. While the peaks at 1420 cm−1 and 1366 cm−1 were attributed to the bended modes of H–C–H, C–H, and O–H. The peaks at 1300–1000 cm−1 were attributed to C–O–H stretching. The peaks at 1155, 1097, and 1019 cm−1 were assigned as the C–O bond stretching. The new peak of phosphate monoester resistant starch indicated the formation of the new group in the starch structure. The peak was presented at near 1244 cm−1, belonging to P=O stretching vibration. Zhang et al.[Citation5] reported that P=O stretching vibration of resistant canna edulis ker starch phosphate monoester was presented at near 1400 cm−1.
Figure 4 Fourier transform-infrared spectrum of native starches and resistant starches.
CONCLUSIONS
In summary, the properties of the resistant starches from corn, wheat, and potato starch were improved after phosphate esterification modification. The resistant starch content and light transmittance of phosphate esterification resistant starch were increased, and the freeze-thaw stabilities of phosphate esterification resistant starch were also improved. The pasting properties of phosphate esterification resistant starches from corn, wheat, and potato starch were different. From FT-IR results, the peak at 1244 cm−1, which corresponded to the P=O bond in starch, was apparent in all phosphate esterification resistant starch. The obtained result in this study was very important for the application of phosphate monoester resistant starch.
Related Research Data
REFERENCES
- Kim , M.J. , Choi , S.J. , Shin , S.I. , Sohn , M.R. , Lee , C.J. , Kim , Y. , Cho , W.I. and Moon , T.W. 2008 . Resistant glutarate starch from Adlay: Preparation and properties . Carbohydrate Polymers , 74 ( 4 ) : 787 – 796 .
- Brumovsky , L.A. , Brumovsky , J.O. , Fretes , M.R. and Peralta , J.M. 2009 . Quantification of resistant starch in several starch sources treated thermally . International Journal of Food Properties , 12 ( 3 ) : 451 – 460 .
- Escarpa , A. , González , M.C. and Morales , M.D. 1997 . An approach to the influence of nutrients and other food constituents on resistant starch formation . Food Chemistry , 60 ( 4 ) : 527 – 532 .
- Xie , X. , J; Liu , Q. and Steve , W.C. 2006 . Studies on the granular structure of resistant starches (type 4) from normal, high amylose and waxy corn starch citrates . Food Research International , 39 ( 3 ) : 332 – 341 .
- Zhang , J. and Wang , Z. W. 2009 . Optimization of reaction conditions for resistant canna edulis ker starch phosphorylation and its structural characterization . Industrial Crops and Products , 30 ( 1 ) : 105 – 113 .
- Thompson , D.B. 2000 . Strategies for the manufacture of resistant starch . Trends in Food Science & Technology , 11 ( 7 ) : 245 – 253 .
- Schirmer , M.A. , Toledo , M.C.F. and Reyes , F.G.R. 1986 . Effect of food ingredients on the viscosity of phosphate monoesters of corn starch . Starch , 38 ( 4 ) : 124 – 128 .
- Sang , Y.J. , Prakash , O. and Seib , P.A. 2007 . Characterization of phosphorylated cross-linked resistant starch by 31P nuclear magnetic resonance (31P-NMR) spectroscopy . Carbohydrate Polymer , 67 ( 2 ) : 201 – 212 .
- Sandhu , K.S. , Singh , N. and Malhi , N.S. 2005 . Physicochemical and thermal properties of starches separated from corn produced from crosses of two germ pools . Food Chemistry , 89 ( 4 ) : 541 – 548 .
- Peng , M. , Gao , M. , Ahdel-Aal , E.S.M. , Huel , P. and Chihbar , R.N. 1999 . Separation and characterization of A- and B-type starch granules in wheat endosperm . Cereal Chemistry , 76 ( 3 ) : 375 – 379 .
- Wickramasinghe , H.A.M. and Takigawa , S. 2009 . Comparative analysis of starch properties of different root and tuber crops of Sri Lanka’ . Food Chemistry , 112 ( 1 ) : 98 – 103 .
- Koksel , H. , Masatcioglu , T. , Kahraman , K. , Ozturk , S. and Basman , A. 2008 . Improving effect of lyophilization on functional properties of resistant starch preparations formed by acid hydrolysis and heat treatment . Journal of Cereal Science , 47 ( 2 ) : 275 – 282 .
- Sitohy , M.Z. , Labib , S.M. , El-Saadany , S.S. and Ramadan , M.F. 2000 . Optimizing the conditions for starch dry phosphorylation with sodium mono- and dihydrogen orthophosphate under heat and vacuum . Starch/Stake , 52 ( 4 ) : 95 – 100 .
- Goni , I. , García-Diz , L. , Mañas , E. and Saura-Calixto , F. 1996 . Anlysis of resistant starch: A method for foods and food products . Food Chemistry , 56 ( 4 ) : 445 – 449 .
- Wang , J. , Jin , Z.Y. and Yuan , X.P. 2007 . Preparation of resistant starch from starch–guar gum extrudates and their properties . Food Chemistry , 101 ( 1 ) : 20 – 25 .
- Lim , S. and Seib , P. A. 1993 . Preparation and pasting properties of wheat and corn starch phosphates . Cereal Chemistry , 70 ( 2 ) : 137 – 144 .
- Pongsawatmanit , R. , Temsiripong , T. , Ikeda , S. and Nishinari , K. 2006 . Influence of tamarind seed xyloglucan on rheological properties and thermal stability of tapioca starch . Journal of Food Engineering , 77 ( 1 ) : 41 – 50 .
- Köksel , H. , Basman , A. , Kahraman , K. and Ozturk , S. 2007 . Effect of acid modification and heat treatments on resistant starch formation and functional properties of corn starch . International Journal of Food Properties , 10 ( 4 ) : 691 – 702 .