Abstract
Rice glutelin protein isolates were extracted from export quality Pakistani rice varieties and their milling fractions, characterized by dry matter yield, protein content, molecular weight profile using sodium dodecyl sulfate polyacrylamide gel electrophoresis (SDS-PAGE) and also explored the functional properties. The glutelin protein content and its dry matter yield varied significantly among rice varieties and their milling fractions. The highest dry matter yield and protein content was found in brown rice of Basmati 2000 rice variety and the lowest dry matter yield and protein content was observed in white rice of KS-282. The electrophoretic pattern showed 11 different molecular weight subunits with three major polypeptides observed at 32.1 to 34.0, 23.9 to 24.5, and 12.1 to 16.1 kDa, respectively. The overall electrophoretic profile and alpha glutelin subunits in different rice samples ranged from 12.1 to 100.9 and 32.1 to 34.0 kDa, respectively, while beta glutelin subunits ranged from 23.9 to 24.5 kDa. The variation in rice milling fractions did not show any effect on the molecular weight subunit composition of glutelin within a variety. Little is known about its functional properties, which have been shown to be variety specific. Thus, it is of importance to examine glutelin isolates from Pakistani rice varieties. The functional properties of glutelin isolates showed a non-significant effect on foaming capacity and stability within varieties, and overall it had poor foaming properties but it had good gelling properties, which may be a very promising characteristic for its use in different food applications.
INTRODUCTION
The major endospermic rice protein is glutelin,[Citation1,Citation2] which comprised up to 70 to 80% of total rice protein.Citation[3] JanickCitation[4] also found 70% of glutelin protein in rice flour as compared to other cereals, which were higher in prolamin contents. The biochemical characterization of rice proteins shows the important nutritional properties and these characteristics can be studied by so many analytical techniques. The major dominant techniques utilized by the cereal chemists are the electrophoresis, such as sodium dodecyl sulfate (SDS)-polyacrylamide gel electrophoresis (PAGE), acid-PAGE, etc., which have been developed to separate cereal proteins.[Citation5,Citation6] SDS-PAGE is an influential tool used to acquire molecular pictures of food proteomes and examine the quality effects on protein profile of different food items. The quality of rice is governed by the interaction of many constituents; therefore, it is difficult to assess quality of rice by any single test. Protein quality assessment through electrophoresis has been progressively more familiar as a valuable tool in measuring protein quality and functionality of different rice varieties for their end use.
Rice glutelin is composed of alpha and beta subunits, which were separated into alpha-1 (39 kDa), alpha-2 (38 kDa), alpha-3 (37.5 kDa and 37 kDa), and alpha-4 (34 and 33 kDa) for the alpha subunit, and beta-1 (23 kDa), beta-2 (22.5 kDa), and beta-3 (22 kDa) bands for the beta subunit, respectively.Citation[7] Glutelin protein is also valuable because it may be useful in many food applications. Glutelin possesses several functional properties, such as gelling and foaming.[Citation8,Citation9] The foaming and emulsifying properties of rice bran protein isolates are similar to egg white foaming properties, but emulsifying properties are lower than bovine serum albumin.Citation[10] The present study was designed to isolate glutelin protein fractions from Pakistani rice varieties along with their milling fractions, characterized using SDS-PAGE and explored their functional properties for suitability in food applications.
MATERIALS AND METHODS
Samples
The four rice varieties (IRRI-6, KS-282, Basmati 2000, and Super Basmati) were procured from the Rice Research Institute, Kala shah kaku. The paddy of each variety was dehulled and milled by passing through a stake sheller. The McGill laboratory mill (Rapsco, Inc., Brookshire, TX, USA) was used to obtain two fractions of each rice variety, such as brown rice and white rice. A portion of rice fractions, each of white and brown rice, was milled by passing through a cyclone mill (Udy Corp, Fort Collins, CO, USA) to get rice flour for further studies. The code number was assigned to each sample as described in given below.
Table 1 Sample code of rice varieties with milling fractions
Methods
Isolation of glutelin protein
The isolation of glutelin fraction was performed according to the procedure described by Agboola et al.Citation[11] The brown and white rice flour samples (100 g) were de-fatted with 400 mL hexane using the soxhlet extraction technique. The de-fatting procedure was repeated twice to maximize removal of the lipid components. The de-fatted rice flour samples were then dried under a hood at an ambient temperature for 24 h, and the resulting flour was stored in airtight glass jars at ambient temperature. The glutelin isolates from brown and white rice flour were extracted without the prior removal of albumin and globulin fractions. Twenty-five grams of rice flour of each sample was mixed up with 300 ml of 0.1 M NaOH and swirled at room temperature by using a magnetic stirrer for almost 1 h, and then it was centrifuged at 3000 g for 30 min. The supernatant was taken out and pH was adjusted at 4.8 with 1 M HCl. The precipitates (glutelin) were washed twice with distilled water and they were freeze-dried using a freeze dryer.
Characterization of glutelin fractions
At the end, the isolated proteins were characterized by yield, protein content (%N × 5.95). The dry matter yield (DMY) was obtained by weighing the freeze-dried isolates and the protein content (purity) determined from the Kjeldahl method given in AACC,Citation[12] and the nitrogen content was multiplied by 5.95.
SDS-PAGE analysis
A rich glutelin isolate of all rice samples were characterized by SDS-PAGE using the Laemmli buffer system as given by Laemmli.Citation[13] The samples were separated on a pre-cast gel (4–20% gradient; Bio-Rad Laboratories, Cat. #161–1105), using the Bio-Rad Mini PROTEAN® 3 system (Bio-Rad Laboratories, Hercules, CA, USA). The samples were loaded at 5 μL/lane. The gels were run at constant 70 V until the front dye was judged to have migrated sufficiently far down the gel. The gels were stained with 150 mL Coomassie Brilliant Blue R–250 dye and distained with 100 mL methanol, acetic acid water mixture distaining solution. The protein bands were imaged in a gel documentation (Syngene, Cambridge, UK) system. On the first well of each gel, the proteins employed as molecular weight (Daltons) markers were Myosin, 200,000; ß-galactosidase, 116,250; phosphorylase b, 97,400; serum albumin, 66,200; ovalbumin, 45,000; carbonic anhydrase, 31,000; trypsin inhibitor, 21,500; lysozyme, 14,400; and aprotinin, 6500 (SDS-PAGE MW standards, Broad range, Cat. #161–0317, Bio-Rad Laboratories, Hercules, CA, USA).
Determination of Functional Properties
Foam capacity and foam stability
Foaming properties (foam capacity and foam stability) of glutelin protein isolates were estimated by the method of Miller and GronigerCitation[14] with minor modifications. The protein isolates (1% w/v) were mixed with 100 mL 0.01 M phosphate buffer and added to a blender. The mixture was blended for 1 min at high speed. The entire mixture was then shifted to a 250-mL measuring cylinder to measure the volume after blending. Foam capacity was calculated as the volume of mixture after blending divided by the original volume. A plot of foam capacity against time for 10 min gave an indication of stability.
Least gelation concentration (LGC)
The LGC of glutelin protein isolate was estimated according to the method of Huda et al.Citation[15] as modified by Agboola et al.Citation[12] The 10-mL dispersions between 1 and 10% (w/v) solids concentration were prepared in the test tubes. The dispersions were homogeneously mixed on a vortex mixer for 5 min and heated at 90°C for 30 min in a water bath. The mixtures of these isolates were then cooled at 5°C for 1 h. After which, each test tube was inverted. The lowest concentration at which the sample did not slip or fall down from an inverted test tube is the LGC.
Statistical Analysis
The analysis of variance was used to analyze the data according to the method described by Steel et al.Citation[16] Completely randomized design was applied on the data to assess the significance level and differences among means were compared with Duncan's Multiple Range Test.
RESULTS AND DISCUSSION
Isolation of Glutelin Protein and Characterization
The glutelin DMY and protein content extracted from different rice fractions () shows the affect of glutelin protein content and its DMY, which varied significantly among rice varieties and milling fractions. The highest recovery of glutelin DMY (5.77 g/100 g) was recorded in Basmati 2000. However, rice varieties Basmati 2000 and Super Basmati were found statistically at par with respect to glutelin protein content. The glutelin DMY were relatively higher in the brown rice milling fraction (5.84 g/100 g) as compared to the white rice fraction (5.29 g/100 g). Similarly, the brown rice fraction was also found to produce more glutelins protein content (5.70 g/100 g) as compared to the white rice milling fraction (5.02 g/100 g). The results of the present study clearly indicated that brown rice milling fraction was superior to white rice milling fraction regarding glutelin content. The highest DMY and protein content was found in milling fraction B2-B and the lowest DMY and protein content was observed in KS-W rice milling fraction. The glutelin is the major fractional component ranges for 70–88%, as reported by Haard et al.,Citation[17] in brown and white rice. They reported that brown rice content was higher in glutelin content as compared to white rice, which is also reported by Gurpreet and Sogi.Citation[18]The findings obtained in this present study are in line with the observations of Wieser et al.Citation[19] and Padhye and Salunkhe,Citation[20] who reported the mean ratios of glutelin as 80% for brown rice and 70% for white rice. The variation in brown and white rice milling fraction may be due to bran portion that also contains glutelin protein, which is also concluded by the work of Agboola et al.Citation[11] and Thind and Sogi.Citation[21]
Table 2 Glutelin DMY and protein content of different rice cultivars with their milling fractions
Molecular Weight Analysis of Glutelin Protein Isolates Using SDS-PAGE
The glutelin protein fractions of different rice varieties were analyzed through SDS-PAGE and the results interpreted are given in . The glutelin fractions of different rice samples consisted of 11 different glutelin molecular weight subunits with three major polypeptides (). The electrophoregrams () indicated that three predominant glutelin subunits bands were observed at 32.1 to 34.0 kDa, 23.9 to 24.5 kDa, and 12.1 to 16.1 kDa. The electrophoretic profile of glutelin subunits in different rice samples revealed that molecular weights for all subunits ranged from 10.1 to 100.9 kDa. The results show that the highest molecular weight glutelin subunit (>100 kDa) was found in SB-B, SB-W, B2-B, B2-W, and KS-W. A wide variation with respect to high molecular weight subunits in different rice flour samples occurred. The low molecular weight glutenin subunits represented their molecular weight ranged from 10.1 kDa to 67.3 kDa. The brown rice of IRRI-6 ranged from 12.5 to 62.6 kDa, IRRI-W (12.1 to 63.3 kDa), KS-B (12.1 to 64.0 kDa) KS-W (13.4 to 64.0 kDa), B2-B (13.4 to 64.0 kDa), B2-W (12.5 to 65.4 kDa), SB-B (10.1 to 64.7 kDa), and SB-W (12.9 to 67.3 kDa). It is also obvious from the results that alpha glutelin subunits ranged from 32.1 to 34.0 kDa, while beta glutelin subunits ranged from 23.9 to 24.5 kDa. The results further showed that variation in rice milling fractions did not show any effect on the molecular weight subunit composition of glutelin within a variety or milling fraction. It is clearly evident from the results that there was variation in occurrence of the molecular weight subunits of the glutelin. The results for these rice varieties described that the Super Basmati variety possessed a molecular weight subunit of glutelin with higher intensity as compared to these subunits found in other rice varieties.
Table 3 Estimation of glutelin molecular weight subunits by SDS-PAGE in different rice samples
Figure 1 Presence of glutelin molecular weight subunits in different rice samples by SDS-PAGE. M = Marker, 1 = IRRI-B, 2 = IRRI-W, 3 = KS-B, 4 = KS-W, 5 = B2-B, 6 = B2-W, 7 = SB-B, 8 = SB-W.
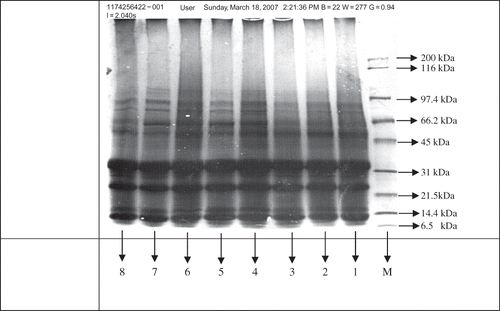
The glutelin is the main protein in rice seed and change in glutelins may alter protein quality of seed. Rice glutelin is composed of alpha and beta subunits.Citation[5] These subunits have been separated into alpha (∼39 kDa) and beta (∼23 kDa), respectively. The present study also showed the predominance of these subunits in these areas, as reported by Jahan et al.Citation[7] In the present study, the rice glutelin subunits ranged from 12.1 to 16.1 kDa and 51.3 to 55.4 kDa, which are in agreement with the findings of Steenson and Sathe.Citation[22] The results regarding the identification of glutelin molecular weights (51.3 to 55.4 kDa) are also supported with Yamagata et al.,Citation[23] Luthe,Citation[24] Robert et al.,Citation[25] and Krishnan and Okita,Citation[26] who found that glutelin protein of rice is processed post-translationally from 52 to 57 kDa precursor into alpha and beta subunits with molecular weights ranging from 34 to 37 kDa and 21 to 24 kDa, respectively. Several researchers, such as Juliano and Boulter,Citation[27] Snow and Brooks,Citation[28] and Zarins and Chrastil,Citation[29] have reported the molecular weight of glutelin polypeptides in the range of 14 to 51 kDa. But in the present study, higher molecular weight glutelin polypeptides were identified. This difference may have been attributed due to the differences in the genetic makeup of rice varieties tested in different studies, as Martinez et al.Citation[30] has found molecular weights for glutelin subunits to be in the range of 13 to 100 kDa interval with ranging 14, 18, 22, 34, and 57 kDa in a higher proportion, which supports the results obtained in the present study. The glutelin molecular weights (∼13 kDa and ∼16.1 kDa) recorded in the present study may be representing the prolamins fractions, which is difficult to completely extract and is a contamination of rice glutelin.Citation[31] The glutelin subunits, 24 and 34 kDa, exhibited more intensity as compared to other identified subunits, which may also have higher proportion of the polypeptides of glutelin in the rice varieties.
Functional Properties of Glutelin Protein Isolates
Least gelation concentration (LGC)
The results regarding LGC of different rice varieties at different pH are presented in . It is evident from the results that all the rice varieties showed similar responses for LGC value, which ranged from 4 to 5% at pH 7 and 5 to 7% at pH 9 among different rice varieties and milling fractions. The protein isolates from the rice varieties showed maximum strength of gels at pH 7 followed by pH 9. It was observed that the LGC decreased as the pH value moved away from the isoelectric region.
Table 4 Least gelation concentration (LGC %) for glutelin protein isolates of different rice samples at different pH
Gel formation of proteins is the result of a two-step process involving the partial denaturation of individual proteins to allow more access to the reactive side groups within the protein molecules, and the aggregation of these proteins by means of reactive side groups into a continuous three-dimensional network structure capable of retaining a significant amount of water and also exhibiting some structural rigidity.Citation[32] Thus, forming stable gels, the higher LGC in white rice of Super Basmati might be due to more denatured proteins. The results in the present study indicated maximum gel strength (LGC) at pH 7; however, different rice varieties did not exhibit clear variation for this qualitative parameter. The values obtained from the present study are comparable with those reported for rice protein isolate by Agboola et al.[11] and Lasztity.Citation[33] Mulvihill and KinsellaCitation[34] reported that the whey protein concentrate is a special gelling agent, which forms the stable gel at a higher concentration ranging from 8 to 10.5% between pH range 6.5 and 9. This gelling agent, at this range of concentration is used in many food products. In the present study, the rice protein glutelins were able to form stable gels at lower concentrations, which may be due to the presence of more disulphide bonds that might have contributed to this effect. The formation of stable gels at lower concentrations is a very promising characteristic for the use of these proteins in different food applications.
Foaming properties
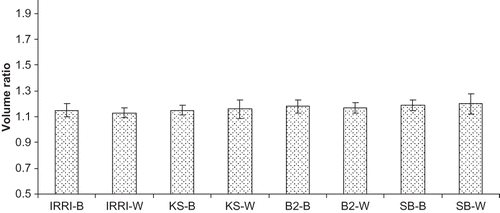
The foaming capacity measured at pH 7 of different rice varieties differed non-significantly among different rice varieties. It is obvious from that foaming capacity ranged from 1.13 to 1.20 among protein isolates of different rice varieties. The brown and white milling fractions of Super Basmati rice variety possessed the highest foaming capacity, and the lowest foaming capacity was found in white rice of IRRI-6 variety. The milling fractions of rice varieties IRRI-6, KS-282, Basmati 2000, and Super Basmati showed non-significant differences.
Figure 2 Foaming capacity for glutelin protein isolates of different rice samples.
The foaming stability of various rice protein isolates showed a non-significant effect of rice varieties on foaming stability of protein isolates. The foam formed from all rice varieties is presented in and the volume of the foam at 5 and 10 min was considered the stability of the foam. It is evident from results that the volume of foams decreased significantly at 5 min but the decrease in foam from 5 min onward was non-significant. It is also obvious from the results that foaming stability decreased progressively during the first 5 min, while the foams remained stable during 5 to 10 min. The volume of foam at 10 min was found to be the highest in white rice of Basmati 2000. The range of foam at 5 min was 1.01 to 1.07 and at 10 min was found to be 1.00 to 1.06. It is evident that initially foam decreased significantly and after 5 min it was quite stable.
Figure 3 Foaming stability for glutelin protein isolates of different rice samples.
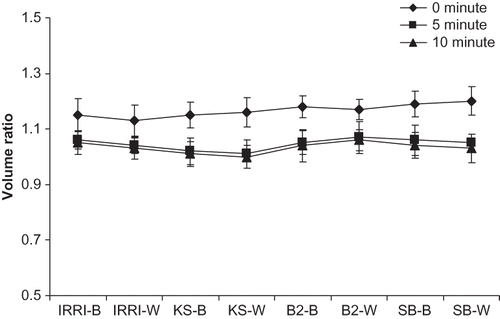
The results of the present study fall within the ranges reported by Agboola et al.,[11] who observed the foam capacity ratio (1.10 to 1.40) and lower stability for rice glutelins at pH 7. The poor stability at pH 7.0 that persisted for only 11–15 min was also reported by Gupta et al.Citation[35] The lower stability values for rice glutelins at this pH may be directly linked to poor solubility and lack of flexibility due to high content of disulphide bonds.Citation[36]
CONCLUSION
Indica rice glutelin protein isolates could be characterized on the basis of their DMY, protein content, electrophoretic, and functional aspects. Differences of all glutelin fractions were observed. The affect of glutelin DMY and its protein content also varied significantly among rice varieties and milling fractions. The SDS-PAGE analyses showed 11 molecular weight bands for glutelin protein fractions ranging from 10.1 to 100.9 kDa with major polypeptides ά-glutelin and β-glutelin subunits identified at ∼34 and ∼24 kDa in all of the milling fractions. The rice glutelin had poor foaming properties, but it had good gelling properties that may be a promising character for other food applications.
REFERENCES
- Tecson , E.M.S. , Esmana , B.V. , Lontok , L.P. and Julaino , B.O. 1971 . Studies on the extraction and composition of rice endosperm: Glutelin and prolamine . Cereal Chemistry , 48 : 186 – 191 .
- Villareal , C.P. , Maranvill , J.W. and Juliano , B.O. 1991 . Nutrient content and retention during milling of brown rice from the International Rice Research Institute . Cereal Chemistry , 68 : 437 – 439 .
- Ma , C.Y. 2005 . Raman spectroscopic study of rice seed glutelin . IFT Annual Meeting, New Orleans, Louisana, July , : 15 – 20 .
- Janick, J. Rice: The natural history of rice. 2002 http://www.hort.purdue.edu/newcrop/tropical/lecture_20/rice.html (http://www.hort.purdue.edu/newcrop/tropical/lecture_20/rice.html) (Accessed: 24 September 2006 ).
- Uemura , Y.J. , Satoh , H. , Ogawa , M. , Suchisa , H. , Katayama , T.C. and Yoshimura , A. 1996 . “ Chromosomal location of genes encoding glutelin polypeptides in rice ” . In Rice Genetics III; Kush, G.S , 471 – 476 . Los Banos, Manial, , Philippines : International Rice Research Institute .
- Bean , S.R. and Lookhart , G.L. 2000 . Electrophoresis of cereal storage proteins . Journal of Chromatography A , 888 ( 1–2 ) : 23 – 26 .
- Jahan , M.S. , Uemura , Y. , Kumamaru , T. , Hamid , A. and Satoh , H. 2005 . Genetic variation of glutelin acidic subunit polypeptides in Bangladesh rice genetic resources . Genetic Resources and Crop Evolution , 52 : 977 – 987 .
- Chen , L.O. , Cheng , M. and Chen , S.G. 1987 . Similarity and diversity of seed proteins in rice varieties . Botanical Bulletin of Academia Sinica , 28 : 169 – 183 .
- Okuzaki , M. , Negishi , M. and Sugahara , Y. 1997 . Protein contents and amino acid scores of protein in Japanese paddy non-glutinous rices . Food Science and Technology Research , 44 : 659 – 665 .
- Wang , M. , Hettiarachchy , N.S. , Qi , M. , Burks , W. and Siebenmorgen , T. 1999 . Preparation and functional properties of rice bran protein isolate . Journal of Agriculture and Food Chemistry , 47 ( 2 ) : 411 – 416 .
- Agboola , S. , Darren , N.G. and Mills , D. 2005 . Characterization and functional properties of Australian rice protein isolates . Journal of Cereal Science , 41 : 283 – 290 .
- AACC . 2000 . Approved Methods of the American Association of Cereal Chemists , 10th , St. Paul, MN : American Association of Cereal Chemists, Inc .
- Laemmli , U.K. 1970 . Cleavage of structural proteins during the assembly of the head of bacteriophage T4 . Nature , 227 : 680 – 685 .
- Miller , R. and Groniger , H.S. 1976 . Functional properties of enzyme modified acylated fish protein derivatives . Journal of Food Science , 41 : 268 – 272 .
- Huda , N. , Abdulla , A. and Babji , A.S. 2001 . Functional properties of surimi powder from three Malaysian marine fish . International Journal of Food Science and Technology , 36 : 401 – 406 .
- Steel , R.G.D. , Torrie , J.H. and Dickey , D.A. 1997 . Principles and Procedures of Statistics: A Bio-Metrical Approach , 3rd , New York : McGraw Hill Book Co., Inc .
- Haard , N.F. , Odunfa , S.A. , Lee , C.H. , Ho , C. , Lorence , R. and Argelia; Carmen , W. 1999 . Major chemical components of cereals grains , Rome, Italy : In Fermented Cereals. A Global Prospective; Food and Agriculture Organization of the United Nations .
- Gurpreet , K.S. and Sogi , D.S. 2007 . Biochemical characterization of rice protein fractions . International Journal of Food Science and Technology , 42 : 1357 – 1362 .
- Wieser , H. , Seilmeier , W. and Belitz , H.D. 1980 . Comparative studies about such amino sauresaquenzen prolamins and glutelins from different cereaus.11 . Fractionation of glutelins. Z. Lebensm. Unters. Forsch , 171 : 430 – 436 .
- Padhye , V.W. and Salunkhe , D.K. 1979 . Extraction and characterization of rice proteins . Cereal Chemistry , 56 : 389 – 393 .
- Thind , G.K. and Sogi , D.S. 2005 . Identification of coarse (IR-8), fine (PR-106), and superfine (Basmati-386) rice cultivars . Food Chemistry , 91 : 227 – 233 .
- Steenson , D.F. and Sathe , S.K. 1985 . Characterization and digestibility of Basmati rice (Oryza sativa L. var Dehraduni) storage proteins . Cereal Chemistry , 72 : 275 – 380 .
- Yamagata , H. , Sugimoto , T. , Tanaka , K. and Kasai , Z. 1982 . Biosynthesis of storage proteins in developing rice seeds . Plant Physiology , 70 : 1094 – 1100 .
- Luthe , D.S. 1983 . Storage protein accumulation in developing rice seeds . Plant Science Letters , 32 : 147 – 158 .
- Robert , L.S. , Nozzolillo , C. and Altossar , I. 1985 . Homology between rice gluten and oat 12S . Globulin. Biochomica ed Biophysica Acta-Protein Structure and Molecular Enymology. , 829 : 19 – 26 .
- Krishnan , S.B. and Okita , T.W. 1986 . Structural relationship among the rice glutelin polypeptides . Plant Physiology , 81 : 748 – 753 .
- Juliano , B.O. and Boulter , D. 1976 . Extraction and composition of rice endosperm glutelin . Phytochemistry , 15 : 1601 – 1606 .
- Snow , S.D. and Brooks , J.R. 1989 . Fraction of rice gluten polypeptides using gel filtration chromatography . Journal of Food Science , 54 : 730 – 733 .
- Zarins , Z. and Chrastil , J. 1992 . Separation and purification of rice oryzenin subunits by anion exchange and gel permeation chromatography . Journal of Agriclture and Food Chemistry , 40 : 1599 – 1601 .
- Martinez , L.A. , Ventura , E. , Maldonado , U. , Sanchez , M.M. , Bazaldua , C. and Del-Villar , A.A. 2005 . Characterization of storage proteins and another culture for the development of high nutritional quality rice genotype . INIFAP , 22 : 41 – 44 .
- Tanaka , K. , Sugimoto , T. , Ogawa , M. and Kasai , Z. 1980 . Isolation and characterization of two types of protein bodies in the rice endosperm . Agricultural Biology and Chemistry , 44 : 1633 – 1639 .
- Elofsson , C. , Dejmek , P. , Paulson , M. and Burling , H. 1997 . Characterization of a cold gelling whey concentrate . International Dairy Journal , 7 : 601 – 607 .
- Lasztity , R. 1996 . The Chemistry of Cereal Proteins , 2nd , Boca Raton, FL : CRC Press .
- Mulvihill , D.M. and Kinsella , J.E. 1987 . Gelation characteristics of whey proteins and β-lactoglubulin . Food Technology , 41 : 102 – 111 .
- Gupta , S. , Chandi , G.K. and Sogi , D.S. 2008 . Effect of extraction temperature on functional properties of rice bran protein concentrates . International Journal of Food Engineering , 4 ( 2 ) : 1 – 19 .
- Graham , D.E. and Phillip , M.C. 1979 . Proteins at liquid interfaces. I. Kinetics of adsorption and surface denaturation . Journal of Colloid and Interface Science , 70 : 403 – 414 .