
Abstract
Commercially available vital wheat gluten was purified with α-amylase and treated with protease in a one-step process. The supernatant of the protease-treated gluten was freeze dried, quench cooled, and aged for 2 weeks and analyzed using differential scanning calorimetry, sodium dodecyl sulfate poly-acrylamide gel electrophoresis, reverse phase high performance liquid chromatography, size exclusion high performance liquid chromatography, capillary zone electrophoresis, and dynamic mechanical analysis. The differential scanning calorimetry profile of the aged (un-purified or un-modified) gluten sample exhibited enthalpic relaxation beneath its glass transition (Tg) indicating molecular relaxation. Samples treated with 0.006 g protease/g gluten showed Tg at 49.11°C with ΔCp = 0.12 (J/°C g). Higher protease levels and longer aging time caused high Tg temperature, ΔCp, and ΔH of enthalpic relaxation. The size exclusion high performance liquid chromatography profile of the protease-treated gluten clearly showed differences in molecular size between the supernatant and the precipitate, while reverse phase high performance liquid chromatography profiles signified more hydrophilic gluten molecules than the control. The small difference in gluten molecular size after protease treatments (0.024 g protease versus 0.032 g) appeared to have a significant effect on the enthalpic relaxation, where the two treatments showed different degrees of enthalpic relation. The capillary zone electrophoresis data confirmed the insignificant difference between 0.024 and 0.032 g protease/g gluten regarding the size to charge ratio. The molecular interactions for protease-treated gluten were much weaker than vital gluten, as indicated by much weaker network and sensitivity to temperature, especially above Tg. The weaker network was evidenced by higher G″ versus G′, which explained the fluid like behavior of the protease-treated gluten.
INTRODUCTION
Heat capacity, coefficient of thermal expansion, and all other physical properties of amorphous materials are vastly different from the physical properties of crystalline materials. Additionally, the physical properties of amorphous materials can change with time as the polymer relaxes (enthalpic relaxation) to the equilibrium state during aging, which can complicate their analysis. The process of enthalpic relaxation (physical aging) is associated with a decrease in the energy content of the material.[Citation1] Physical aging is a very important state for amorphous polymers for both analysis and technology. That being the case, differential scanning calorimetry (DSC) and modulated differential scanning calorimetry (MDSC) can quantify the energy (heat) content of a polymer as well as compare thermodynamic-equilibrium variation between samples; therefore, it can detect differences in anticipated end-use physical properties of a material. At a temperature below glass transition (Tg), amorphous structures have very low molecular mobility and are not at equilibrium.[Citation1,Citation2] Since the energy is higher than it should be at equilibrium, the energy of the material will gradually decrease as it ages toward equilibrium. Once the material is heated above Tg, it has higher molecular mobility and is in thermal equilibrium but, needless to say, there may be some exceptions. Enthalpic relaxation is the recovery of the energy that the polymer gave up (dissipated) as it relaxed toward an equilibrium state over time.[Citation3] Enthalpic relaxation, as detected by DSC, is an endothermic peak located under the Tg profile of aged amorphous polymers. The endothermic peak appears as the sample is heated from below Tg temperature (non-equilibrium) to a temperature above Tg. Because equilibrium is the lowest state of energy, the more energy required to heat the sample above Tg temperature, the closer the sample is to equilibrium. Aging is time and temperature dependent, therefore, samples stored at a temperature well below the Tg temperature will relax very slowly relative to those closer to Tg.[Citation4] Lawton and Wu[Citation5] reported the presence of enthalpic relaxation in wheat gluten isolated from Scout 66 (a wheat variety), a hard red winter wheat variety, using acetic-acid. In addition, these workers reported an increase in relaxation with annealing temperature or time as well as annealing closer to glass transition temperature. Wheat gluten is a glassy polymer at low moisture content and at room temperature and can undergo glass transition either by the plasticizing effect of water or by raising its temperature.[Citation6–9 Citation Citation Citation−9 Although, glass transition and aging of synthetic polymers have been investigated at length, its importance to biomaterial has been developed only lately. Relaxation was observed for casein, elastin, and gliadin during DSC analysis.[Citation10–12 Citation Citation−12
Previous publications were focused on observing gluten thermal properties at low moisture content, either by reporting the presence of glass transition or by studying the enthalpic relaxation of acetic acid-soluble wheat proteins, which represents only a portion of wheat gluten. The acetic acid-soluble wheat protein contains a representative sample of high and low molecular weight glutenins, but mostly it contains low molecular weight glutenins and gliadins. The objectives of this work were to develop practical and economical ways to facilitate gluten relaxation by using commercially available wheat gluten (for practical reasons) rather than using just the acetic acid isolates or gluten fractions, such as gliadins. The outcome of this work will allow for detecting enthalpic relaxation of commercial vital gluten with minimal processing. The relevance of this work is: (1) economical; where commercially available vital gluten will be used without need for fractionation, and (2) technological; where the developed process will produce a product with certain characteristics that can be used in different food product development.
EXPERIMENTAL
Materials
Vital wheat gluten (75% protein, 11% starch, and 8% moisture) was obtained from Midwest Grain Products (Pekin, IL, USA). Alpha-amylase (E.C. 3.2.1.1., ≥250 U/g), protease (EC No. 232-752-2, ≥500 U/g), and protease inhibitor cocktail for general use (No. P 2714, 1 ml for 1 mg of USP pancreatin) were purchased from Sigma-Aldrich (St. Louis, MO, USA). Due to its broad specificity, the protease inhibitors cocktail was used for the inhibition of serine, cysteine, and metalloproteases.
Methods
As mentioned earlier, vital gluten contains 11% starch, which was removed at the first step of the method development. The removal of starch was done in two different methods for comparison. The first was by using α-amylase and the other by heating a vital gluten slurry at 95°C for 10 min. In both situations, the contaminating starch was removed, either by the release of 2 to 3 glucose units via α-amylase direct-hydrolysis of starch granules, or by the release of amylose and amylopectin fractions after starch gelatinization. In both cases, a slurry containing hydrolyzed starch and gluten will be centrifuged and the released starch-fractions were removed. As was expected, the starch gelatinization method caused gluten aggregation due to the high temperature, which caused variation on the protease treatment step. This issue will be discussed in the gel electrophoresis section. The purified gluten was treated with protease in order to reduce its molecular weight to facilitate excise faster relaxation.
α-Amylase Treatment
At first, a trial run was done to determine the amount of α-amylase units to be used, where different amounts of α-amylase units were used for the same reaction time/temperature. Vital wheat gluten (5 g) was dispersed in 600 ml of deionized water. The slurry was homogenized with a Polytron mixer (PT10-35 PTA 20TS, Kinematica AG, Switzerland); the pH was adjusted to 5.0; the slurry was heated to 50°C for 3 h; and 40, 80, 90, and 100 α-amylase units were added. At the end of the trial, the slurry was centrifuged (2000× g for 15 min) and both precipitate and supernatant were freeze-dried and the protein content of the precipitate (gluten) was determined using a Leco FP 528 (Leco Corporation, St. Joseph, MI, USA). Among the number of units tried, the 80 α-amylase units were found to be the least number of units needed to give the highest protein content (91% w/w dry basis) under the above specified conditions (time/temperature), which means that the starch was removed. Therefore, 80 units/g gluten, or 0.32 g α-amylase/g gluten (5 g gluten) and the slurry were stirred for 3 h at 50°C. The sample was then centrifuged at 2000× g for 15 min, and the supernatant was saved. The process was repeated on the precipitate and both supernatants were combined, where both (supernatant and precipitate) were freeze-dried. A portion of the supernatant was dialyzed.
The use of α-amylase caused protein degradation due to the contaminating protease found in the α-amylase preparation as it came from the manufacturer. This statement will be explained in detail in the Results and Discussion section. For that reason, the protease inhibitor, 10 ml inhibitor cocktail, was added at the α-amylase digestion step. An additional vital gluten sample was heat-purified, where vital gluten slurry (5 g in 600 ml water) was heated up to 95°C and held for 10 min and centrifuged. This process caused starch gelatinization that was removed by centrifugation. The precipitate (gluten) was washed three times with distilled water and each time the supernatant was decanted and the precipitate was freeze-dried.
Protease Treatment
Purified (via α-amylase or gelatinizing starch) vital wheat gluten (5 g) was dispersed in 40 ml of 100 mM sodium phosphate buffer, pH 6.8. The dispersion was stirred for 30 min at 37°C, where the appropriate level of protease was added: 0 g (control), 0.006, 0.012, 0.024, and 0.032 g protease/g gluten), and the sample was stirred for 5 h at 37°C. The reaction was quenched after 5 h by adjusting the pH to 4.0 using concentrated phosphoric acid. The sample was then centrifuged at 6000 × g for 15 min, where the supernatant and precipitate were then freeze-dried and stored for further analysis.
Size-Exclusion and Reversed-Phase HPLC
Samples (10 mg protease-treated gluten) were dispersed in 1 ml of 0.1 M phosphate buffer (pH 6.9) with 0.5% SDS. Each sample was then extracted for 1 h at 40°C, then centrifuged at 3000 × g for 15 min and filtered through a 0.45-μm syringe filter. For both size-exclusion high performance liquid chromatography (SE-HPLC) and reversed-phase high performance liquid chromatography (RP-HPLC), the instrument used was an HP Series 1100 system (Agilent Technologies, Santa Clara, CA, USA). Filtrate (50 μl) was injected for each run, and the detector was set at 214 nm. SE-HPLC was conducted using a BioSep SEC-S4000 column (Phenomenex, Torrance, CA, USA).The sample was run using isocratic 50/50 acetonitrile/water containing 0.1% TFA at a flow rate of 0.5 ml/min for 60 min. The RP-HPLC was performed using a Jupiter 300A 5um C18 column (Phenomenex). Each sample was run at a flow rate of 0.5 ml/min using a gradient of acetonitrile (Solvent A) and water (Solvent B) with 0.1% TFA as follows: 2%A/98%B to 70%A/30%B in 35 min, isocratic 70%A/30%B in 15 min, to 2%A/98%B in 15 min (60 min total).
Differential Scanning Calorimetry
DSC measurements were carried out using a Q2000 MDSC™ (TA Instruments, New Castle, DE, USA). Freeze-dried supernatant or precipitate (∼50 mg total mass) was loaded and sealed in a stainless steel high-volume pan at 5% moisture content and cooled in the DSC to 10°C, equilibrated for 1.0 min. The samples were then heated in the DSC from 10 to 100°C at 10°C/min after which samples were quench cooled while in the pan by immersion in liquid nitrogen and stored at two different temperatures, 25 or 40°C (i.e., two pans were made for each sample to allow for storage at two temperatures). Samples were aged (stored) for 2, 4, and 8 weeks to permit molecular relaxation and re-heated again for enthalpic relaxation detection. All runs were done in duplicate.
Gel Electrophoresis (SDS-Page)
This analysis was done to show the effect of heat treatment during gluten purification and removal of starch at 95°C for 10 min. The effect was expected to be formation of aggregates via means other than disulfide bond that may interfere in protease treatment step. The sodium dodecyl sulfate poly-acrylamide gel electrophoresis (SDS-PAGE) method used was carried out according to Khan et al.[Citation13] using 11.8% acrylamide and 0.1% bis-acrylamide for the separating gel. The stacking gel was prepared using 4.5% acrylamide and 0.1% bis-acrylamide. SDS-PAGE was used to examine possible aggregate formation and to obtain molecular weight estimation. Samples were analyzed as native or reduced with dithiothritol (DTT) to test if proteins formed aggregates involving disulfide bonds.
Capillary Zone Electrophoresis (CZE)
The separation was performed using a P/ACE MDQ system of Beckman-Coulter (San Ramon, CA, USA). Samples (10 mg) were dissolved in 1 ml 50% n-propanol containing 1% DTT. The solutions were sonicated for 45 min at room temperature. Samples and neutral marker (mesityl oxide) were injected for 5 s using a 15 KV applied voltage on 27 cm (20 cm to the detector, 50 μ m i.d.) using uncoated fused-silica capillaries (Polymicro Technologies, Phoenix, AZ, USA) at 25°C, and 200 nm UV absorbance. The running buffer was freshly prepared and consisted of 100 mM phosphate (pH 2.4) containing 20% (v/v) acetonitrile, 0.4% (w/v) glycine, and 0.05% (w/v) hydroxylpropyl methyl cellulose. The buffer was filtered through a 0.45-μm nylon membrane filter purchased from SUN SRI Company (SUN SRI, TN, USA) before use.
Dynamic Mechanical Analysis (DMA)
Powder samples (5% moisture content) of protease-treated gluten were placed in 25.4 × 50.8 × 3 mm stainless steel windows and compression molded in a Carver press (Carver Inc., Wabash, IN, USA) at 89 kN (20,000 lbs force) for 3 h at 30°C. The samples were removed and placed in torsion rectangular geometry of the TA ARES LS2 strain-controlled rheometer (TA Instruments, New Castle, DE, USA). Each sample had different dimensions, which were recorded before testing. The samples were clamped in the fixture using a torque wrench set at 20 cN m. The temperature was controlled by an air convection oven. Temperature ramp measurements were made over a range of –30 to 90°C or 120°C with a small shear strain of 0.05%, where temperature was increased at a rate of 1°C/min. Small-amplitude oscillatory shear experiments were conducted at a frequency (ω) of 1.0 rad/s, yielding the shear storage moduli (G′) and loss moduli (G″). The phase shift or phase angle (δ) is defined bytan−1δ = (G″/G′), and indicates whether a material is solid with perfect elasticity (δ = 0), or liquid with pure viscosity (δ = 90°), or somewhere in between. The glass transition temperatures (Tg) of the samples were obtained from the transition point of the loss factor (tan δ).
RESULTS AND DISCUSSION
It is common knowledge that polymers relax after aging for some time depending on the polymers structure and molecular weight. It has been also confirmed by a number of workers that wheat gluten is an amorphous polymer without globular structure; thus, it gives no denaturation transition.[Citation14] Although it is also common knowledge that wheat gluten is a glassy polymer that exhibits relaxation, it is not specifically known how long it takes gluten to relax and how to accelerate its relaxation. Since polymer aging is a significant process at the technological and analytical levels, it is appropriate to focus on the determination of gluten enthalpic relaxation as a measure of aging. Aged polymers, including biopolymers, have a tendency to change in terms of physical properties and become more brittle, less permeable (less porous), and dense. These characteristics are desirable in the food industry, where crispiness can be critical for some products, such as fried and baked goods. Commercially available vital gluten is mostly contaminated with starch, which justifies the purification step by α-amylase or via heating a gluten slurry, as the first step of sample preparation.
A number of researchers[Citation5,Citation8] have established that gluten molecules can relax (enthalpic relaxation) under specific conditions. Given that starch gelatinization transition may take place near gluten enthalpic relaxation transition, previous workers[Citation5] have used acetic acid gluten-extract (not vital gluten) to avoid the contaminating starch found in vital gluten. This concern has been expressed by others[Citation15] as well. In view of the fact that wheat gluten is not fully soluble in acetic acid, the extraction technique used by the previous workers[Citation5] have only partially extracted the gluten, which limits the outcome of their work to the extracted protein fractions only. For this reason; in this article the authors used the entire vital gluten after removal of contaminating starch, thus general comments can be made regarding the whole gluten. It is imperative to mention here that the previous workers[Citation5] used Scout 66 in their work, a winter wheat variety with a unique protein profile (MW, mixing properties, and glutenin to gliadin ratio) that does not entirely represent wheat gluten.[Citation16] This justifies the main point of this work, which is to show how commercially available vital gluten that represents wheat gluten in terms of mixing properties and molecular composition, can relax. Wheat glutenins is one of the two main fractions of wheat gluten (gliadins and glutenins) with MW in the millions, while gliadins are less than one hundred thousand MW and have a unique amino acid composition and sequence. These reasons necessitate the use of protease so as to reduce the MW to a level where molecules can be mobile enough and relax in a reasonable time.
In general, enthalpic relaxation for most polymers can be accelerated by storing the sample at approximately 10°C lower than its glass transition. Initially, we tested vital gluten as is (un-purified) samples heated past the glass transition and quench-cooled in liquid nitrogen and stored (aged) for 2 weeks at room temperature (25°C) and re-heated from 25 to 110°C (). The aged sample showed a Tg at 55.32°C (ΔCp = 0.29 J/g/°C) and enthalpic relaxation with ΔH = 0.13 (J/g). Another vital gluten sample was melted past the Tg temperature and quench-cooled and stored at 40°C for 2 weeks and re-heated from 40 to 110°C. This sample displayed a Tg at 50.14°C (ΔCp = 0.31 J/g/°C) and enthalpic relaxation with ΔH = 1.72 (J/g). This data showed that when samples were stored closer to Tg (40° versus 25°) they tend to show higher enthalpic relaxation values. These results are in agreement with the earlier findings;[Citation5] bear in mind, we used commercial vital gluten with 8% moisture content and they used acetic acid gluten-extract.
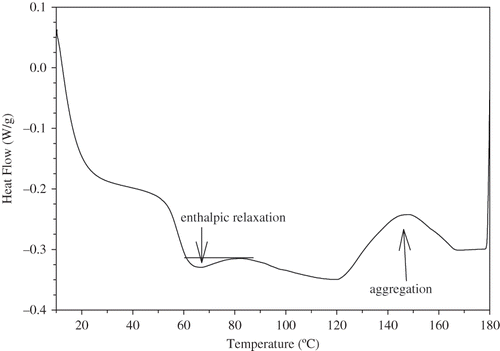
Figure 1 DSC profile of un-treated gluten (36 mg) after 2 weeks of storage at room temperature, where sample was re-heated from 25 to 110°C.
Following the vital gluten as is, a heat-purified vital gluten sample was analyzed dis-similarly after having being stored at 25°C for 2 weeks. This sample exhibited Tg at 48.62°C (ΔCp = 0.29 J/g/°C) and enthalpic relaxation with ΔH = 1.02 (J/g). Another heat-purified sample, stored at 40°C for 2 weeks, showed Tg at 49.63°C (ΔCp = 0.28 J/g/°C) and relaxation with ΔH = 0.98 (J/g). It is apparent that heat purification caused structural changes in the gluten and limited relaxation. There was no indication of aggregation on the SDS-PAGE profile due to heat treatment. Obviously, heat-purification of gluten was not a practical approach because it was not responsive enough to the aging conditions and showed no significant difference compared to untreated vital gluten. In addition, heat treatment is complex and time consuming.
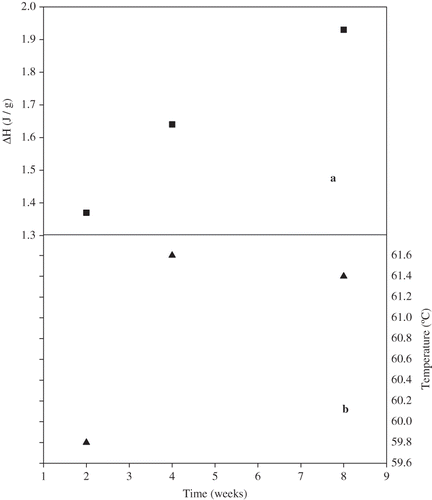
The third approach for maximizing the relaxation of vital gluten was to enzymatically remove contaminating starch via α-amylase. After the α-amylase treatment step and without storage, the precipitate and the supernatant were scanned in the DSC at 5% moisture content. The un-dialyzed supernatant collected from the α-amylase treated slurry exhibited enthalpic relaxation, while little or no relaxation was noticed for the precipitate. Initially, we suspected that the enthalpic relaxation signal of the supernatant was due to the sugars released from starch degradation. To exclude the possibility of sugar relaxation, we treated wheat starch with α-amylase under the same conditions used for gluten purification. The generated dextrins did not exhibit relaxation under these conditions. This step eliminated the possibility of sugar relaxation after α-amylase treatment and steered the investigation toward gluten relaxation. After aging at room temperature, the undialyzed supernatant exhibited an increase in enthalpic relaxation with time. The linear increase in ΔH of the enthalpic relaxation with time is represented in , which is in agreement with reports in the literature by previous workers.[Citation5] Given that sugars were not the cause of relaxation and α-amylase does not degrade proteins, we suspected a change in the gluten structure. So, the origin of this relaxation was the question. Two approaches were taken to find an answer. (1) We ran SDS-PAGE of the α-amylase treated gluten and found that gluten MW was being reduced, indicating some form of protease activity. (2) We tested the purity of the α-amylase enzyme by SE-HPLC and discovered the presence of a second peak with a smaller molecular size than the main peak and that gave us some assurance that the gluten degradation was caused by protease contaminants in the α-amylase preparation as it was received from Sigma. Therefore, protease-inhibitor was added simultaneously with α-amylase so that to verify the identity of the second peak shown in the SE-HPLC profile. In the presence of the inhibitor, no relaxation was present, confirming the presence of protease contaminant.
Figure 2 The ΔH (a) and peak temperature (b) of the enthalpic relaxation of un-dialyzed α-amylase-treated gluten as a function of time.
Now we know that the relaxation of the supernatant was caused by protease activity, the α-amylase-purified gluten sample was treated with pure protease (not protease contaminant) in order to facilitate for overall relaxation. The outcome of the first protease treatment was peptide segments with relatively small MW, as exhibited by the SDS-PAGE (profile not shown), indicating that we have added too much enzyme. This resulted in no enthalpic relaxation of either the supernatant or the precipitate. To determine the appropriate amount of protease to use, we considered the quantity of protease-contaminants in the α-amylase preparation as received from Sigma, which was determined by the SE-HPLC. The needed protease quantity was calculated based on the size of the SE-HPLC peak (the relative area under the curve) taking into consideration the initial α-amylase protein concentration. This calculation revealed a 15% protease contaminants (i.e., during α-amylase treatment, we were adding 0.32 g α-amylase/g gluten, but at the same time we were delivering 0.048 g protease/g gluten). Using this new protease level we treated gluten with 0.048 g protease/g gluten, as well as two additional levels (i.e., 0.024 and 0.096), which is half and double the calculated level. The new protease level was sufficient for generating modified gluten capable of molecular-relaxation under the experimental aging-conditions (time and storage temperature). After 2 weeks aging at room temperature, we found similar enthalpic relaxation for the 0.048 g protease as compared to the α-amylase treated gluten. This is a clear proof of the contamination assumed earlier, while developing the experimental approach. We have also treated gluten with 0.064 g protease and found no significant difference between these levels and 0.024.
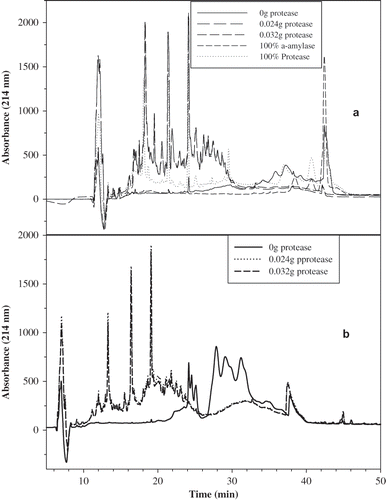
Based on the above mentioned results, gluten was treated with protease at the following levels: 0.000, 0.006, 0.012, 0.024, and 0.032 g protease/g gluten and freeze-dried. Supernatant and precipitate were tested separately by DSC without dialysis and after being aged for 2 weeks at room temperature. The SE-HPLC profile of the protease-treated gluten () clearly showed the difference in molecular size between the supernatant and the precipitate. The supernatant peaks () eluted after 17 min with a major peak around 23 min, while the precipitate () showed a significant peak around 11 min and a major peak at 18 min. The data signified the molecular difference between the supernatant and the precipitate, which can be used as one of the means to understand the molecular relaxation of the supernatant versus the precipitate. By observing the effect of the amount of the added protease (0.024 versus 0.032) on the molecular size of gluten, a little difference between the two profiles ( and ) was noticed, but this slight discrepancy appeared to have a significant impact on the enthalpic relaxation data. The RP-HPLC profiles of protease-treated gluten (supernatant and precipitate) signify more hydrophilic gluten molecules than the control. The supernatant profile () appeared to be more hydrophilic than the precipitate, where the untreated gluten was more hydrophobic, given that untreated gluten eluted at a later time (). Once again, there was little difference in hydrophobicity between the 0.024 and 0.032 g protease/g gluten.
Figure 3 Size exclusion HPLC of protease-treated gluten: (a) precipitate and (b) supernatant.
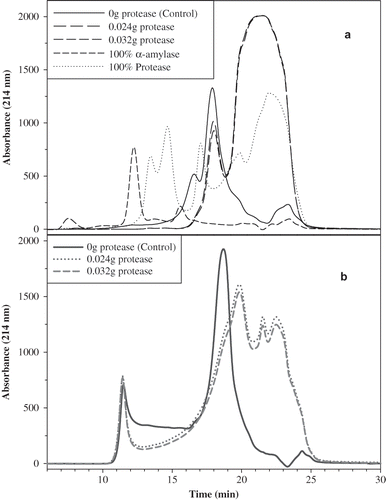
Figure 4 Reverse phase HPLC of protease treated gluten: (a) supernatant and (b) precipitate.
Control and protease-treated gluten samples were separated according to their mass to charge ratio using CZE. Optimum separation of cereal proteins is obtained with acidic pH electrolyte buffer.[Citation17] Electrophoregrams of the supernatant gluten-control extract showed about 15 peaks with the majority migrating from 7 to about 15 min (). The neutral marker mesityl oxide migrated at 4.7 min. Only one major peak and two minor peaks migrated earlier than the neutral marker (average migration 0.65 min) suggesting that the majority of the peaks were negatively charged, since they migrated after the neutral marker. Starting at about 18.5 min to about 29.5 min, an undistinguishable peak, a rather broad hump-like tracing, was observed. This represented small amounts of proteins that were not separated in distinct peaks under the experimental conditions used.
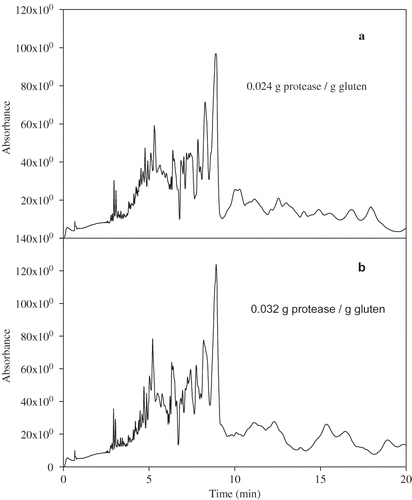
As the protease concentration increased, a larger number of peaks were separated from the gluten sample. With the lowest protease concentration (0.006 g protease/g gluten), two more peaks migrate before 4 min, reflecting the most positively charged and/or smaller mass proteins. The region representing the majority of the protein peaks (21 peaks migrating from 4 to 10 min) appear to be better separated and comprised about 83.5% of the total peak area ( and ). After 10 min, proteins migrating in the form of broad peaks were separated. From protease level 0.012 to 0.032 g protease/g gluten, the electrophoregrams were composed of a large number of peaks migrating up to about 10 min followed by areas of broad peaks. The electrophoregram of 0.024 () and 0.032 g protease/g gluten () were similar, which suggests digestion completion at the level of 0.024 g of protease/g gluten. The peaks migrating before 10 min comprised about 69.5% of the total area.
Figure 5 Capillary zone electrophoresis of protease-treated gluten supernatant: (a) 0.024 g protease/g gluten and (b) 0.032 g protease/g gluten.
The precipitate of the untreated gluten exhibited only six protein peaks, the majority migrating from about 9 to 18 min (CZE data not shown). In agreement with the supernatant, all the peaks of the precipitate migrated later than the neutral marker suggesting that they are negatively charged. Peaks migrating between 9 and 15 min formed a big hump with broad peaks. Four peaks exhibited high absorbance suggesting that these proteins are in high concentration (CZE data not shown). Overall, a larger number of peaks were separated following protease treatment of the precipitate as compared to the supernatant, indicating diverse compositions, which were easily separable. Protease treatments at 0.006 and 0.012 g protease/g precipitate resulted in a wide range of mass to charge ratio. In comparison, as the protease levels increased to 0.024 and 0.032 g protease/g gluten, the majority of the proteins migrate earlier compared to the .006 and 0.012 g protease/g gluten. This suggests that the proteins in the precipitate continue to change into species with faster electrophoretic mobility most likely due to smaller stokes radii after proteolysis. Once more, the CZE data confirmed the insignificant difference between 0.024 and 0.032 g protease/g gluten.
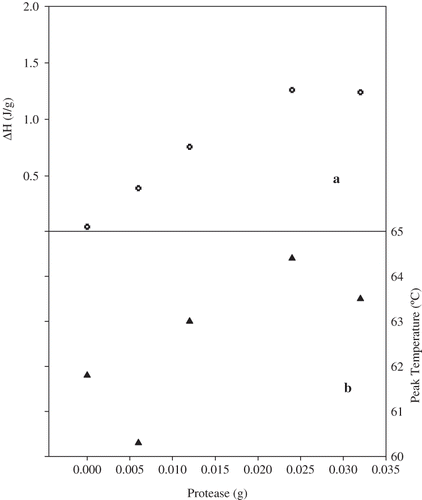
It is worth mentioning that gluten protein exhibits glass transition only, independent of isolation method. Unlike other plant-based proteins, such as groundnuts, where proteins isolated using micellization techniques can show denaturation transition.[Citation18] Since the precipitate of the protease-treated gluten did not show enthalpic relaxation, the DSC analysis of the supernatant will be discussed in the remaining part of this article. The DSC profile of gluten treated with different levels of protease revealed a Tg and the enthalpic relaxation beneath it. The Tg part of the profile was integrated separate from the relaxation as shown in . and include Tg temperature and ΔCp as a function of protease level. Higher protease level increased the Tg temperature and ΔCp of the supernatant ( and ). From the slope of the lines, temperature increased at a higher rate during the melting scan compared to the after storage scan (). The ΔCp showed a comparable trend to the temperature, but with less difference between the slopes (). Bio-polymers Tg-temperature and ΔCp can increase as a function of lower moisture content. Since the moisture content of these samples did not change during storage because they were stored in sealed DSC pans, the increase in the Tg temperature and ΔCp was due to relaxation. The ΔH of enthalpic relaxation increased with protease content, but there was little difference between 0.024 and 0.032 (). Once again, 0.024 and 0.032 protease levels similarly impacted the protein as indicated by SE-HPLC and RP-HPLC. The peak temperature of relaxation continued the same trend (). The overall impact of protease level on the relaxation temperature was not big, but the ΔH was affected more. The higher enthalpic relaxation ΔH signifies change in the physical characteristics of the treated gluten, such as a more dense and brittle material. This information can be crucial in recommending this product for specific application. Possible application could be food products where brittleness is desirable, for instance, in breading for baked fish, where crunchiness is thought. Therefore, gluten molecular relaxation (equilibrium) can be achieved by using vital gluten or purified (heat or enzymatic) and not necessarily a specific wheat variety or extracts.
Figure 6 Effect of protease level on glass transition of supernatant before or after storage: (a) temperature and (b) ΔCp (J/g/°C).
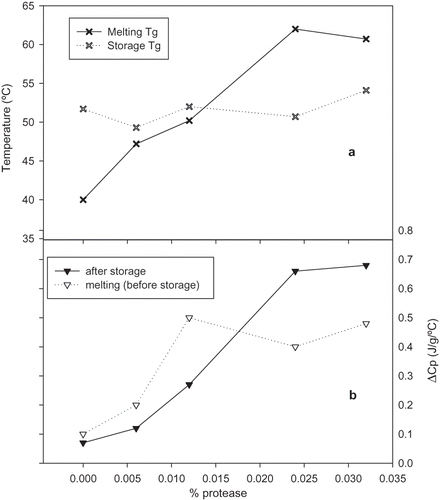
Figure 7 Effect of protease level on enthalpic relaxation of supernatant after 2 weeks of storage: (a) ΔH (J/g) and (b) peak temperature.
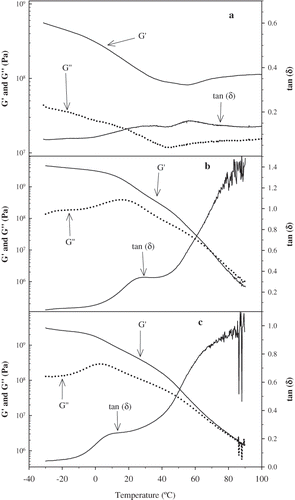
Reports in the literature showed that trypsin-like enzyme can modify the physic-chemical properties of gluten, such as zeta value and gluten index.[Citation19] – show the dynamic mechanical spectra (dynamic storage moduli G′, loss moduli G″, and loss factor tan(δ)) for vital wheat gluten and protease-treated glutens as a function of temperature. The Tg temperature for wheat gluten (control) (), treated with 0.024 g protease/g gluten (), and 0.032g protease/g gluten () was 69.7, 21.2, and 12.3°C, respectively. Although the Tg temperature obtained from DSC of the protease-treated gluten has increased as a function of protease level between 0.006 and 0.024 () and decreased between 0.024 and 0.032 levels, the rheological data of the control () is in agreement with the overall DSC data. As indicated, the glass transition temperatures for protease-treated gluten were significantly lower than the control (vital gluten). This was expected because the lower molecular weight of protease-treated gluten relative to vital gluten, which permits easier molecular mobility thus lowers Tg temperature. Keep in mind that these samples were compression molded before rheological testing. The DSC testing of the compression molded samples verified the DMA findings. The small difference in protease concentration (0.024 g versus 0.032 g) instigated an obvious difference in Tg temperatures. Wheat gluten displayed strong viscoelastic solid behavior within a wide range of temperatures (). At -20°C, which was much lower than its glass transition temperature, vital wheat gluten's storage modulus G′ and loss modulus G″ were 4.8 × 10⁸ Pa and 3.8 × 10⁷ Pa, respectively; and its phase shift δ was 4.5°. At room temperature of 25°C, which is still lower than its Tg, gluten's G′ and G″ were 1.8 × 10⁸ Pa and 2.1 × 10⁷ Pa, respectively, where its phase shift was 6.8°. Gluten's strong viscoelastic solid behavior decreased slightly with higher temperature. Even at the temperature above Tg, gluten still showed strong viscoelastic solid properties. For instance, at 80°C gluten's G′ and G″ were 9.2 × 10⁷ Pa and 1.4 × 10⁷ Pa, respectively, whereas its phase shift was 8.6°. At lower than Tg temperature, the viscoelastic behaviors for both protease-treated gluten samples exhibited strong viscoelastic solid properties ( and ), while the G′ and G″ for both samples decreased slightly with higher temperature, but still lower than Tg. At -20°C, the elastic or storage modulus G′ and loss modulus G″ were 4.1 × 10⁹ Pa and 1.8 × 10⁸ Pa, respectively for sample 0.024 g protease/g gluten and the phase shift (δ) was 205°. For sample 0.032 g protease/g gluten (at -20°C) the G′ and G″ were 2.6 × 10⁹ Pa and 1.3 × 10⁸ Pa, respectively, and its phase shift δ was 2.9o. Therefore, protease-treated gluten exhibited more solid like behavior than vital gluten (control) when the temperature was lower than Tg temperature, possibly due to the lower molecular weight effect during compression molding. The greater values of G′ and lower values of phase shifts for protease-treated glutens indicated that, these materials were more brittle than vital gluten at temperatures lower than their Tg. However, at temperatures above Tg, G′ and G″ for both protease treated materials decreased sharply with temperature increase ( and ). At 80°C, which is higher than their Tg, for sample 0.024, G′ and G″ were 2.2 × 10⁶ Pa and 2.6 × 10⁶ Pa, respectively, and the phase shift δ was 49.8°. The 0.032 g protease, G′ and G″ were 2.1 × 10⁶ Pa and 2.5 × 10⁶ Pa, respectively, and its phase shift δ was 50.0°. Therefore, protease treated glutens behaved more like fluids at temperature above Tg evidenced by G″ greater than G′ and a large phase shift value. This behavior is due to the lower molecular weight of the protease treated materials compared to untreated vital gluten. The interactions between molecules of protease-treated gluten were much weaker than vital gluten as demonstrated by much weaker network and sensitivity to temperatures, especially above their Tg. As it was shown earlier by the HPLC and CZE analysis, a small amount of protease made significant differences on the molecular mobility and surface properties of the materials. The effect of different levels of protease was also noticed during the rheological testing, which showed slightly weaker viscoelastic properties of 0.032 g protease/g gluten sample compared to 0.024. The weaker behavior was due to lower molecular weight. This result coincided with the difference in glass transition temperatures between these two materials.
Figure 8 (a) Temperature dependence of the storage modulus, loss modulus, and loss factor for the vital wheat gluten (control). (b) Temperature dependence of the storage modulus, loss modulus, and loss factor for the protease treated gluten sample 0.024 g protease/g gluten. (c) Temperature dependence of the storage modulus, loss modulus, and loss factor for the protease treated gluten sample 0.032 g protease/g gluten.
CONCLUSION
Unpurified, untreated vital gluten can go through molecular relaxation under specific aging conditions. Gluten can be purified and enzymatically-modified in a one step process. Protease-treated and aged commercially-available vital gluten exhibited glass transition and enthalpic relaxation. Higher enthalpic relaxation was achieved by storing samples at 10°C below glass transition in addition to increasing protease level. The SE-HPLC, RP-HPLC, CZE, and SDS-PAGE showed little molecular weight and surface property differences between 0.024 and 0.032 g protease/g gluten treatments, signifying the end of protease activity. Rheological properties of compression-molded protease-treated samples showed significant differences in viscoelastic properties compared to vital gluten, where enzyme activity resulted in a fluid-like rather than a solid-like material. Finally, there is no need to extract a specific gluten fraction so as to achieve molecular relaxation; vital gluten can relax as is. This is significant because it eliminates the extraction step, which is time consuming, expensive, and it allows the use of any commercially available vital gluten.
ACKNOWLEDGMENT
The authors extend their appreciation to the Deanship of Scientific Research at King Saud University for funding the work through the research group project No. RGP-VPP-114)) i.
REFERENCES
- Struik , L.C.E. 1978 . Physical Aging in Amorphous Polymers and Other Materials , 3 – 17 . New York : Elsevier .
- Kim , Y.J. , Hagiwara , T. , Kawai , K. , Suzuki , T. and Takai , R. 2003 . Kinetic process of enthalpy relaxation of glassy starch and effect of physical aging upon its water permeability property . Carbohydrates Polymers , 53 : 289 – 296 .
- Badii , F. , MacNaughtan , W. and Farhat , I.A. 2005 . Enthalpy relaxation of gelatin in the glassy state . Biological Macromolecules , 36 : 263 – 269 .
- Cowie , J.M.G. , Harris , S. and McEwen , I.J. 1998 . Physical aging in poly(vinyl acetate) . 2. Relative rates of volume and enthalpy relaxation. Macromolecules , 31 : 2611 – 2615 .
- Lawton , J.W. and Wu , V. 1993 . Thermal behavior of annealed acetic acid soluble wheat gluten . Cereal Chemistry , 70 ( 4 ) : 471 – 475 .
- Levine , H. and Slade , L. 1987 . Water Science Reviews , Edited by: Franks , F. Vol. 3 , 79 Cambridge , , UK : CambridgeUniversity Press .
- Slade , L. and Levine , H. 1988 . Non-equilibrium melting of native granular starch: Part I . Temperature location of the glass transition associated with gelatinization of A-type cereal starches. Carbohydrates Polymers , 8 : 183
- Cocero , A.M. and Kokini , J.L. 1991 . The study of the glass transition of glutenin using small amplitude oscillatory rheological measurements and differential scanning calorimetry . Journal of Rheology , 35 : 257
- Struik , L. 1980 . Physical aging of dry elastin . Biopolymers , 19 : 1667 – 1673 .
- Petrie , S.E.B. 1972 . Thermal behavior of annealed organic glasses . Journal of Polymer Science , 10 : 1255
- Kalichevsky , M.T. , Blanshard , J.M.V. and Tokarczuk , P.E. 1993 . Effect of water content and sugars on the glass transition of casein and sodium caseinate . International Journal of Food Science and Technology , 28 : 139 – 151 .
- Ferrari , C. and Johari , G.P. 1997 . Thermodynamic behavior of gliadins mixture and the glass softening transition of its dried state . International Journal of Biological Macromolecules , 22 : 231 – 241 .
- Khan , K. , Tammiga , G. and Lukow , O. 1989 . The effect of wheat flour on mixing and baking—Correlations with protein fractions and high molecular weight glutenin subunit composition by gel electrophoresis . Cereal Chemistry , 66 : 391
- Eliasson , A.C. and Hegg , P.O. 1980 . Thermal stability of wheat gluten . Cereal Chemistry , 57 : 436 – 437 .
- Shogren , R.L. , Swanson , C.L. and Thompson , A.R. 1992 . Extrudates of cornstarch with urea and glycols: Structure/mechanical property relations . Starch/Staerke , 44 : 335 – 338 .
- Garrin , J.F. , Cole , E.W. and Kasarda , D.D. 1980 . Quantitative SDS–PAGE of total protein from different wheat varieties . Journal of Science Food Agriculture , 31 : 43 – 53 .
- Lookhart , G. and Bean , S. 1995 . Separation and characterization of wheat protein fractions by high-performance capillary electrophoresis . Cereal Chemistry , 72 ( 6 ) : 527 – 532 .
- Cabrera-Chávez , F. , Ezquerra-Brauer , J.M. , Herrera-Urbina , R. , Rosell , C.M. and Rouzaud-Sández , O. 2010 . Physicochemical properties of wheat gluten proteins modified by protease from (Sierra Scomberomorus sierra) fish . International Journal of Food Properties , 13 ( 6 ) : 1187 – 1198 .
- Adebowalea , Y.A. , Schwarzenbolzb , U. and Henleb , T. 2011 . Protein isolates from bambara groundnut (Voandzeia Subterranean L.): Chemical characterization and functional properties . International Journal of Food Properties , 14 ( 4 ) : 758 – 775 .