
Abstract
The state diagram of spray dried bovine colostrum powder was constructed by determining its freezing curve (initial freezing point versus solids content), the glass line (glass transition temperature versus solids content), maximal-freeze-concentration conditions [end point of freezing (), and glass transition temperature of maximally-freeze-concentrated solution (
)] by using differential scanning calorimetry. The freezing curve and the glass line were modeled using the Chen equation by incorporating concept of unfrozen water and Gordon-Taylor equation, respectively. The conditions of the maximal-freeze-concentration obtained were −32.14°C (
) and −50.52°C (
), respectively, and the corresponding solids contents were 0.807 and 0.839 kg dry solids/kg samples, respectively. The state diagram of spray dried bovine colostrum powder obtained can be useful for predicting its stability during storage as a function of temperature and moisture content.
INTRODUCTION
Bovine colostrum is the initial milk secreted by a cow during the first 4 days postparturition.[Citation1] Colostrum-based products are commercially available as a health food supplement in Australia, New Zealand, USA, Europe, and China,[Citation2] because bovine colostrum contains abundant bioactive components, including growth factors, immunoglobulins (Igs), lactoperoxidase, lysozyme, lactoferrin, cytokines, nucleosides, vitamins, peptides, and oligosaccharides, which are of increasing relevance to human health.[Citation3] In addition, colostrum-based products are marketed as a general “health promoting” product, particularly suitable for athletes.[Citation4] Drying is a traditional method for preservation of foods, which can reduce transportation and storage costs and extend the shelf life. Spray drying and freeze drying are commonly employed methods for dehydrating liquid bovine colostrum into powder.[Citation5] During the processing of bovine colostrum and storage of bovine colostrum powder, choosing optimum processing parameters and storage conditions is of great importance to the dairy industry.
A state diagram of food presents different physical states of food as a function of solids content and temperature and a simplified state diagram of food consists of a freezing curve of initial freezing point versus solids content, a glass line of glass transition temperature (Tg) versus solids content, and conditions of maximal-freeze-concentration,[Citation6] which is a helpful tool for determining its processing and storage stability. In the last decades, the state diagrams of food materials, including pure components and real foods, have been extensively studied.[Citation7−Citation12] In the literature, it has been reported that foods can be considered very stable at the glassy state, since below glass temperature compounds involved in deterioration reactions take many months or even years to diffuse over molecular distances and approach each other to react.[Citation13] Formation of a glassy state results in a significant arrest of translational molecular motion, and chemical reactions become very slow.[Citation14] The glassy state concept and water activity concept have been widely tested in food as evident from the literature and a detailed review about the relationships between glass temperature and water activity and stability of food materials have been given by Rahman.[Citation15−Citation17] The glass line (glass transition temperature versus total solids content) and maximal-freeze-concentration conditions of skim milk and whole milk with different fat contents have been reported in the literature.[Citation18] In addition, the glass transition lines of whole milk powder and skim milk powder and a universal relationship between the glass transition temperature and water activity have been reviewed and the glass line has been found to be a new tool for optimizing the drying process of milk powders.[Citation19] However, the comprehensive data about the state diagram of bovine colostrum, including the freezing curve, the glass line, and maximal-freeze-concentration conditions, have not been reported in the literature.
The objectives of this study were to construct a state diagram of spray dried bovine colostrum powder by determining the glass line (glass transition temperature (Tg) versus total solids content), the freezing curve (freezing point versus total solids content), and maximal-freeze-concentration conditions (end point of freezing for maximal-freeze-concentration condition , glass transition temperature of maximal-freeze-concentration solution
) and to predict the optimum storage conditions of spray dried bovine colostrum (SDBC) powder according to the estibilished state diagram of bovine colostrum.
MATERIALS AND METHOD
Materials and Samples Handling
Fresh bovine colostrums used in this experiment were provided by a dairy farm of Bright Dairy and Food Co., Ltd, Shanghai, China, tranferred to our lab, and then stored at −20°C for 2 to 4 weeks prior to use in this study. Frozen bovine colostrum was thawed at room temperature, filtrated to remove non-milk ingredients by medical gauzes, and defatted by a SE 02.0V centrifugal separator (SEITAL S.r.l., Santorso (VI), Italy). The samples used in this experiment were employed with a constant total solids mass concentration of 9.59 ± 0.01, containing fat of 0.74 ± 0.02, protein of 4.93 ± 0.01, lactose of 2.96 ± 0.01, and ash of 0.956 ± 0.002 g/100 g samples, respectively. Bovine colostrum powders were obtained by spray drying fresh bovine colostrums in a mini–scale spray dryer (Shandong Tianli Drying Equipment Inc., Jinan, Shandong Province, China) and the spray-drying conditions were the atomizer pressure of 0.7 ± 0.01 MPa, the feed temperature of 32 ± 1°C, the feed rate of 160 ± 20 mL/h, air inlet temperature of 125 ± 1°C, drying air flow rate of 0.78 ± 0.01 m3/min, and compressed air flow rate of 300 ± 10 L/h. SDBC powders collected from the spray dryer were kept immediately in vacuum desiccators over P2O5 at room temperature. Desiccated powders were further dried in a vacuum oven at 30°C for 5–7 days before experiments so as to remove residual moisture.
For the adsorption experiment, three replications of SDBC powder samples (1 ± 0.001) g were placed in previously weighed glass sorption jars, and then quickly placed inside desiccators over eight saturated salt solutions of known relative humidity.[Citation20] The saturated salts used were as follows: KOH, LiCl, CH3COOK, MgCl2, K2CO3, Mg(NO3)2, NaNO2, and NaCl with equilibrium relative humidities of 8.2, 11.3, 22.5, 32.8, 43.2, 52.9, 65.8, and 75.0%. A test tube containing thymol was placed inside the desiccators with high relative humidity to prevent mold growth during storage. The desiccators were placed in a temperature-controlled cabinet, with an accuracy of ± 1°C at the selected temperatures of 25°C. The samples were weighed at intervals of 72 h. Equilibrium was reached when the sample weight difference between two successive measurements was less than the balance accuracy of 0.001 g. This involved a period of 21–24 days. The total time for removal, weighing, and putting back the samples in the desiccators was about 30 s. This minimized the degree of atmospheric moisture sorption during weighing. The equilibrium moisture contents of the samples were determined using AOAC method 927.05.[Citation21]
Determination of Thermal Transition
The thermal transition experiments in all the samples were conducted with a differential scanning calorimeter (DSC) (Diamond DSC, PerkinElmer, Boston, MA, USA) in inert atmosphere (20 mL/min of N2). The DSC was calibrated for temperature and heat flow using n-hexane (melting point, −95.6°C; latent heat of melting, 140.16 J/g), double-distilled water (melting point, 0°C; latent heat of melting, 333.88 J/g), and indium (melting point, 156.6°C; latent heat of melting, 28.45 J/g). An empty sealed aluminium pan was used as a reference in each test. Liquid nitrogen was used for sample cooling before the run.
The samples (10–20 mg) containing unfrozen water, reaching equilibration in different saturated salt solutions mentioned above, were transferred in pre-weighed differential scanning calorimeter aluminium pans (volume 30 μL), hermetically sealed, then cooled from room temperature to −100° at 20°C/min, equilibrated for 10 min and scanned from -100 to 150°C at 10°C/min according to the recommendation by Sablani and his co-authers.[Citation22] The glass transition temperature (Tg) is identified as a (vertical) shift in the heat flow curve of the thermogram. Pyris Diamond DSC analysis software (PerkinElmer, Boston, MA, USA) was used to analyze the onset, mid, and end-points of the glass transition. Three replicates were used for the determination of glass transition temperature at each water content/water activity.
The samples containing freezable water with different moisture contents were scanned from −100 to 20°C at 10°C/min to initially locate the Tg of the maximally freeze-concentrated solutes () and onset temperature of ice melting within the maximally freeze-concentrated solutes (
). Triplicate samples (10–20 mg) of each concentration (0.198–0.660 kg dry solids/kg samples) were cooled to −100°C, equilibrated for 5 min, heated at 10°C/min to −33°C (
- 1°C), annealed for 30 min to allow ice formation, re-cooled to −100°C at 20°C/min, equilibrated for 5 min and then scanned from −100 to 20°C at 10°C/min to determine the freezing point, enthalpy of ice melting,
and
. Three transitions (peak, maximum slope, and start of melting) were determined from the ice melting endotherm. The initial or equilibrium freezing point was considered as the point of maximum slope of the endothermic peak.[Citation6] The end point of freezing (
) is taken as the initial point of ice melting at endothermic peak.[Citation7,Citation17] All the results were given as an average for three samples.
Modeling of Water Adsorption Isotherm and Thermal Transition
Many theoretical, empirical and semi-empirical equations are available for modeling of sorption isotherm data.[Citation23] In this study, water adsorption data of SDBC powders were modeling using most commonly employed Guggenheim-Andersen-de Boer (GAB) and Brunauer-Emmett-Teller (BET) equations.[Citation11] GAB and BET equations have a sound theoretical background and their parameters provide physical meaning related to the sorption process. The GAB and BET equations are listed as follows:
where M represents the equilibrium moisture content (EMC) (g H2O/100 g dry solids), aw represents water activity (decimal), M0 is monolayer moisture content (g H2O/100 g dry solids), and C, K are coefficients of models. In order to evaluate how accurate each model was in fitting experimental data, the mean relative percentage deviation modulus (MRE) value, the coefficient of determination (R2), root mean square error (RMSE), and the graph of residuals were most commonly applied for the criteria.[Citation23] It is generally considered that MRE values and RMSE below 10%[Citation24,Citation25] and R2 > 0.9 indicate an adequate fit for practical purposes.
The glass transition temperatures of amorphous foods are influenced by water content. The influence of water content on glass transition temperature is commonly modeled by the Gordon and Taylor (G-T) equation:[Citation26]
where Tgm, Tgs, and Tgw are the glass transition temperatures of the mixture, solids, and water, respectively; Xw and Xs are the mass fraction of water (kg H2O/kg samples) and total solids (kg dry solids/kg samples), and k is the G-T model parameter. From the thermodynamic standpoint, the k parameter is equivalent to the ratio of the change in specific heat of the components of the mixture at their Tg. The model parameters (k and Tgs) of Eq. (3) were estimated using nonlinear regression analysis while considering Tgw as −135°C.
The Clausius-Clapeyron equation was used to model the freezing curve of bovine colostrum with change in water content. The Clausius-Clapeyron equation is expressed as:[Citation11]
where δ is the freezing point depression (Tw - ) relative to increasing total solid content,
is the freezing point of the food material (°C), Tw is the freezing point of water (°C), β is the molar freezing point constant of water (1860 kg °C/(kg mol)), λw is the molecular mass of water, Xs is the solid mass fraction (kg dry solids/kg samples), and E is the molecular mass ratio of water to solids (λw/λs). Use of Clausius-Clapeyron equation is limited to ideal and dilute solutions. The Chen model is an extension of Clausius-Clapeyron equation by the introduction of a new parameter B, which is the ratio of unfreezable water of the total solid content. The Chen model is expressed as:[Citation27]
In this study, the Chen model was selected to fit the freezing point data.
RESULTS AND DISCUSSION
Sorption Isotherm of SDBC Powder
The water adsorption isotherm of SDBC powder at 25°C was presented in and showed a sigmoid shape, classified to a typical type II curve. The sigmoid shape of sorption isotherm was commonly found in many food materials containing amorphous solids.[Citation28] Similar results were reported in other dairy products, including powdered milk[Citation29] and yogurt powder.[Citation30] The sorption isotherm data were modeled using BET and GAB equations, and parameters for two models were shown in . It was clearly shown that BET and GAB equations fitted well with experimental data in the water activity range of 0.08–0.43 and 0.08–0.75, respectively, based on MRE and RMSE below 5%, R2 > 0.9, and random distribution of residual plots. Similarly, BET and GAB models were reported to be suitable for describing sorption isotherm of other dairy products.[Citation18,Citation29,Citation30] The monolayer moisture content, M0, obtained from BET model, was recognized as BET monolayer moisture content, and it has been found to be a reasonable guide to various aspects of interest in dried foods, related to the limit from which the rate of deteriorative reactions began to increase significantly. The limitation of BET model is that it is not able to predict sorption behavior accurately when aw is beyond 0.5.[Citation23] In this study, M0 of BET equation at 25°C were 5.142 g H2O/100 g dry solids, comparable to 5.5 g H2O/100 g dry solids at 24°C for freeze dried skim milk powder[Citation18] and higher than 4.5 g H2O/100 g dry solids for whole milk powder at 25°C.[Citation19] The GAB model was widely recommended to fit well with many food materials, since it was particularly successful for water activities up to 0.9. The monolayer moisture content, M0, obtained from GAB models at 25°C, was 6.189 g H2O/100 g dry solids, higher than that of freeze dried skim milk powder at 25°C,[Citation18] which was probably attributed to the difference of the milk components. K and C values obtained from GAB equation belonged to the ranges of 1–20 and 0.7–1, respectively, which was commonly reported in many food materials.[Citation11]
FIGURE 1 Water adsorption isotherm of SDBC powder at 25°C.
Thermal Transition of SDBC Powder Containing Unfreezable Water
The glass transition temperatures of foods depend mainly on the quantity of water, constituents, and molecular weight of solutes present in the food. The glass transition temperature in foods are not sharp but occur over a range of temperatures.[Citation17] The Tgi and Tgm of glass transition region determined from thermograms were commonly employed in the literature.[Citation9] All the thermograms of samples with moisture content less than 0.14 kg H2O/kg samples showed only one transition and no formation of ice. Due to the effects of fat melting on thermograms,[Citation18,Citation19] the glass transition temperatures of the samples reaching the equilibrium moisture content in saturated salt solutions with aw (0.225 and 0.328) were difficult to detect. The Tgi and Tgm of SDBC powders containing different unfreezable water contents were listed in . Obviously, Tg values decreased with increasing water content due to the plasticization effect of water on the amorphous constituents of the matrix. The Tgi values in were fitted using the G-T equation and the values of Tgs and k were estimated for 102.5°C and 9.44, respectively. The estimated Tgs in this study was close to Tg of lactose (101°C),[Citation18] comparable to Tg of whole milk powder (100.6°C).[Citation19]
TABLE 2 Glass transition temperature of SDBC powder as a function of moisture content (when there is no formation ice)
Thermal Transition of Bovine Colostrum Containing Freezable Water
It has been verified that annealing is necessary to allow the formation of maximum amount of ice and leads to a maximally-freeze-concentrated solid matrix.[Citation6] An annealing time of 30 min was taken as optimal for further analysis since annealing was able to eliminate devitrification of amorphous solids. A typical DSC thermogram of the sample containing freezable water with 30 min annealing was shown in and the three characteristic temperatures (onset as , maximum slope of heat flow as
, and peak as
),[Citation31,Citation32] end point of freezing (
), and glass transition temperature of the maximally-freeze-concentrated solution (
) could be determined from . The three characteristic temperatures, end point of freezing (
), and enthalpy of ice melting (△Hm) of bovine colostrums with different freezable moisture contents were obtained and listed in . As expected, the
decreased with increasing solids content and the magnitude of freezing point temperature depression depended on the molecular weight of the solids. Accordingly, the molecular weights of food materials were estimated using this technique.[Citation27] The
- Xs data in were modeled using the Chen model, and E and B values were estimated as 0.0338 and 0.1464, respectively. According to the E value, the molecular weight of bovine colostrum was evaluated for 532 g/mol, which was higher than that of skim milk.[Citation27] The enthalpy of ice melting was plotted against water content to determine the quantity of unfreezable water. A linear relationship was developed between enthalpy and water content data for bovine colostrum and the results were presented in . The amount of unfreezable water was 0.216 kg H2O/kg samples by extending the line to △Hm equal to zero.
TABLE 3 Freezing point temperature and maximal-freeze-concentration conditions of bovine colostrum as a function of initial solid concentration
FIGURE 2 A typical DSC thermogram of bovine colostrum containing freezable water (0.501 kg solids/kg samples) for 30 min annealing (,
, and
are the peak, maximum slope, and start of ice melting endotherm, and
is the end point of freezing for maximal-freeze-concentration condition).
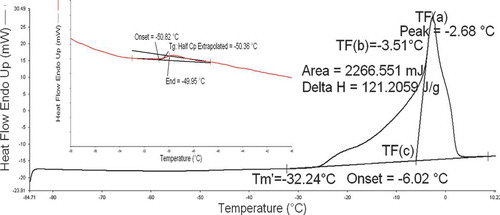
FIGURE 3 Enthalpy change of ice melting as a function of water content.
In general, the and
are independent of the initial solids concentration of food materials,[Citation18] but influenced by the molecular weight of total solids present in food materials. The
- Xs and
- Xs data were listed in and statistical analysis showed that there was no significant difference between the
and
and the initial solids concentration of bovine colostrum. The
and
of bovine colostrum were −32.14 and −50.52°C, respectively, which were comparable to −32 and −50°C of skim milk obtained by Jouppila and Roos.[Citation18]
State Diagram of Spray Dried Bovine Colostrum
The simplified state diagram of spray dried bovine colostrum was constructed by the freezing curve (AB), the glass line (CDE), and maximal-freeze-concentration conditions (points F and G) and is presented in . The stability and shelf life of low moisture and frozen food materials can be evaluated through state diagram. The freezing curve (AB) was modeled using the Chen equation. The B value obtained from nonlinear regression represented the unfreezable water content and the B value in this study corresponded to the unfreezable water of 0.1277 kg H2O/kg samples, which was lower than 0.216 kg H2O/kg samples obtained from enthalpy of ice melting. The value of (total solids content corresponding to
) was determined by extending the freezing curve into −32.14°C (point F or B). The estimated
value and the moisture content
corresponding to
were calculated as 0.807 kg solids/kg samples and 0.193 kg H2O/kg samples, respectively.
, also considered as the unfreezable water, was higher than the B value. To identify the glass transition temperature corresponding to the maximally-freeze-concentrated liquid bovine colostrum (
), the value of
was calculated by incorporating
into the glass line (point G) modeled using the G-T equation. The
was estimated for -50.52°C and
was 0.839 kg solids/kg samples. The value of
is of great importance for frozen foods to design the optimal storage conditions because the rates of diffusion controlled reactions in frozen foods may decrease considerably at temperatures less than
. Point H was determined from the intersection point of the glass line and a vertical line passing through point B (
) and the temperature corresponding to point H was recognized as the theoretical glass transition temperature (
) of maximally-freeze-concentrated solution and calculated as -62.12°C based on the predicted G-T model, which was lower than
. In theory, the value of
(total solids content corresponding to
) is equivalent to the value of
(total solids content corresponding to
).[Citation16] However, in practice, a difference between the value of
and the value of
commonly occurred. Point D was defined as
and
as the intersection of the freezing curve to the glass line by maintaining the similar curvature of the freezing curve (line AB).[Citation31] The values of
and
were estimated as −52.35°C and 0.835 kg solids/kg samples, respectively.
FIGURE 4 State diagram of spray dried bovine colostrum.
Assessing Water Activity and Glass Transition Concepts for Food Stability
The concept of water activity is an important tool in predicting microbial growth, enzymatic and non-enzymatic activities, and other deteriorative reactions in foods.[Citation33] According to water activity concept, a food product is most stable at its monolayer moisture content, which varies with the chemical composition, structure and environment conditions. Recently, the glass transition concept was also recommended to explain selected reaction kinetics in foods during production and storage.[Citation17] However, these two concepts mentioned above have their limitations.[Citation16,Citation17] Therefore, this is now being recommended to combine the water activity concept with the glass transition concept in assessing process-ability, deterioration, food stability, and shelf life predictions. In this study, storage stability of SDBC powder was evaluated based on the glass transition temperature and the adsorption isotherm and presented in . In this case, if the product is commercialized at room temperature (25°C), the critical moisture content (CMC) of SDBC powder that takes the product from the glassy to rubbery state is 5.129 g H2O/100 g dry solids and the corresponding critical aw is 0.158. This means that the SDBC powder is apt to become the rubbery state when stored at the environment relative humidity (RH) over 15.8%. On the other hand, the SDBC powder will lead to the rubbery state when the moisture content of SDBC powder is over 5.129 g H2O/100 g dry solids. The estimated CMC was much lower than M0, obtained from GAB equation, meaning that the glass transition concept always underestimates CMC, compared to the water activity concept, which was in line with other findings.[Citation12,Citation34,Citation35]
FIGURE 5 Relationships between glass transition temperature, water activity, and water content of SDBC powder.
The monolayer moisture content, M0, obtained from GAB equation was 6.189 g H2O/100 g dry solids. As can be observed from , the corresponding Tg and was 14.89°C and 0.234, respectively. It implied that according to the glass transition concept, the safe storage or processing temperature selected for SDBC powder with moisture content of 6.189 g H2O/100 g dry solids was below 14.89°C in order to prevent the samples from caking or collapse. From this result, it can be deduced that the state diagram of a food is useful for predicting the optimum storage or processing conditions.
CONCLUSIONS
The Chen and G-T models were suitable for fitting the freezing curve and the glass line, respectively. The estimated parameters E and B of the Chen model were 0.0338 and 0.1277 kg H2O/kg samples, respectively. The model parameters Tgs and k of the G-T model were estimated for 102.5°C and 9.44, respectively. The and
of maximal-freeze-concentration conditions were −32.14 and −50.52°C, respectively, and the corresponding
and
were 0.807 and 0.839 kg solids of kg samples, respectively. The state diagram of spray dried bovine colostrum powder was constructed by determining the freezing curve, the glass line, and the maximal-freeze-concentration conditions. The water sorption data provided the monolayer moisture content values of 6.189 g H2O/100 g dry solids and 5.142 g H2O/100 g dry solids in GAB and BET models, respectively. Based on the state diagram and sorption isotherm, the estimated critical water activity and critical moisture content were 5.129 g H2O/100 g dry solids and 0.158, respectively, when the storage temperature of SDBC powder was selected as room temperature (25°C).
FUNDING
The authors gratefully acknowledge the National Department of Science and Technology of China under the National Key Technology R&D Program (2006BAD04A14) for providing the financial support.
REFERENCES
- Gopal, P.K.; Gill, H.S. Oligosaccharides and glycoconjugates in bovine milk and colostrums. British Journal of Nutrition 2000, 84, 69–74.
- Cao, J.; Wang, X.; Zheng, H. Comparative studies on thermoresistance of protein G-binding region and antigen determinant region of immunoglobulin G in acidic colostral whey. Food and Agricultural Immunology 2007, 18 (1), 17–30.
- Michaelidou, A.; Steijns, J. Nutritional and technological aspects of minor bioactive components in milk and whey: Growth factors, vitamins and nucleotides. International Dairy Journal 2006, 16 (11), 1421–1426.
- Gapper, L.; Copestake, D.; Otter, D.; Indyk, H. Analysis of bovine immunoglobulin G in milk, colostrum and dietary supplements: A review. Analytical and Bioanalytical Chemistry 2007, 389 (1), 93–109.
- Chelack, B.; Morley, P.; Haines, D. Evaluation of methods for dehydration of bovine colostrum for total replacement of normal colostrum in calves. The Canadian Veterinary Journal 1993, 34 (7), 407–412.
- Rahman, M.S. State diagram of date flesh using differential scanning calorimetry (DSC). International Journal of Food Properties 2004, 7 (3), 407–428.
- Rahman, M.S.; Sablani, S.S.; Al-Habsi, N.; Al-Maskri, S.; Al-Belushi, R. State diagram of freeze-dried garlic powder by differential scanning calorimetry and cooling curve methods. Journal of Food Science 2005, 70 (2), E135–E141.
- Bai, Y.; Rahman, M.S.; Perera, C.O.; Smith, B.; Melton, L.D. State diagram of apple slices: Glass transition and freezing curves. Food Research International 2001, 34 (2–3), 89–95.
- Fabra, M.J.; Talens, P.; Moraga, G.; Martíez-Navarrete, N. Sorption isotherm and state diagram of grapefruit as a tool to improve product processing and stability. Journal of Food Engineering 2009, 93 (1), 52–58.
- Wang, H.; Zhang, S.; Chen, G. Glass transition and state diagram for fresh and freeze-dried Chinese gooseberry. Journal of Food Engineering 2008, 84 (2), 307–312.
- Rahman, M.S. Food Properties Handbook; CRC Press: Boca Raton, FL, 1995, 87–177.
- Syamaladevi, R.M.; Sablani, S.S.; Tang, J.; Powers, J.; Swanson, B.G. State diagram and water adsorption isotherm of raspberry (Rubus idaeus). Journal of Food Engineering 2009, 91 (3), 460–467.
- Slade, L.; Levine, L. A food polymer science approach to structure property relationships in aqueous food systems: On-equilibrium behavior of carbohydrate-water systems. In: Water Relationships in Food; Levine, H.; Slade, L.; Eds.; Plenum Press: New York, 1991, 29–101.
- Rahman, M.S. Glass transition and other structural changes in foods. In: Handbook of Food Preservation, 2nd Ed.; Rahman, M.S.; Ed.; CRC Press: Boca Raton, FL, 2007, 75–93.
- Rahman, M.S. Food stability determination by macro-micro region concept in the state diagram and by defining a critical temperature. Journal of Food Engineering 2010, 99 (4), 402–416.
- Rahman, M.S. Food stability beyond water activity and glass transtion: Macro-micro region concept in the state diagram. International Journal of Food Properties 2009, 12 (4), 726–740.
- Rahman, M.S. State diagram of foods: Its potential use in food processing and product stability. Trends in Food Science and Technology 2006, 17 (3), 129–141.
- Jouppila, K.; Roos, Y.H. Glass transitions and crystallization in milk powders. Journal of Dairy Science 1994, 77 (10), 2907–2915.
- Vuataz, G. The phase diagram of milk: A new tool for optimising the drying process Le Lait 2002, 82 (4), 485–500.
- Greenspan, L. Humidity fixed points of binary saturated aqueous solutions. Journal of Research of the National Bureau of Standard- Physics and Chemistry 1977, 81 (1), 89–96.
- AOAC International. Official Methods of Analysis of AOAC; Gaithersburg, MD: AOAC International, 1990.
- Sablani, S.; Syamaladevi, R.; Swanson, B. A review of methods, data and applications of state diagrams of food systems. Food Engineering Reviews 2011, 2 (3), 168–203.
- Lewichi, P.P. Data and models of water activity.II: Solid foods. In: Food Properties Handbook; Shafiur Rahman, M.; Ed.; CRC Press: London, 2009, 68–143.
- Boquet, R.; Chirife, J.; Iglesias, H.A. Equations for fitting water sorption isotherms of foods. III. Evaluation of various three-parameter models. International Journal of Food Science and Technology 1979, 14 (5), 527–534.
- Yu, H.N.; Zheng, Y.R.; Li, Y.F. Water adsorption isotherms and storage stability of freeze dried bovine colostrum powder. International Journal of Food Properties, 2013, 16 (8), 1764–1775.
- Gordon, M.; Taylor, J.S. Ideal copolymers and the second-order transitions of synthetic rubbers. I. non-crystalline copolymers. Journal of Applied Chemistry 1952, 2 (9), 493–500.
- Chen, C.S. Effective molecular weight of aqueous solutions and liquid foods calculated from the freezing point depression. Journal of Food Science 1986, 51 (6), 1537–1539.
- Roos, Y.H. Phase Transition in Foods, 1st Ed.; Academic Press Inc: San Diego, 1995.
- Abdenouri, N.; Idlimam, A.; Kouhila, M. Sorption isotherms and thermodynamic properties of powdered milk. Chemical Engineering Communications 2010, 197 (8), 1109–1125.
- Koç, B.; Yılmazer, M.S.; Balkır, P.; Ertekin, F.K. Moisture sorption isotherms and storage stability of spray-dried yogurt powder. Drying Technology 2010, 28 (6), 816–822.
- Rahman, M.S.; Al-Saidi, G.; Guizani, N.; Abdullah, A. Development of state diagram of bovine gelatin by measuring thermal characteristics using differential scanning calorimetry (DSC) and cooling curve method. Thermochimica Acta 2010, 509, 111–119.
- Rahman, M.S.; Senadeera, W.; Al-Alawi, A.; Truong, T.; Bhandari, B.; Al-Saidi, G. Thermal transition properties of spaghetti measured by differential scanning calorimetry (DSC) and thermal mechanical compression test (TMCT). Food and Bioprocess Technology 2011, 4 (8), 1422–1431.
- Rahman, M.S.; Labuza, T.P. Water activity and food preservation. In: Handbook of Food Preservation; Rahman, M.S.; Ed.; Marcel Dekker: New York, 1999, 339–382.
- Roos, Y.H. Water activity and physical state effects on amorphous food stability. Journal of Food Processing and Preservation 1993, 16 (6), 433–447.
- Sablani, S.S.; Kasapis, S.; Rahman, M.S. Evaluating water activity and glass transition concepts for food stability. Journal of Food Engineering 2007, 78 (1), 266–271.