
Abstract
Adulteration of butter with cheaper animal fats, such as lard, has become an issue in recent years. A simple and rapid analytical method of attenuated total reflectance in Fourier transform infrared spectroscopy was developed in order to determine the lard content in butter. The multivariate calibration of partial least square model for the prediction of adulterant was developed for quantitative measurement. The model yielded the highest regression with the correlation coefficient (R2) = 0.999, its lowest root mean square error estimation = 0.0947, and its root mean square error prediction = 0.0687, respectively. Cross validation testing evaluates the predictive power of the model. Partial least square model to be effective as their intercept of R2Y and Q2Y were 0.08 and –0.34, respectively.
INTRODUCTION
Food adulteration issues that were highlighted in the foregoing discussion should not be taken lightly. The determination of food authenticity and detection of adulteration are major concerns not only to consumers, but also to industries and policy makers at all levels of the production process.[Citation1] One of the major authenticity issues from the food products is the alteration of food ingredients labeling, whereby the high value materials are substituted with the cheaper ones without declaring it on the label,[Citation2] in particular with the dairy products as it has wide applications in food industries. Milk is a fairly expensive raw material from an economic point of view, and thus tempted for cheaper substitutes with other dairy and non-dairy ingredients. Such fraudulent practices in not declaring the ingredients into the product accordingly has posed a serious problem in recent years,[Citation3] especially in regards with violating consumer rights.[Citation4]
Milk fat is one of the most valuable fats for human nutrition and represents an expensive raw material which can be modified to make a variety of dairy products, such as buttermilk, ghee, smen (traditional salt butter), etc. In regards to butter as one of the main milk fat products that is important nutritionally and functionally, high standard and regulation for producing butter is developed. For the European community, butter must be produced only from cow’s milk or cream[Citation5] and thus several techniques have been developed for the detection of non-milk fats in butter.[Citation3−Citation9]
In several countries, food industries prefers to blend lard with some vegetable oils as part of food production.[Citation10] Lard has traditionally been used for deep frying of many types of food products as it is known to impart flavours that are considered to be desirable in some foods.[Citation11] Currently, lard is one of the cheapest oils and easily available for the food industries. However, the presence of lard in any food system poses serious concerns to certain religions, such as Islam, Judaism, and Hinduism, and it is forbidden for their followers to consume any foods containing porcine-based and its derivatives.[Citation12] Besides, diets rich in lard are known to be associated with certain health risk such as hypercholesterolemia and coronary heart disease.[Citation13] In the view of religious restrictions and the risk associated with consumption of lard, it is imperative that a rapid and sensitive method for identification of lard be developed.
Several research groups have focused on the use of Fourier Transform Infrared (FTIR) for authentication, identification, and classification of fats and oils as it offers several advantages such as rapid, simple, and non-destructive samples.[Citation14−Citation17] In addition, FTIR can be used for multi component analysis.[Citation18] Infrared spectroscopy is one of the most powerful spectroscopic techniques for food analysis since it explains details in functional groups as well as chemical composition that are contained in the infrared spectrum of specific substances.[Citation19]
FTIR spectroscopy combined with partial least square (PLS) model is reported to have been used successfully in the quantitative analysis of lard in cake formulation,[Citation20] chocolate products,[Citation10] analysing the mixture of lards with other animal fats,[Citation21] and a variety of identifications of rice vinegars.[Citation22] For authentication, FTIR combined with chemometrics, has been explored in order to detect adulterants such as lard in virgin coconut oil,[Citation23] cod liver oil,[Citation24] palm kernel oil,[Citation25] and also to analyze grape seed oil mixed with nigella sativa oil.[Citation26]
Metabolite fingerprinting considers comprehensive analysis of all metabolites in the sample for utilization of chemometrics. Chemometrics can generally be described as the chemical discipline that uses mathematical and statistical methods in designing or selecting optimal measurement procedures and experiments, and provides maximum chemical information by analyzing chemical data. Multivariate calibration is a useful chemometric and often used for analysis of complex mixture, as it enables the rapid and simultaneous determination of each component in complex mixture without time consuming and with minimal sample preparation.[Citation27] The common multivariate calibration methods are PLS and principle component regression (PCR).[Citation28] PLS calibration works with the information obtained from the whole spectra to develop the regression equation between FTIR spectra (independent variables) and concentration of analytes of interest (dependent variable). Meanwhile, PCR performs multiple inverse regressions of the predictor variables against the scores rather than the original data.[Citation29]
Although, several studies on the combination of FTIR and chemometrics have been published,[Citation30−Citation32] there is negligible reports on the study of butter adulterated with lard. Therefore, in this report, FTIR spectroscopy was combined with multivariate calibration using PLS for quantitative analyses of butter adulterated with lard.
MATERIALS AND METHODS
Lard Samples
Lard was obtained by rendering process of the pig’s adipose tissue from a Serdang wet market in Pasar Borong Selangor, Malaysia. Sampling was done three times, and consisted of three pig samples. Adipose tissues were heated using microwave oven according to the method proposed by Che Man & Mirghani.[Citation21] Melted fat was collected and filtered with glass wool. Fat was dried over anhydrous sodium sulphate and kept in a freezer at (–20°C) before further analysis.
Butter Sample Preparation
Fresh milk was collected from UPM dairy farm. The cream of milk was separated using cream separator and was shaken in a medium-high speed mixer until the colour change to pale yellow. The butter and buttermilk started to separate, and the butter was then drained using a cloth. The pale yellow buttermilk was collected and kept at (–20°C) before further usage.
Measurement of FTIR Spectra
FTIR spectra of samples (either pure or admixtures) were measured using a Nicolet 6700 FTIR spectrometer (Thermo Nicolet Corp., Madison, WI) equipped with deuterated triglycine sulphate (DTGS) detector and KBr/Germanium as beam splitter. The instrument was attached to the OMNIC software. The sampling compartment was a Smart Attenuated Total Reflectance accessory with dimensions of 10 x 60 mm, producing 12 internal reflections with a penetration depth (infrared beam) of 2.0 μm, composed of zinc selenide (ZnSe) crystal having refractive index of 2.4 at 1000 cm−1. The spectra were collected at mid infrared region (4000–650 cm−1), using 32 scans at a resolution of 4 cm−1. These spectra were subtracted against the background of air spectrum and were recorded as absorbance values at each data point in triplicate.
Statistical Analysis
The FTIR spectra were automatically reduced to ASCII files. The multivariate calibration for FTIR spectral data was performed with the SIMCA-P software (v. 12.0, Umetrics, Umeå, Sweden). PLS was done with pareto scaling and different spectra filter were used for multivariate calibration.
RESULTS AND DISCUSSION
FTIR Spectra Analysis
The animal fats are essentially constituted of triglyceride with different substitution patterns, number of fatty acids, degree of saturation of the chains, and other minor components. FTIR spectra could represent a combined fingerprint pattern unique to each fat and oil.[Citation33] In fats and oils, most of the peaks and shoulders of the spectrum are attributable to the specific functional groups.[Citation34] The importance of IR spectroscopy in the identification of molecular structures originates from the much information content obtained and the possibility to assign certain absorption bands related to its functional groups.
shows the spectra for pure butter and lard samples analyzed using FTIR spectroscopy in the mid infrared region 4000–650 cm−1. The whole range of FTIR spectra looks very similar by observation using naked eyes because of the similarity in chemical composition. The obvious differences between spectra of the two samples, were due to the intensity at wavenumbers of (a) 3005 cm−1; (f) 1465 cm−1; (g) 1376 cm−1; (h) 1236 cm−1; (i) 1163 cm−1; (j) 1116 cm−1; (k) 1097 cm−1; and (l) 725 cm−1.The peak at (a) 3005 cm−1 was due to stretching vibrations of the cis olefinic double bond. Lard has the higher proportion of oleic and linoleic acyl group compared to butter due to the higher frequency for this band. Both the methylene asymmetrical stretching band at approximately (b) 2923 cm−1 and (c) 2850 cm−1 were obviously present in both samples with different intensity. The peak at (f) 1465 cm−1 was attributed to C–O stretching and CH2 bending, whereas peaks at 1376 cm−1 were assigned to –C–O stretching. The bands at 1236 cm−1,1163 cm−1, 1116 cm−1, 1097 cm−1, and peak at 725 cm−1 were results from the overlapping of the methylene rocking vibrations and the out-of-plane bending vibration of cis-disubstituted olefins.[Citation35]
FIGURE 1 FTIR-ATR spectra of pure butter and lard showed peak at wavenumber of (a) 3005 cm−1; (b) 2923 cm−1; (c) 2850 cm−1; (d) 1746 cm−1; (e) 1650 cm−1; (f) 1465 cm−1; (g) 1376 cm−1; (h) 1236 cm−1; (i) 1163 cm−1; (j) 1116 cm−1; (k) 1097 cm−1; and (l) 725 cm−1.
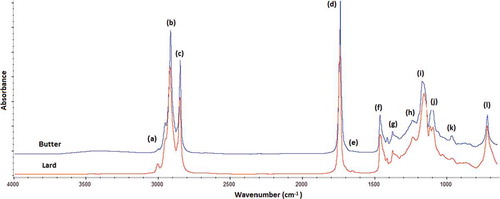
The carbonyl (C=O) absorption of ester linkage is observed at wavenumber of (d) 1746 cm−1, with strong intensity due to the great difference of electro-negativity of carbon and hydrogen atoms. The C=C stretching mode of unconjugated olefins usually shows moderate to weak absorption at 1667–1640 cm−1. A small band at (e) 1650 cm−1 was detected too. The functional groups together with vibration modes responsible for infrared absorptions are compiled in .
TABLE 1 Functional groups and modes of vibration in lard and butter*
PLS
Quantification of lard was carried out using PLS. PLS is an established method for multivariate statistical data evaluation. It models a relation between the independent (FTIR-ATR profile) and dependent variable (concentration of lard). Butter adulterated with 0.5–80% of lard was used for quantification purposes. The model obtained been used for the prediction of concentration of unknown samples. The theory of the method and the applications in food science has been described in a number of publications over the recent year.[Citation10,Citation20,Citation36,Citation37]
TABLE 2 Multivariate calibration for determining of butter content adulterated with lard using PLS technique
In PLS calibration models, the evaluation of the method linearity was carried out in order to show proportional relationship between absorbance versus analyte concentrations. Some parameters were evaluated in order to choose the best calibration model, such as regression coefficient (R2), root mean standard error of estimation (RMSEE) and root mean standard error of prediction (RMSEP). Different FTIR spectra filter were used in the calculation using PLS methods either for normal or other spectra filters such as its derivatives, multiplicative signal correction (MSC) and standard normal variate (SNV).
A rapid and often utilized method for reducing scatter effects for continuous spectra consists of using derivatives.[Citation38] The first derivative spectrum is the slope at each point of the original spectrum. It peaks where the original spectrum has maximum slope and it crosses zero where the original has peaks. The second derivative spectrum is to measure the curvature at each point in the original spectrum. Usually, this derivative spectrum is similar to the original spectrum and has peaks approximately as the original spectrum, albeit with an inverse configuration.[Citation38] The effect of the first derivative is usually to remove an additive baseline (“offset”), whereas the effect of the second derivative also involves removal of linear baseline. The primary objectives of MSC filters is to facilitate a removal of spectral artifacts and interferences that are uncorrelated to the target analyte concentration i.e. to allow a separation of physical light-scattering effects from chemical and vibrational light absorbance effects in spectra while SNV that introduced by Barnes[Citation39] were to reduce multicollinearity, base line shift and curvature. These transformations are applied to individual spectra and are distinct from other transformations which operate at each wavelength in a given set of spectra, thus leaving set to set levels uncorrected.
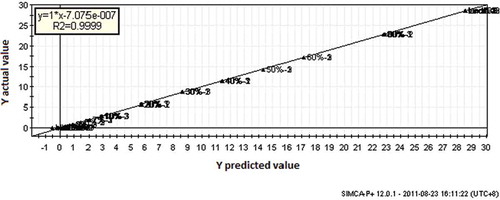
The results obtained from the PLS calibration in terms of R2, RMSEE, and RMSEP either for normal or other spectra filters such as its derivatives, MSC and SNV are presented in . The coefficient of determination (R2) values for the relationship between the actual value and predicted value of lard concentration based on FTIR spectra are quite high (R2 = 0.90). As shown in and , PLS calibration in the second derivatives spectra revealed the highest of R2 (0.999) and the lowest of RMSEE (0.0947) and RMSEP (0.0687) value compared with other spectra filter ().
FIGURE 2 PLS calibration model of actual and predicted value (% v/v) of lard concentration based on FTIR-ATR profile of samples.
Statistical Validation
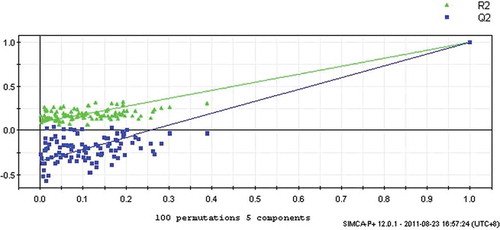
The most common ways to interpret the multivariate model are by means of R2Y and cumulative Q2Y after cross validation.[Citation40] Cross validation testing evaluates the predictive power of the model. The R2Y shows the amount of Y variables explained by the model after cross validation and gives and overview about the fitting of the model, while cumulative Q2Y gives information about the predictive quality of the model. All values close to one resembles a good model.[Citation40] The PLS models were validated using response of permutation test through 100 permutations. The permutation test assesses the statistical significance of the estimated predictive power previously calculated by cross validation test.[Citation40] The test compares the distribution of R2Y and Q2Y when the Y data is randomly permuted (while X data are left intact), with R2Y and Q2Y value are non-permuted Y model.[Citation41] The validation plot is constructed with the y-axis representing R2Y and Q2Y of the original and permutated models, while the x-axis represents correlation coefficients between permutated and original models. Regression lines were then fitted among R2Y and Q2Y points. To be a valid model, the original models should have higher R2Y and Q2Y value than the permutated models. To achieve this, Erikkson[Citation39] mentioned that the intercepts of R2Y should be less than 0.3–0.4, while Q2Y should not exceed 0.05. PLS model was shown as good model as the intercept of R2Y are 0.08, intercept of Q2Y are –0.34 ().
FIGURE 3 Results from the response permutation test model. The vertical axis gives the R2Y and Q2Y values of each model. The horizontal axis represents the correlation coefficient between the “real” Y and the permuted Y. The PLS model is strongly significant. Intercept of R2 and Q2 were 0.0837 and –0.343, respectively.
CONCLUSION
In conclusion, FTIR-ATR together with chemometric of PLS is a highly performance approach for quantitative analysis of butter that has been adulterated with lard. This method is rapid, non-destructive and easy-to-use. It can be considered as “green analytical technique”. Great precision of this method is a requirement of quality control in the dairy product industry. This approach technique constitutes a powerful alternative for authentication of dairy products.
ACKNOWLEDGEMENTS
The authors were grateful and acknowledge Universiti Putra Malaysia (UPM) for providing the funding support RUGS 91032 awarded to Prof. Dr. Yaakob B. Che Man.
REFERENCES
- Fernandez, C.; Astier, C.; Rock, E.; Coulon, J.B.; Berdagué, J.L. Characterization of milk by analysis of its terpene fractions. International Journal of Food Science and Technology 2003, 38, 445–451.
- Al-Jowder, O.; Kemsley, E.K.; Wilson, R.H. Mid-infrared spectroscopy and authenticity problems in selected meats: A feasibility study. Food Chemistry 1997, 59, 195–201.
- Lipp, M. Review of methods for the analysis of triglycerides in milk fat: Application for studies of milk quality and adulteration. Food Chemistry 1995, 54, 213–221.
- Ulberth, F.; Buchgraber, M. Authenticity of fats and oils. European Journal of Lipid Science & Technology 2000, 102, 687–694.
- European Union, Rules for granting aid to skimmed milk processed into compound feeding stuffs and skimmed-milk powder intended in particular for feed for calves, Commission Regulation 2426/90 0f 21 of August 1990. Official Journal of the Europen Communities. L228 9–14.
- Contarini, G.; Povolo, M.; Bonfitto, E. The present and future for controlling the authenticity of butter. Latte 1999, 24, 60–69.
- De la Fuente, M.A.; Juárez, M. Application of chromatographic techniques to the study of triglycerides and sterols of milk fat. Food Science and Technology International 1999, 52, 103–119.
- Kamm, W.; Dionisi, F.; Hischenhuber, C.; Engel, K.H. Authenticity of fats and oils. Food Reviews International 2001, 17, 249–290.
- Jee, M. Milk Fat and Other Animal Fats in Oils and Fat Authentication, Blackwell Publishing CRC Press: Reading, UK, 2002, 115–142.
- Che Man, Y.B.; Syahariza, Z.A.; Mirghani, M.E.S.; Jinap, S.; Bakar, J. Analysis of potential lard adulteration in chocolate and chocolate products using Fourier transform infrared spectroscopy. Food Chemistry 2005a, 90, 815–819.
- Che Man, Y.B.; Gan, H.L.; Nor Aini, I.; Nazimah, S.A.H.; Tan, C.P. Detection of lard adulteration in RBD palm olein using an electronic nose. Food Chemistry 2005b, 90, 829–835.
- Regenstein, J.M.; Chaudry, M.M.; Regenstein, C.E. The kosher and halal food laws. Comprehensive Reviews in Food Science and Food Safety 2003, 2, 111–127.
- Rashood, K.A.; Abou-Shaaban, R.A.; Abdel-Moety, E.M.; Rauf, A. Compositional and thermal characterization of genuine and randomized lard: A comparative study. Journal of American Oil Chemists’ Society 1996, 73, 303–309.
- Yang, H.; Irudayaraj, J.; Paradkar, M.M. Discriminant analysis of edible oils and fats by FTIR, FT-NIR, and FT-Raman spectroscopy. Food Chemistry 2005, 93, 25–32.
- Lai, Y.W.; Kemsley, E.K.; Wilson, R.H. Potential of Fourier transform infrared spectroscopy for the authentication of vegetable oils. Journal of Agricultural and Food Chemistry 1994, 42, 1154–1159.
- Dupuy, N.; Duponchel, L.; Huvenne, J.P.; Sombret, B.; Legrand, P. Classification of edible fats and oils by principal component analysis of Fourier transform infrared spectra. Food Chemistry 1996, 57, 245–251.
- Safar, M.; Bertrand, D.; Robert, P.; Devaux, M.F.; Genot, C. Characterization of edible oils, butters, and margarines by Fourier transform infrared spectrometry with attenuated total reflectance. Journal of the American Oil Chemists Society 1994, 71, 371–377.
- Van de Voort, F.R.; Sedman, J.; Ismail, A.A. A rapid FTIR quality-control method for determining fat and moisture in high-fat products. Food Chemistry 1993, 48, 213–221.
- Kumosinski, T.F.; Farrell, H.M. Determination of the global secondary structure of proteins by Fourier transform infrared (FTIR) spectroscopy. Trends in Food Science and Technology 1993, 4, 169–175.
- Syahariza, Z.A.; Che Man, Y.B.; Selamat, J.; Bakar, J. Detection of lard adulteration in cake formulation by Fourier transform infrared (FTIR) spectroscopy. Food Chemistry 2005, 92, 365–371.
- Che Man, Y.B.; Mirghani, M.E.S. Detection of lard mixed with body fats of chicken, lamb, and cow by Fourier transform infrared spectroscopy. Journal of the American Oil Chemists’ Society 2001, 78, 753–761.
- Fei, L.; Babangida, L.Y.; Jianli, Z.; Lei F.; Yong, H.; Li, W. Variety identification of rice vinegars using visible and near infrared spectroscopy and multivariate calibrations. International Journal of Food Lipids 2011, 14, 1264–1276.
- Rohman, A.; Che Man, Y.B. Monitoring of virgin coconut oil (VCO) adulteration with palm oil using fourier transform infrared (FTIR) spectroscopy. Journal of Food Lipids 2009a, 16, 618–628.
- Rohman, A.; Che Man, Y.B. Analysis of cod liver oil adulteration using Fourier transform infrared (FTIR) spectroscopy. Journal of the American Oil Chemists Society 2009b, 86, 1149–1153.
- Manaf, M.A.; Che Man, Y.B.; Hamid, N.S.A.; Ismail, A.; Abidin, S.Z. Analysis of adulteration of virgin coconut oil by palm kernel olein using Fourier transform infrared spectroscopy. Journal of Food Lipids 2007, 14, 111–121.
- Nurrulhidayah, A.F.; Che Man, Y.B.; Al-Kahtani, H.; Rohman, A. Application of FTIR spectroscopy coupled with chemometrics for authentication of Nigella sativa seed oil. Spectroscopy 2011, 25, 243–250.
- Maggio, R.M.; Kaufman, T.S.; Del Carlo, M.; Cerretani, L.; Bendini, A.; Cichelli, A.; Compagnone, D. Monitoring of fatty acid composition in virgin olive oil by Fourier transformed infrared spectroscopy coupled with partial least squares. Food Chemistry 2009, 114, 1549–1554.
- Christy, A.A.; Egeberg, P.K. Quantitative determination of saturated and unsaturated fatty acids in edible oils by infrared spectroscopy and chemometrics. Chemometric Intelligent Lab System 1997, 82, 130–136.
- Romía, M.B.; Bernàrdez, M.A. Multivariate calibration for quantitative analysis. In: Infrared Spectroscopy for Food Quality: Analysis and Control; D.W. Sun; Eds.; Elsevier: New York, 2009; 51–82.
- Lerma-García, M.J.; Ramis-Ramos, G.; Herrero-Martinez, J.M.; Simó-Alfonso, E.F. Authentication of extra virgin olive oil by Fourier Transform Infrared Spectroscopy. Food Chemistry 2010, 118, 78–83.
- Gurdinez, G.; Ozen, B. Detection of adulteration of extra virgin olive oil by chemometric analysis of mid infared spectral data. Food Chemistry 2009, 116, 519–525.
- Wang, L.; Lee, F.S.C.; Wang, X.; He, Y. Feasibilty study of quantifying and discriminating soybean oil adulteration in camellia oils by attenuated total reflectance MIR and fibre optic diffuse reflectance NIR. Food Chemistry 2006, 95, 529–536.
- Dupuy, N.; Duponchel, L.; Huvenne, J.P.; Sombret, B.; Legrand, P. Classification of edible fats and oils by principal component analysis of Fourier transform infrared spectra. Food Chemistry 1996, 57, 245–251.
- Bendini, A.; Cerretani, L.; Di Virgilio, F.; Belloni, P.; Bonoli-Carbognin, M.; Lercker, G. Preliminary evaluation of the application of the FTIR spectroscopy to control the geographic origin and quality of virgin olive oils. Journal of Food Quality 2007, 30, 424–437.
- Guillen, M.D.; Cabo, N. Infrared spectroscopy in the study of edible oils and fats. Journal of the Science of Food and Agriculture 1997, 75, 1–11.
- Faber, N.M.; Rajko, R. How to avoid over-fitting in multivariate calibration-the conventional validation approach and an alternative. Analytica Chimica Acta 2007, 595, 98–106.
- Haaland, D.M.; Thomas, E.V. Partial least squares methods for spectral analysis. I. Relation to other quantitative calibration methods and the extraction of qualitative information. Analytical Chemistry 1988, 60, 1193–1202.
- Naes, T.; Isaksson, T.; Davies, T. A User Friendly Guide to Multivariate Calibration and Classification. NIR publications: Chichester, U.K., 2002. ISBN: 0-95286662-5
- Barnes, R.J.; Dhanoa, M.S.; Lister, S.J. Standard normal variate transformation and de-trending of near-infrared diffuse reflectance spectra. Applied Spectroscopy 1989, 43, 772–777.
- Eriksson, L.; Johansson, E.; Kettaneh-Wold, N.; Wold, S. Multi and Megavariate Data Analysis. Umetrics AB: Umeå, Sweden, 2006.
- Eriksson, L.; Trygg, J.; Wold, S. CV-ANOVA for significance testing of PLS and OPLS models. Journal of Chemometris 2008, 22, 594–600.