
Abstract
A study was carried out to compare the fatty acid composition and thermal profiles of mono- and diacylglycerols of six commercial emulsifiers, coded as E1, E2, E3, E4, E5, and E6, purchased from different manufacturers with those of the same derived from lard. The lipid extraction from the commercial emulsifiers was done using the Soxhlet method and the isolation of individual mono- and diacylglycerols was carried out using a column chromatographic method. The isolated partial acylglycerols of lard and individual emulsifiers were subjected to fatty acid analysis by gas chromatography and thermal analysis by differential scanning calorimetry. A clear distinction between lard-based emulsifier and the commercial emulsifiers was achieved by the application of principal components analysis to the fatty acid data. According to thermal analysis, mono- and diacylglycerols of lard displayed significant differences from those of commercial mono- and diacylglycerols with respect to the thermal transitions in the cooling curves. This study concluded that partial acylglycerols of none of the commercial emulsifiers employed in this study displayed similarity to those of lard-based emulsifiers.
INTRODUCTION
Mono- (MAG) and diacylglycerols (DAG) coded as E471 in the food labeling are the most widely used emulsifiers by the food industry.[Citation1,Citation2] They are produced commercially using lipid materials originating from either plant or animal sources. Although MAG and DAG produced from plant-based raw materials are preferred as emulsifiers, there are possibilities for use of animal lipids in their production.[Citation3 − Citation5] A study previously carried out by Sudraud et al.[Citation6] indicated that some of the commercially available MAG and DAG were originated from hydrogenated lard (LD). As the use of emulsifiers derived from LD as a food additive is prohibited under the halal and kosher food regulations,[Citation7] there has been a great deal of interest for methods, which could detect MAG and DAG originating from animal sources. Recently, Indrasti et al.[Citation8] investigated the use of two-dimensional gas chromatography coupled to mass spectrometry (GC-TOF-MS) to distinctly identify partial acyl-glycerols of LD, from those of sunflower, corn oil, butter, and palm oils. This study employed two types of non-orthogonal columns, namely, DB17ht as the primary column and SLB-5ms as the secondary column for the separation of individual partial acyl-glycerol. In another study, Suman et al.[Citation9] used liquid chromatography coupled with mass spectrometry (LC-MS) to quantify some food emulsifiers composed of MAG and DAG in complex food matrices. In all these previous studies, the component fatty acids of partial acyl-glycerols of LD and commercially available emulsifiers were not compared. Also, the use of thermal profiling of partial acyl-glycerols by differential scanning calorimetry (DSC) as a means of detecting their source of origin was not considered. Hence, the objective of this study was to study fatty acid composition and DSC thermal profiles of MAG and DAG isolated from six commercial emulsifiers available in Malaysia and to compare them with those of MAG and DAG derived from LD. This may help to verify whether any of the commercial brands of emulsifiers look similar to MAG and DAG derived from LD.
MATERIALS AND METHODS
Materials, Sample Collection, and Treatments
LD was extracted from adipose tissue of swine collected from three different locations in West Malaysia according to microwave extraction methods, as reported by De Pedro et al.[Citation10] Six different samples of commercial emulsifiers identified by their sample code (E1, E2, E3, E4, E5, and E6) were collected in triplicate from different manufacturers operating in Malaysia. Samples of LD-based MAG and DAG were synthesized via a chemical glycerolysis method as described below. A set of fatty acid methyl esters comprising 37 fatty acids (C4 to C24) and mixtures of mono-, di-, and triacylglycerol standards were purchased from Sigma-Aldrich (St. Louis, MO, USA). All chemicals used in this study were either analytical or high performance liquid chromatographic (HPLC) grade unless otherwise specified.
Extraction of Lipids from Commercial Emulsifiers
The extraction of lipids from commercial emulsifiers was carried out by a solvent extraction method using Soxtec 2050 semi-automated solvent extractor (Foss Tecator AB, Hoganas, Sweden) according to the procedure described by Sundaram et al.[Citation11]
Preparation of LD-Based MAG-DAG
Chemical glycerolysis of LD was performed according to the previous study reported by Indrasti et al.[Citation8] For glycerolysis reaction, a 35-g oil sample was mixed with 15 g of glycerol (99% purity) and a 0.2 g portion of sodium hydroxide pellet. The mixture was then heated at 250°C with a vigorous swirling for 60 min.
Column Chromatographic Separation of MAG and DAG
The separation of MAG and DAG from lipid extracts of commercial samples was carried out according to AOCS method Cd 11c-93[Citation12] using a glass column filled with Davison 923 type silica gel (Sigma-Aldrich). Thin layer chromatography (TLC) was run subsequently to verify purity of the fractions collected through column chromatography.
Analysis of Fatty Acid Methyl Esters (FAME)
FAME were prepared by dissolving a 50-mg portion of MAG/DAG in 0.8 ml of hexane and adding a 0.2-ml portion of 1 M solution of sodium methoxide[Citation13] and analyzed on a gas chromatograph (Agilent Technologies, Singapore) fitted with a FID detector. The polar capillary column RTX-5 (0.32 mm internal diameter, 30 m length, and 0.25 μm film thickness) (Restex Corp., Bellefonte, PA, USA) was used. The oven temperature was programmed as follows: initial temperature of 50°C (for 1 min), and programmed to increase to 200°C at 8°C/min. Both injector and detector temperatures were maintained at 200°C throughout the analysis. The carrier gas (helium) flow rate was 1.0 mL/min and the split ratio was 58:1. The identification of the peaks of the samples was done with reference to a chromatographic profile containing FAME standards. The percentage of fatty acid was calculated as the ratio of the partial area to the total area.[Citation14]
Thermal Analysis
Thermal analysis was carried out on a Mettler-Toledo differential scanning calorimeter. Nitrogen (99.999% purity) was used as the purge gas at a rate of 20 mL/min. The instrument was calibrated with indium and dodecane. Approximately 6–8 mg of the melted sample was placed in a standard DSC aluminum pan and then hermetically sealed. An empty, hermetically-sealed DSC aluminum pan was used as the reference. The MAG and DAG samples were subjected to the following temperature program: 70°C isotherm for 1 min, cooled at 5°C/min to -70°C.[Citation14]
Statistical Analysis
Data were statistically analyzed by one-way analysis of variance (ANOVA) using the MINITAB (version 14) statistical package at 0.05 probability level. For the grouping and classification models, principal components analysis (PCA) was carried out using Unscrambler 9.7 (Camo, USA) software.
RESULTS AND DISCUSSION
Partial Acylglycerols Distribution in Emulsifiers
The proportional distribution of MAG and DAG from the lipid extracts of commercial emulsifiers are given in parentheses as shown in . The purity of the separation of the partial acylglycerols is confirmed by TLC, which showed distinguishable spots for MAG, DAG, and triacylglycerol (TAG) of each sample. In all of the samples, the amounts of MAG obtained were around 54 to 58%, while the amounts of DAG were around 38 to 39%. According to Moonen and Bas,[Citation15] the total partial acylglycerol (MAG+DAG) content of commercial emulsifiers should be around 70% (wt/wt), of which the proportion of MAG is expected to be in the range of 45–55%. According to the data presented in , almost all commercial samples used in this study were found to satisfy this requirement.
Table 1 Fatty acid composition of mono- (MAG) and diacylglycerols (DAG) from coded samples of commercial emulsifiers and lard
Comparative Fatty Acid Profiles of MAG
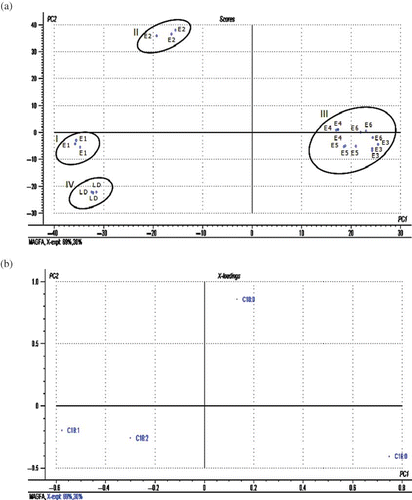
The overall fatty acids distributional patterns of commercial MAG (E1, E2, E3, E4, E5, and E6) and LD-based MAG are compared as shown in . Out of the six commercial samples, MAG of E3, E4, E5, and E6 are found to be somewhat similar in their fatty acid distributional pattern. In these four samples, the total saturated fatty acid content is more than 90%, of which palmitic (53–62%) is the most dominant fatty acid followed by stearic (32–38%) acid. Although MAG of E2 is also found to possess around 77% saturated fatty acids, its most dominant fatty acid is stearic (54%) followed by palmitic (23%). On the other hand, E1 and LD are found to possess fatty acid distributional patterns completely different from the rest of the series. In comparison to other samples, E1 and LD are found to possess higher proportions of unsaturated fatty acid (56–62%) of which oleic (37–39%) is the most dominant fatty acid. Of course, they differed from each other with respect to the proportion of the second most abundant fatty acid. Owing to the similarity in their major fatty acid, finding differentiation between MAG of E1 and LD by direct comparison of fatty acid data might become difficult. However, application of multivariate data handling techniques, such as PCA, would enable to extract more subtle information that could lead to the differentiation between them. PCA has already been recognized for its capability to identify patterns in data, and expressing the data in such a way as to emphasize their similarities and differences.[Citation16,Citation17] For the purpose of PCA analysis, fatty acid, namely, palmitic (C16:0), stearic (C18:0), oleic (C18:1), and linoleic (C18:2), are considered as independent variables. In the score plot, the projection of samples are defined by principal component 1 (PC 1) and principal component 2 (PC 2). PC 1 is the linear combination of variables that explain the highest variation among the samples, while PC 2 is orthogonal to PC 1 and exhibited the second largest variation.[Citation8] In this case, the PC 1 components explained 69% variation, while PC 2 explained 30% variation with a total of 99% variation. According to the score plot shown in , a clear group separation could be observed between LD-based MAG and MAG of E2, E3, E4, E5, and E6. While clusters of LD (cluster IV) and E1 (cluster I) are located in the lower left quadrant, the commercial samples of E3, E4, E5, and E6 are tightly grouped together in cluster I, which is located in the lower right quadrant. In the case of E2 (cluster II), they are located in the upper left quadrant. Although E1 and LD samples are located in the same quadrant, there was sufficient separation between them as shown in the score plot. Variables giving high influence on the separation of the samples in the score plot could be traced from the analysis of loading plot as shown in . Generally, variables that are located further away from the origin contribute the most variation to the principal component model. According to , palmitic (C16:0) and oleic (C18:1) are the most discriminating parameters that influence the separation of the sample series along PC 1 axis, while stearic acid (C18:0) is the most discriminating parameter along PC 2 axis. Based on this, it seems that cluster III (E3, E4, E5, and E6) is separated from other series mainly due to high content of palmitic (C16:0) acid, while cluster II comprising E2 samples is separated from other series due to its high content of stearic (C18:0) acid. On the other hand, MAG derived from LD (cluster IV) and E1 (cluster I), are separated from the rest of the samples due to high contents of oleic (C18:1) and linoleic (C18:2) acids.
Figure 1 Principal component analysis of MAG based on fatty acid compositions: (a) score plot and (b) loading plot. (Color figure available online.)
Comparative Fatty Acid Profiles of DAG
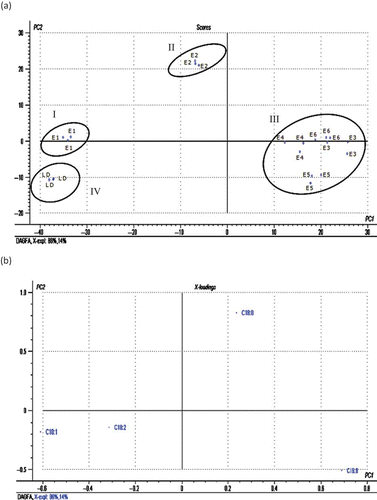
Fatty acid compositions of commercial DAG (E1, E2, E3, E4, E5, and E6) and LD-based DAG are compared as shown in . The fatty acid distributional patterns of DAG are almost similar to those of MAG. DAG of all commercial samples except E1 and E2 are found to have palmitic (52–59%) as the most dominant fatty acid followed by stearic (29–38%) acid. Although E2 is also found to possess around 75% saturated fatty acids, the most dominant fatty acid is stearic (49%) followed by palmitic (25%) acid. As discussed for MAG fatty acids, DAG of E1 and LD are found to possess higher proportions of unsaturated fatty acid (56–64%) of which oleic (38–42%) is the most dominant fatty acid. Owing to the similarity in the degree of unsaturation and the dominant fatty acid, finding differentiation between DAG of LD and E1 by direct comparison of fatty acid data may be difficult. However, application of PCA to the overall fatty acid distribution helped to get a better discrimination between DAG of commercial samples and LD-based DAG. When each fatty acid was taken as a variable, a score plot of all six commercial DAG (E1, E2, E3, E4, E5, and E6) and LD-based DAG yielded a group separation as shown in . The score plot showed that PC 1 accounted for 86% of the variation, while PC 2 described 14% variation with a total of 100% variation. While LD (cluster IV) was located in the lower left quadrant, E1 (cluster I) and E2 (cluster II) are located in the upper left quadrant. In the meantime, DAG of E3, E4, E5, and E6 are grouped together in cluster III, which is located at the lower right quadrant. Thus, the DAG of commercial samples are found far apart from the cluster of DAG derived from LD. According to the loading plot as shown in , along PC 1 axis, palmitic (C16:0) and oleic (C18:1) are the most discriminating parameters that influence the separation of the sample series, while stearic (C18:0) acid is the most discriminating parameter along PC 2 axis. Based on this, cluster III (E3, E4, E5, and E6), which covers the majority of the commercial samples, is separated from other series mainly due to high content of palmitic acid, while cluster II comprising of E2 samples is separated from other samples due to its high content of stearic (C18:0) acid. On the other hand, DAG derived from LD (cluster IV) and E1 (cluster I), is separated from other samples due to high contents of oleic (C18:1) and linoleic (C18:2) acids.
Figure 2 Principal component analysis of DAG based on fatty acid compositions: (a) score plot and (b) loading plot. (Color figure available online.)
Comparative Cooling Profiles of MAG
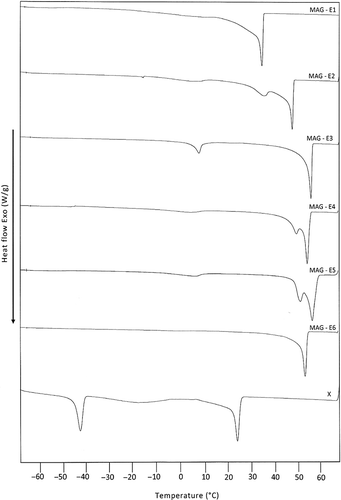
The cooling profiles of MAG derived from LD and those isolated from commercial emulsifiers are compared as shown in . The cooling profile of MAG of LD is represented by curve-X while those of all six commercial samples are represented by the curve MAG-E1, MAG-E2, MAG-E3, MAG-E4, MAG-E5, and MAG-E6. It is clear that the thermal profile displayed by the MAG of LD (curve-X) is distinctly different from those of all commercial samples. While MAG derived from LD is found to display thermal transitions in both high (>0°C) and low temperature regions (<0°C), MAG of commercial samples are not found to display any significant thermal transitions in the low temperature region (<0°C). Other than this, the onset of crystallization of MAG derived from LD (T onset = 27.70°C) is also significantly lower than those of commercial samples (T onset = 37 - 60°C). These observed differences between the thermal profiles of MAG derived from LD and those of the six commercial samples could probably be due to the differences in the distribution of fatty acids ().
Figure 3 DSC cooling curves of MAG of lard (curve-X) and some commercial emulsifiers (curve MAG-E1 to E6).
Comparative Cooling Profiles of DAG
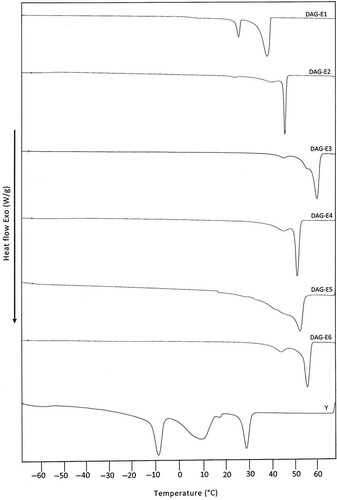
An overlay of cooling curves in shows the nature of thermal profiles displayed by DAG derived from LD (curve-Y) and those of commercial samples (curve-DAG-E1, DAG-E2, DAG-E3, DAG-E4, DAG-E5, and DAG-E6). As discussed for MAG, the thermal profile displayed by the DAG of LD (curve-Y) is also distinctly different from those of DAG extracted from all commercial samples. While the cooling profile of DAG of LD is found to display multiple transitions covering both high (>0°C) and low (<0°C) melting regions, DAG of all commercial samples are not found to display any significant transition in the low temperature region (<0°C). Apart from this, the onset of crystallization of DAG derived from LD (T onset = 34°C) is lower than those of commercial samples (T onset = 40 - 60°C) as seen previously in the case of MAG of LD (). Here, also, the observed difference between the thermal profiles of DAG derived from LD and those of the six commercial samples could be attributed to the differences in the distribution of fatty acids ().
Figure 4 DSC cooling curves of DAG of lard (curve-Y) and some commercial emulsifiers (curve DAG-E1 to E6).
CONCLUSIONS
This study demonstrated that the fatty acid distribution patterns of MAG and DAG in commercial emulsifiers (E2, E3, E4, E5, and E6) are distinctly different from those of MAG and DAG derived from LD. The apparent similarities seen between the fatty acid distributional pattern of sample E1 and that of MAG and DAG of LD could be resolved by the application of PCA to fatty acid data. As the nature of the DSC profiles displayed by MAG and DAG derived from LD is distinctly different from those of MAG and DAG extracted from commercial emulsifiers, finding differentiation between them by direct comparison is easier.
ACKNOWLEDGMENTS
The authors gratefully acknowledge the financial support from a research grant (02-12-1010 FR) obtained under the Fundamental Research Grants Scheme of the Ministry of Higher Education, Malaysia.
REFERENCES
- Damstrup , M.L. , Jensen , T. , Sparso , F.V. , Kiil , S.Z. , Jensen , A.D. and Xu , X. 2005 . Solvent optimization for efficient enzymatic monoacylglycerol production based on a glycerolysis reaction . Journal of American Oil Chemists’ Society , 82 ( 8 ) : 559 – 564 .
- Zhong , N. , Li , L. , Xu , X. , Cheong , L. , Li , B. , Hu , S. and Zhao , X. 2009 . An efficient binary solvent mixture for monoacylglycerol synthesis by enzymatic glycerolysis . Journal of American Oil Chemists’ Society , 86 ( 8 ) : 783 – 789 .
- Soe , J.B. 2008 . Solid phase glycerolysis. US Patent No. 0233235A1
- Stevenson , D.E. , Stanley , R.A. and Furneaux , R.H. 1993 . Glycerolysis of tallow with immobilised lipase . Biotechnology Letter , 15 ( 10 ) : 1043 – 1048 .
- McNeill , G.P. , Borowitz , D. and Berger , R.G. 1992 . Selective distribution of saturated fatty acids into the monoglyceride fraction during enzymatic glycerolysis . Journal of American Oil Chemists’ Society , 69 ( 11 ) : 1098 – 1103 .
- Sudraud , G. , Coustard , J.M. and Retho , C. 1981 . Analytical and structural study of some food emulsifiers by high performance liquid chromatography and off line mass spectrometry . Journal of Chromatography , 204 : 397 – 406 .
- Riaz , M.N. and Chaudhary , M.M. 2004 . Halal Food Production , 1 – 379 . Boca Raton, Florida : CRC Press .
- Indrasti , D. , Che Man , Y.B , Chin , S.T. , Mustafa , S. , Mat Hashim , D. and Abdul Manaf , M. 2010 . Regiospecific analysis of mono- and diglycerides in glycerolysis products by GC × GC-TOF-MS . Journal of American Oil Chemists’ Society , 87 ( 11 ) : 1255 – 1262 .
- Suman , M. , Silva , G. , Catellani , D. , Bersellini , U. , Caffarra , V. and Careri , M. 2009 . Determination of food emulsifiers in commercial additives and food products by liquid chromatography/atmospheric-pressure chemical ionisation mass spectrometry . Journal of Chromatography , 1216 : 3758 – 3766 .
- De Pedro , E. , Casillas , M. and Miranda , C.M. 1996 . Microwave oven application in the extraction of fat from the subcutaneous tissue of Iberian pig ham . Meat Science , 45 ( 1 ) : 45 – 51 .
- Sundaram , J. , Kandala , C. , Holser , R. , Butts , C. and Windham , W. 2010 . Determination of in-shell peanut oil and fatty acid composition using near-infrared reflectance spectroscopy . Journal of American Oil Chemists’ Society , 87 ( 10 ) : 1103 – 1114 .
- 2007 . “ Official Method and Recommended Practices of the American Oil Chemists’ Society ” . In AOCS , 6th , IL : AOCS Press: Champaign .
- Palm Oil Research Institute . 1995 . “ Palm Oil Research Institute of Malaysia, Ministry of Primary Industries ” . In PORIM Test Methods 72 – 100 . Kuala Lumpur , Malaysia
- Marikkar , J.M.N. and Ghazali , H.M. 2011 . Effect of Moringa oleifera oil blending on fractional crystallization behavior of palm oil . International Journal of Food Properties , 14 ( 5 ) : 1049 – 1059 .
- Moonen , H. and Bas , H. 2004 . “ Emulsifiers in Food Technology ” . In Mono- and diglycerides , Edited by: Whitehurst , R.J. 39 – 57 . Northampton , UK : Blackwell Publishing .
- Shin , E.C. , Craft , B.D. , Pegg , R.B. , Phillips , R.D. and Eitenmiller , R.R. 2011 . Chemometric approach to fatty acid profiles in runner-type peanut cultivars by principal component analysis (PCA) . Food Chemistry , 119 ( 3 ) : 1262 – 1270 .
- Kamal-Eldin , A. and Andersson , R. 1997 . A multivariate study of the correlation between tocopherol content and fatty acid composition in vegetable oils . Journal of American Oil Chemists’ Society , 74 ( 4 ) : 375 – 380 .