
Abstract
In this research, local citrus fruits, namely Garut citrus, were analyzed for electrical properties related to physicochemical properties. Electrical measurement on fruit was done by using low alternating current with a frequency varying from 50 Hz to 1 MHz. The fruits are placed between two plate electrodes and treated as dielectric material. Electrical parameters per unit of weight were used in this study to compensate variations in weight. Electrical impedance, resistance, and reactance per weight of citrus fruits will decrease if the frequency is increased. Electrical circuit models have been constructed to describe the internal conditions of citrus fruits. To indicate the fruit maturity, the physicochemical properties were used, i.e., firmness, total soluble solids, pH, and hydrogen ion concentration. The value of resistance, impedance, and reactance per weight declined during citrus fruits maturation. The correlations between electrical and physicochemical properties are investigated too. The highest consistency of correlations happens at a frequency of 1 MHz. Based on the model of an electrical circuit, the highest value of electrical resistance is outer shell and the lowest is seed. And then, the highest value of electrical capacitance is albedo and the lowest is segment. Resistance values of the parts of citrus fruits, i.e., seed, segment, segment wall, and outer shell, were decreased during maturation. While capacitance value of segment, albedo, and flavedo were increased.
INTRODUCTION
The purposes of this study are to analyze the electrical response of the citrus fruit using low voltage electrical signals that do not damage it, and to correlate its electrical parameters with physicochemical properties of citrus fruits. Citrus are known as local fruits, such as citrus of Garut. Differences in climate and environmental factors make the citrus grow in specific ways and have different qualities. Garut citrus had the highest population in the 1980s. However, the population declined sharply in the 1990s. The local government has increased its population by planting one million trees in 2011.[Citation1]
Fruit quality is generally determined by destructive methods. Therefore, it is necessary to explore the methods of non-destructive evaluation and testing in large quantities of Garut oranges. Measurement and interpretation of electrical properties gave the chance to solve the problem for non-destructive quality evaluation of Garut oranges. This method provides the opportunity for simple and quick assessment of product quality. Electrical properties of fruits, such as electrical impedance, resistance, and reactance, have also been investigated. Most of these investigations have again been directed towards establishing some relationships between electrical properties and some quality factor of the product.[Citation2] Furthermore, the electrical properties of the fruit are important in the cognitive aspect, especially to find out responses of the fruit to electric fields of variable frequency.
The electrical properties of a material or agricultural product depends on its microscopic or internal conditions, including mobility of ions or electrons, electrical polarity, electric dipole moment, chemical content, dielectric, water content, moisture content, acidity, and other internal properties. Interaction between microwaves and materials depends on their dielectric properties, which determine the extent of heating of a material when subjected to electromagnetic fields.[Citation3] Several important factors greatly influence the dielectric properties of materials. Some of these factors are related to the nature of the material (composition, structure), while others are associated with the conditions when electro heating is applied (temperature, frequency), and others are involved with the age or maturity stage of the food material.[Citation4] Majewska et al.[Citation5] reported that changes in the electrical properties of wheat grain significantly depended on the applied frequency of current, grain moisture, geometrical features, and wheat variety.
Electrical impedance spectroscopy (EIS) measures the dielectric properties of a medium as a function of frequency. It is based on the interaction of an external electric field with the electric dipole moment of materials.[Citation6] The dielectric properties of materials vary considerably with the frequency of the applied electric fields. The important phenomenon contributing to the frequency dependence of the dielectric properties is the polarization of molecules arising from the orientation with the imposed electric field. In foods, water is generally the predominant component. Moreover, the influence of water, or the content of salt and other minerals, depends to a large extent on the manner in which they are bound or restricted in their movement by other food components. The organic constituents of foods are dielectrically inert.[Citation4] EIS has been widely used to assess the in vivo conditions of animal and plant tissue because it is a rapid and easy method of measurement. In biological samples, the proportion of current passing though the apoplastic and symplastic spaces in tissue depends on the frequency.[Citation7]
In many reports, electrical parameters were used to measure the quality and properties of agricultural products. For example, correlation between ratios of capacitance and voltage differences with egg quality during storage,[Citation8] EIS and dielectric behavior of beef meat ageing,[Citation9,Citation10] effects of storage time on the beef meat dielectric constant using capacitance and conductance measurement,[Citation11] monitoring root growth of tomato using EIS analysis,[Citation12] monitoring of Willow root growth by a displacement and EIS methods,[Citation13,Citation14] electrical impedance of kiwi fruit during maturation[Citation15] and tomato ripening,[Citation16] electrical impedance studies of nectarines during cool storage and ripening.[Citation17] Also, EIS allows the opportunity to build electrical models of the measured material in the form of an electrical circuit of resistors and capacitors and analyze its response to source signals of variable amplitude and frequency.[Citation18,Citation19] The electrical impedance of citrus trees can be applied in models that describe their water requirements associated with transport mechanisms of xylem tissues.[Citation20,Citation21]
Banach et al.[Citation22] reported that the addition of water to milk resulted in decreasing electrical admittance and conductance, as well as increasing impedance and resistance, which indicated deterioration of electrical conductivity of milk with the increase of its dilution with water. Kato[Citation23] proposed a new electrical method for density sorting of spherical fruits by measuring volume using electric capacitance and mass using electronic balance. They also investigated the relationship between density and internal qualities of watermelons by low cost electronic instruments, and stated that soluble solids content (SSC) of watermelons could be estimated from density and mass by multiple regression analysis. Soltani et al.[Citation24] developed a low cost device for predicting the ripeness level of banana fruit using a capacitive sensing system. This unit estimates the ripeness level of bananas by its dielectric constant. The designed system can predict the ripeness level of banana fruit reliably.
MATERIALS AND METHODS
Materials
The experiment was carried out on the 48 samples of Garut citrus. The fruits were taken from Samarang village, Garut (7° 13′ S 107 °54′ E), in Indonesia. Fruits were picked during ambient temperature in the morning. The measurements of all parameters were done when the fruits were still in fresh condition (healthy fruit and less than 24 h after harvesting). The fruit was cleaned by using wet tissue. The fruit is maintained in intact condition during the measurement of electrical parameters.
Physicochemical Analysis
Total soluble solids (TSS) were quantified by using refractometer (GMK 701R, G-WON HITECH Co, Korea). Acidity was determined using a pH meter (YSI EcoSense pH 100, Xylem Inc., USA). The citrus weight was measured by using an electronic balance with an accuracy of 0.01 g (Sartorius ED 822, Goettingen, Germany). Firmness is the ability to withstand compression elastic. Firmness unit equal to the pressure unit.[Citation25] Firmness unit can be expressed in units of force if the surface area and penetrating depth of the sensor is made constant, this was stated by previous researchers.[Citation26,Citation27] The firmness of citrus was measured by using force sensor (CI-6746, PASCO). The probe diameter of force sensor is 10 mm. Penetration depth of the force sensor on fruits is made constant level of 5 mm.
Electrical Measurements
Electrical parameters of citrus fruits were measured by using LCR meter (3532-50 LCR HiTESTER, Hioki, Tokyo, Japan). These parameters are electrical impedance, resistance, and reactance. The system measurements were made with two parallel plates separated by 0.065 m. The surface of the electrodes was 0.012 m2. An intact citrus is placed between two electrodes. The capacitor is thereby formed by a combination of air and fruit intact as the dielectric.[Citation28] The conductive plates selected from copper material because of its consistency which would not be easily ionized as a factor that will ruin the measurement using capacitive properties. Both electrodes were connected to LCR meter. The parameter values of electricity were measured within a frequency of 50 Hz to 1 MHz at 100 frequency points. To avoid the citrus being damaged, the amplitude of electrical signals should be low. Therefore, the input voltage of the signal was 1 volt (rms). Each measurement of different shoots was repeated three times and then the average is calculated.
When fruit is considered as the dielectric material, the problem is complicated by the irregular shape of the fruit. The obvious disadvantage to this method is that the fruits weight or geometry (dimensions) will not be the same for all samples. The fruits geometry or dimension is one variable for which compensation could not easily be provided. In this investigation, the measured electrical quantity was divided by the weight of citrus fruits to obtain a value of electricity per unit of weight in an attempt to compensate for these variations. It has also been done by Zachariah and Erickson[Citation29] in assessing the maturity of avocado fruits with a capacitance per weight measurement.
Electrical Models Analysis
Equivalent electrical circuits were used to predict the electrical properties of citrus fruits. Basic modeling of the electrical circuit was based on the model with kiwi fruit[Citation15] which was adopted from Zhang’s model,[Citation30] and eggplant,[Citation6] which was adopted from Hayden’s model.[Citation31] The citrus models shown on . The equivalent circuit models for plant tissue such as kiwi fruit, potatoes, or eggplant were presented in and . Model (a) proposed by Hayden[Citation6,Citation31] takes account of the resistance of cell walls (R4 in model (a)), the cytoplasmic resistance including vacuole (R3 in model (a)), and the capacitance of cell membrane (C3 in model (a)). Zhang[Citation6,Citation30] suggested that the capacitance of the tonoplast (C2 in model (b)) and the interior resistance of the vacuole (R2 in model (b)) contributed substantially to the total impedance, and should be added as independent elements in the equivalent circuit (in parallel with symplastic resistance R3 in model (b)).
Figure 1 Development model of electrical equivalent circuit for Garut citrus from the previous models: (a) lumped model of Hayden, (b) lumped model of Zhang, and (c) new model designed and cross section of citrus fruit.
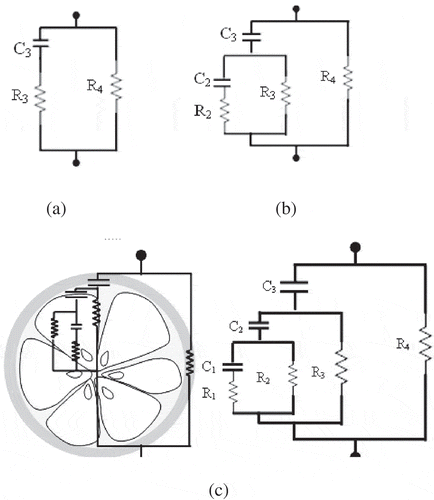
The internal structure of citrus fruit is more complicated than kiwi fruit, potatoes or eggplant. The model developed for citrus fruit consists of tissue resistance (in model (c): seed, R1; segment, R2; segment wall, R3; and outer shell, R4) and membrane capacitance (in model (c): segment, C1; albedo, C2; and flavedo, C3). By considering the structure of citrus fruits, the seeds resistance connected in series with the capacitance of segment. In the segment, there is also resistance. This resistance is connected in parallel with resistance of seeds and capacitance of the segment. Furthermore, the circuit is connected in parallel with the membrane capacitance of albedo and connected in series with the resistance of the segment wall. On the next construction there are flavedo and the outer shell. In the final stage, the circuit is connected in series with the membrane capacitance of flavedo, and parallel with the resistance of the outer shell. Finally, the construction of the electrical circuit for citrus model is shown in . Furthermore, the equation of the electrical parameters from the citrus model is derived in order to get equivalent resistance, reactance, and impedance. The results of equations were correlated with results of experimental data.
Statistical Analysis
Increasing maturity of the citrus fruit was indicated by declining in its acidity. Thus, fruits are divided into 16 groups based on the level of acidity. Each group consists of three oranges as replicates. Thus, the total is 48 samples of Garut citrus fruits. For electrical modeling, all data were subjected to regression analysis using the Microsoft Excel program (Version 2007). In this study, the correlation between electrical properties and physicochemical properties of fruits using trend line of Excel program was also examined. For multiple linear regressions between physicochemical properties and electrical properties, all data were computed using a statistical package (SPSS 10.0 Program). Statistical analysis of coefficients of regression equation and predicted values was also carried out. The accuracy and error value of estimation of this technique are also calculated for determining the best correlation between electrical and physicochemical parameters of Garut citrus.
RESULTS AND DISCUSSIONS
The Electrical Properties of Garut Citrus Fruits at Various Frequencies
Any electrode–material system in a measuring cell has a geometrical capacitance and a bulk resistance in parallel with it. Electrical impedance (Z) defined by a complex quantity in terms of resistive (R) and capacitive (C) components as , where
and
. It is only real when ω = 0 and thus
, that is, for purely resistive behavior. In this case the impedance is completely frequency-independent. When
is found to be a variable function of frequency (
) which holistically connect real and imaginary parts with each other, ensure that
cannot be zero over all frequencies but must vary with frequency as well.[Citation32] This phenomenon occurred in Garut citrus.
The experimental results for the electrical resistance per weight of Garut citrus fruits as a function of signal frequency are shown in . All samples of the citrus have the same phenomenon when the frequency is varied. Citrus fruit resistance value at low frequencies is very large, i.e., in order 0.1 mega ohm. This indicates that the citrus has resistive properties at low frequencies, so it is more insulator or a poor conductor especially at low frequencies.
Figure 2 Experimental results for electrical spectroscopy of (a) resistance, (b) reactance, and (c) impedance per weight of Garut citrus fruit. Selected sample at pH: (•) 2.86, (×) 3.15, (▴) 3.34, (□) 3.96, (○) 4.15, (+) 4.18, and (Δ) 4.6.
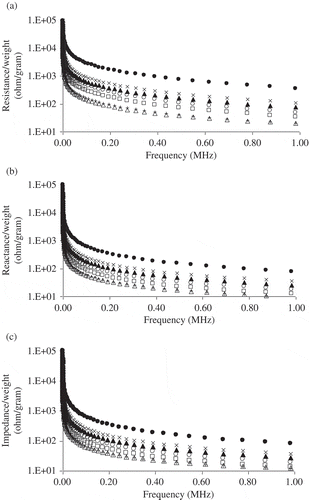
Electrical resistance values of citrus were decreased when the frequency was increased. Increased frequency of the external signal will increase the rate of electric charge movement in Garut citrus. Thus, that resistance of citrus will decrease. If the frequency is enlarged, the rate of changing direction in the external circuit will be large. This is the external condition of the electrical signal that will affect the internal conditions of Garut citrus, especially on the mobility of electric charge. Ionic conduction was the dominant mechanism for dielectric dispersion such as in eggs at frequencies lower than 200 MHz[Citation33] and in mangoes at frequencies until 300 MHz.[Citation34] At lower frequencies, most of the current flows around the cells without being able to penetrate them, while at higher frequencies the membranes lose their insulating properties and the current flows through both the extracellular and intracellular compartments.[Citation10]
The dependence of dielectric parameters to the frequency have been examined by plotting curves between reactance per weight with frequency on . It was found that the electrical reactance decreased with frequency increased, which exhibits the dielectric dispersion in the orange fruit. High values of reactance at low frequency (<0.1 MHz) could be attributed to high mobility of dipole due to free water state and electrode polarization. Frequency changes will affect the condition of the ions in the material. Ionic loss is inversely proportional to frequency and become critical as it moves to the lower frequency. Dissipation of dipolar energy at higher frequencies is less dominant and ionic loss become almost absent.[Citation35]
If the frequency is increased, then the value of electrical impedance per weight of citrus fruits decreased. This is clearly seen in . It shows the same phenomenon with resistance and reactance per weight. Electrical impedance acts as an obstacle to the flow of electric charges or alternating current that occurs in citrus. Magnitude of electrical impedance in the circuit is influenced by the frequency, resistance, and reactance. At low frequencies the reactance will be large, so that its impedance will be large too. When the frequency is increased, the reactance will decrease. This correlates with a decreasing in impedance. Impedance value is the total resistance of alternating current. Impedance values correlated with the conductance and capacitance as a function of frequency. Capacitive reactance is the imaginary impedance and its value is inversely proportional to the multiplication of capacitance and frequency, while the conductance is inversely proportional to resistance. Based on , when the frequency increases, the resistance and reactance were decreased. This would correlate with a decrease in impedance. Both resistance and reactance phenomenon would strengthen the mutual impedance values. If the frequency is low, the charges, dipoles can follow the change of alternating electrical field causing relative high impedance, but if the frequency is high, the dipoles are not able to follow the changes electric field, they become transparent for electrical field and the impedance decrease. Overall, the impedance will decrease if the frequency is increased.[Citation32]
Electrical Circuit Modeling for Internal Condition of Garut Citrus Fruits
There are several equivalent circuits that may result in a good fit for a given data, and it is necessary to select the model that provides the best and most realistic representation of the sample. The choice should be based on the simplicity and consistency of the system’s properties and also on whether the circuit elements are connected in series or in parallel.[Citation12] Based on experimental data of impedance, reactance, and resistance per weight of citrus fruits, we conducted the models of electrical circuit in order to study the phenomenon of internal electrical fruit. The models are consisting of combined resistors–capacitors. Basic modeling of the electrical circuit was based on the model of Zhang[Citation4] with kiwi fruit,[Citation15] and Hayden’s model[Citation31] with potato and eggplant models[Citation6] as shown in and . The internal structure of citrus fruit is more complicated than kiwi fruit, potatoes or eggplant. So the existing models should be improved and adapted to the internal condition of citrus fruits. The new model was created based on the constituent parts of the orange fruit as shown in .
The equation for equivalent resistance, reactance and impedance as a function of angular frequency (ω) can be derived from the electrical circuit in . The equivalent resistance (Req) and reactance (Xeq) of circuit model have shown in Eqs. (1) and (2). An equivalent impedance equation (Zeq) as shown in Eq. (3) was obtained from the Eqs. (1) and (2). In those equations, an additional symbol was made, namely a, b, c, and d. This is done only to shorten the writing of equations.
Table 1 The values of electrical component used for electrical circuit modeling of Garut citrus at selected pH
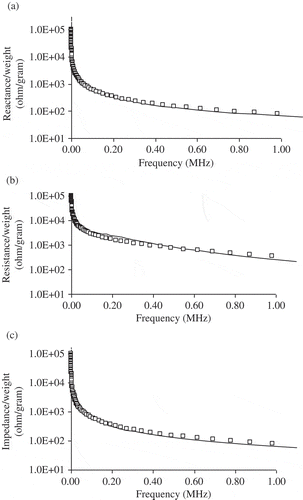
Figure 3 The differences between experimental results (□) and modeling (—) for electrical spectroscopy of Garut citrus at pH 2.86: (a) reactance per weight, (b) resistance per weight, and (c) impedance per weight.
The value for each resistor of outer shell, segment, and segment wall as shown in are large enough. This is possible because of the prosentase of volume are relatively large. This differs from the seeds of citrus. Resistance of seeds have a relatively small value because the size is very small and very small amounts in the fruit. The outer shell is the largest resistance value. This is in accordance with the internal condition of the fruit, where the outer shell is large enough component of the fruit and less of water content. In plant tissues, the resistance of an extracellular pathway should be high because of the small cross-sectional area of the wall and the low concentration of mobile ions.[Citation26]
The smallest value of capacitance is the segment capacitance. This is possible because the segment is composed of many parts of juice sacs membrane that arranged in series. The resistance value is quite large even though a lot of water content. Although the segment was a lot of water content, but the water was in a sealed condition. Most fresh fruits and vegetables are high in water, but normally have very poor electrical conductivity because much of the water is held immobile, trapped within the cells and the intercellular spaces within the tissue structure of these plant materials.[Citation25]
The level of compatibility between the modeling and experimental results are confirmed too by using the deterministic coefficients of linear regression as shown in . The linear correlation between modeling and experimental results for the resistance, reactance and impedance per weight of citrus are large enough (R2 > 0.777). Resistance per weight for the sample at pH 2.86 has the smallest deterministic coefficients (R2 = 0.777). However, it is still accepted by looking at the .
Table 2 Deterministic coefficients of linear correlation between model and experiment results for electrical spectroscopy (50Hz–1 MHz) of Garut citrus at various acidity
The model has given us an illustration of the internal condition of the fruit when the maturation process (). They showed that the capacitance value of flavedo, albedo, and segment have increased, while the resistance value of the outer shell, seeds, segment, and segment wall decreased during the ripening process. This provides an understanding of changes in membrane capacitance and resistance of the cytoplasm during maturation.[Citation17] In addition, changes in permeability of membranes and other structures may also occur.
The Relationship Between Electrical and Physicochemical Properties
Maturity parameters of citrus fruits were indicated by changes in the physicochemical properties of the fruit. Citrus fruits are non-climacteric, they ripen on the tree. They do not ripen after harvest and do not show any respiratory rise accompanied by major changes in flavor and biochemical composition after harvest in relation to ripening.[Citation36] Immature fruit is usually coarse and very acidic or tart and has an internal texture that is coarse. Physicochemical parameters for 16 sample groups of Garut citrus fruits shown in . In this study, the maturity of citrus fruit is characterized by pH value. Increasing maturity of the fruit is accompanied by increasing its pH value. When pH of sample increases, the firmness value decreases () and TSS increase (). The pH of citrus juices also provides an idea about the acidity of fruit, and it could be one way of expressing acidity. Juice pH is a hydrogen ion concentration and provides an estimate of the extent of acidity in the juice.[Citation36] When concentration of hydrogen-ion increases, the firmness value increases () and TSS decrease (). In other words, decreasing the acidity of fruit marked with decreasing concentration of hydrogen ions, accompanied by a decrease in firmness and increase in TSS of fruit. It was a stage when the fruit has increased maturity.
Figure 4 Physicochemical properties of Garut citrus at various acidity: (a) total soluble solids (TSS), (b) firmness, and (c) ratio of TSS to acidity.
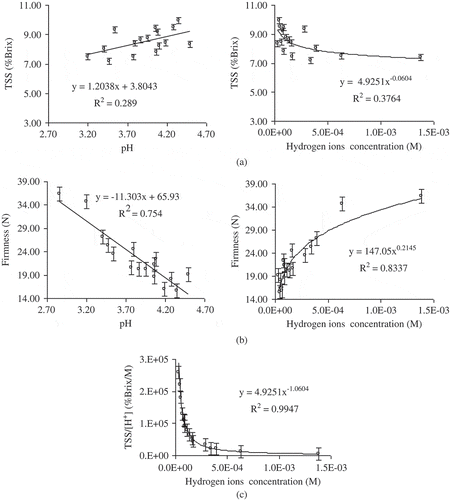
The correlation between the acidity and the TSS is not as strong. Its deterministic coefficient value is small (R2 < 0.38). However, the correlation with the firmness has a better correlation. During normal fruit ripening, firmness declines and the melting texture characteristic of fruit develops because of changes in cell wall composition and cell wall hydration.[Citation26] Cell wall polysaccharides and their composition also contribute to fruit firmness. The sugar concentration of cellulose in a soft rind fruit was lower than a firm rind fruit. The concentration of cell wall polysaccharides in flavedo tissue decreased with fruit rind softening. In flavedo tissue, sugar concentration was highest in cellulose. Mature fruit with firm rind had higher sugar levels in the EDTA and cellulose fractions of the flavedo tissue than did soft rind fruit.[Citation27]
The decrease in acidity was considered to be due to dilution as the fruit increased in size and in juice content. Organic acids are respiratory substrates in the fruit. Higher respiratory quotient (CO2 produced/O2 consumed) indicates utilization of acids, mainly citric and malic acids through the TCA (tricarboxylic acid) cycle, in which acids are oxidized and ATPs are formed for synthesis of new compounds. Several metabolites are formed during the process.[Citation36]
As in most of the fruits, the maturity of citrus heralds the accumulation of sugars and the loss of acidity and host of other biochemical changes. A decrease in the concentration of acid with the gradual increase in the ratio of TSS to acidity determines the legal maturity of the fruit as well as their palatability.[Citation36] This phenomenon is shown in . In this case, the hydrogen ion concentration is used as an indication of acidity. This is done because the hydrogen ion concentration was positively correlated with the level of acidity and the pH is negatively correlated with the acidity. The correlation between hydrogen ion concentration and ratio of TSS to hydrogen ion concentration has a very strong correlation (R2 = 0.9947). Correlation shows a power equation form. This is quite suitable for explaining and supporting that literature.
The correlation between electrical properties and fruit maturity of citrus are also reviewed in this research. In this case, the parameters of fruit maturity are represented by its physicochemical parameters, i.e., acidity (pH and hydrogen ion concentration), firmness, TSS, and ratio of TSS to hydrogen ion concentration. The electrical resistance values were varied with frequency. The correlation between resistance and fruit maturity for several frequencies shown in . Overall, the highest consistency of the deterministic coefficient occurred at a frequency of 1 MHz. Correlation equations and graph plots between the electrical resistance per weight and the physicochemical properties of citrus fruit at that frequency are shown in and . The electrical resistance showed significant changes in the acidity, firmness and ratio of TSS to hydrogen ion concentration. Although the correlation between the acidity and the TSS is quite weak, it can be accepted as an order of fruit in general. So, the correlation of the electrical properties and this parameter is still observed (). It also has a low coefficient of determination
Table 3 Correlation equations between electrical resistance per weight and physicochemical parameters of Garut citrus at selected frequencies
Figure 5 Resistance per weight plots with physicochemical of Garut citrus at frequency of 1 MHz: (a) acidity, (b) firmness, (c) TSS, and (d) ratio TSS to acidity.
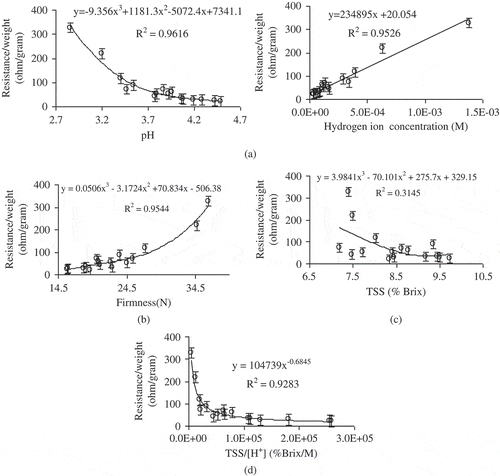
Resistance per weight of citrus fruits declined as freshly harvested fruit ripened, and this decline was closely related to changes in pH of fruits. The correlation did not show as linear, while its correlation with the hydrogen ion concentration was quite linear (). Electrical resistance showed significant changes as the fruit matured.[Citation29] Increasing maturity of the citrus fruit will cause the acidity is reduce and pH is increase. The high total acid correlated with low pH or high concentration of hydrogen ions. Also, increased maturity of the citrus fruit affects the decrease in the resistance value of the fruit. Decrease in resistance is also correlated with the other maturity parameters, namely the decrease in firmness and an increase in TSS ( and ). In addition, the correlation with the parameters of ratio of TSS to acid also showed a strong correlation (). When the ratio of TSS to acids enlarges the resistance value decreases. This indicates an increase in fruit maturity. A decrease in fruit resistance may be related to increased concentration of mobile ions in cell wall and/or increase in cross-section of the cell wall accessible to low-frequency current. Cell wall resistance declined as freshly harvested fruit ripened, and this decline was closely related to changes in fruit texture.[Citation26]
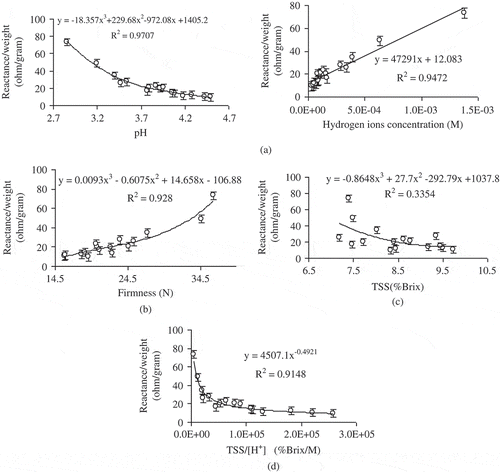
Correlation equations and graph plots between the electrical reactance per weight and the physicochemical properties of citrus fruit at selected frequencies are shown in and . Decline in the value of the reactance per weight at fruit maturation, has similarities in profile with the resistance per weight of fruit. During ripening, extensive changes may occur in the cell wall, membranes, and the composition of the cell contents. All of these changes would affect the capacitance of the tissues.[Citation37] Changes in capacitance can be expressed in a change of reactance.
Table 4 Correlation equations between electrical reactance per weight and physicochemical parameters of Garut citrus at selected frequencies
Figure 6 Reactance per weight plots with physicochemical of Garut citrus at frequency of 1 MHz: (a) acidity, (b) firmness, (c) TSS, and (d) ratio TSS to acidity.
Changes in resistance and reactance parameters will result in a change in impedance values. So, its association with the physicochemical properties will have similarities. This is shown in and . Decline in the value of resistance and reactance during citrus fruits maturation will also reduce the value of its impedance. Electrical impedance values decrease when increasing fruit ripeness. Generally, increasing fruit maturity will increase the juice content. This could mean that the increase in fruit juice content causes a decrease in the value of electrical impedance.[Citation38] This study will be completed by connecting the electrical parameters associated with the physicochemical parameters simultaneously. In this case, the SPSS program was used for multiple linear regressions. Based on the electrical properties in –, the selected frequency of electrical parameters was 1 MHz. Multiple linear regression equation for the electrical parameters of the citrus fruits are shown in Eqs. (4)–(6). The values of physicochemical parameters of citrus were independent variables, whilst the percentage quantities of electrical parameters were dependent variable. The deterministic coefficients (R2) of those equations are, respectively, 0.968, 0.976, and 0.977.
Table 5 Correlation equations between electrical impedance per weight and physicochemical parameters of Garut citrus at selected frequencies
Figure 7 Impedance per weight plots with physicochemical of Garut citrus at frequency of 1 MHz: (a) acidity, (b) firmness, (c) TSS, and (d) ratio TSS to acidity.
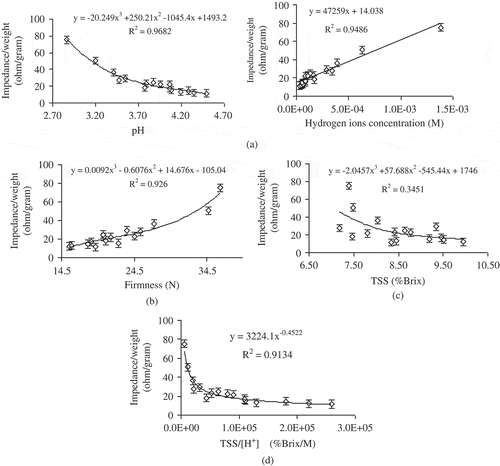
Figure 8 The linearity between predictions values and experiments for (a) impedance/weight and (b) pH value of Garut citrus.
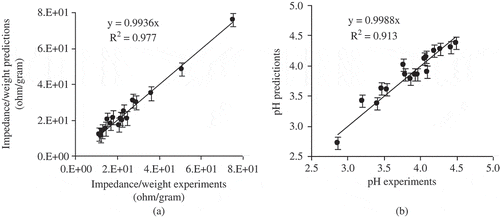
Also, the electrical parameters can be correlated with physicochemical of Garut citrus fruit based on physicochemical parameters as dependence variable and electrical parameters as an independent variable. Multiple linear regression equations for the physicochemical parameters of the citrus fruits are shown in equation 7, 8, 9, 10, and 11. The deterministic coefficients (R2) of those equations are respectively 0.96, 0.74, 0.33, 0.913, and 0.874. The standard errors of estimation for those equations are respectively 7.39E-05, 4.44E + 04, 0.7376, 0.143, and 2.697.
Finally, the equations for impedance prediction and pH prediction as dependence variable in multiple regressions can be used as a reference to the correlation between electrical properties and the physicochemical properties of Garut citrus fruit for the next post-harvest handling.
CONCLUSIONS
The electrical impedance, resistance, and reactance per weight of Garut citrus were decreased if frequency was inclined. The value of resistance, impedance, and reactance per weight were declined during citrus fruits maturation. Based on the model of an electric circuit, the resistance value of seeds, segment, segment wall, and outer shell were decreased during fruits maturation, while capacitance of segment, albedo, and flavedo were increased. Resistance, reactance, and impedance per weight of fruit change significantly at selected frequency during the maturation of citrus fruit. The proposed electrical model can describe the internal conditions of citrus fruit without damaging the fruit. The model has given an illustration of changes in membrane capacitance and resistance of the cytoplasm during fruit ripening. Electrical parameters have potential in the non-destructive measurement of citrus quality. The correlation of the electrical properties of food products with their functional properties is a fine method for the quality control of citrus. However, this article does not examine the contents of toxic or biologically active substances associated with the electrical properties of citrus. In the future, this fact should be taken into account when this method is proposed as a standard control of the quality of fruits.
REFERENCES
- The government of garut regency. 2010. www.Garutkab.goid/download_files/article/Sejutapohon2.pdf(accessed on December 2011)
- Mohsenin, N.N. Electromagnetic Radiation Properties of Foods and Agricultural Products, Gordon and Breach Science Publishers: New York, 1984, pp. 672.
- Kumar, P.; Coronel, P.; Simunovic, J.; Truong, V.D.; Sandeep, K.P. Measurement of dielectric properties of pumpable food materials under static and continuous flow conditions. Journal of Food Science 2007, 72 (4), E177–E183.
- Sosa-Morales, M.E.; Valerio-Junco, L.; López-Malo, A.; García, H.S. Dielectric properties of foods: reported data in the 21st century and their potential applications, LWT-Food Science and Technology 2010, 43, 1169–1179.
- Majewska, K.M.; Banach, J.K.; Zywica, R.; Białobrzeski, I. Influence of variety, moisture content, kernel size, and applied current frequency on the electric properties of wheat grain. International Journal of Food Properties 2008, 11, 392–406.
- Wu, L.; Ogawa, Y.; Tagawa, A. Electrical impedance spectroscopy analysis of eggplant pulp and effects of drying and freezing–thawing treatments on its impedance characteristics. Journal of Food Engineering 2008, 87, 274–280.
- Mizukami, Y.; Yamada, K.; Sawai, Y.; Yamaguchi, Y. Measurement of fresh tea leaf growth using electrical impedance spectroscopy. Agricultural Journal 2007, 2 (1), 134–139.
- Ragni, L.; Gradari, P.; Berardinelli, A.; Giunchi, A.; Guarnieri, A. Predicting quality parameters of shell eggs using a simple technique based on the dielectric properties. Biosystems Engineering 2006, 94 (2), 255–262.
- Damez, J.L.; Clerjon, S.; Abouelkaram, S. The use of electrical impedance spectroscopy to mesostructure assessed by alternating current spectroscopy during meat ageing. Proceedings of the 51 International Congress of Meat Science and Technology 7–12 August 2005, Baltimore, MD, USA; 2005; 327–330.
- Damez, J.L.; Clerjon, S.; Abouelkaram, S.; Lepetit, J. Dielectric behavior of beef meat in the 1-1500 kHz range: Simulation with the Fricke/Cole-Cole model. Meat Science 2007, 77, 512–519.
- Ghatass, Z.F.; Soliman, M.M.; Mohamed, M.M. Dielectric technique for quality control of beef meat in the range 10 kHz - 1 MHz. American-Eurasian Journal of Scientific Research 2008, 3 (1), 62–69.
- Ozier-Lafontaine, H.; Bajazet, T. Analysis of root growth by impedance spectroscopy (EIS). Plant and Soil 2005, 277, 299–313.
- Repo, T.; Laukkanen, J.; Silvennoinen, R. Measurement of the tree root growth using electrical impedance spectroscopy. Silva Fennica 2005, 39 (2), 159–166.
- Cao, Y.; Repo, T.; Silvennoinen, R.; Lehto, T.; Pelkonen, P. Analysis of the willow root system by electrical impedance spectroscopy. Journal of Experimental Botany 2011, 62, 351–358.
- Bauchot, A.D.; Harker, F.R.; Arnold, W.M. The use of electrical impedance spectroscopy to assess the physiological condition of kiwifruit. Postharvest Biology and Technology 2000, 18, 9–18.
- Varlan, A.R.; Sansen, W. Nondestructive electrical impedance analysis in fruit: normal ripening and injuries characterization. Electro- and Magnetobiology 1996, 15, 213–227.
- Harker, F.R.; Dunlop, J. Electrical impedance studies of nectarines during cool storage and fruit ripening. Postharvest Biology and Technology 1994, 4 (1–2), 125–134.
- Vozáry, E.; Benkő, P. Non-destructive determination of impedance spectrum of fruit flesh under the skin. Journal of Physics: Conference Series 2010, 224, Paper no. 012142.
- Elwakil, A.S.; Maundy, B. Extracting the cole-cole impedance model parameters without direct impedance measurement. Electronics Letters 2010, 46 (20), 1367–1368.
- Muramatsu, N.; Hiraoka, K.; Takishita, F. Electrical impedance analysis for detecting water stress on Satsuma mandarin trees ( in Japan). Japanese Journal of Soil Science and Plant Nutrition 2006, 77, 77–81.
- Muramatsu, N.; Hiraoka, K. Water status detection of Satsuma mandarin (citrus unshiu Marc) trees using an electrical impedance method. Environment Control in Biology 2007, 45 (1), 1–7.
- Banach, J.K.; Zywica, R.; Szpendowski, J.; Kiełczewska, K. Possibilities of using electrical parameters of milk for assessing its adulteration with water. International Journal of Food Properties 2012, 15 (2), 274–280.
- Kato, K. Electrical density sorting and estimation of soluble solids content of watermelon. Journal of Agricultural Engineering Research 1997, 67, 161–170.
- Soltani, M.; Alimardani, R.; Omid, M. Evaluating banana ripening status from measuring dielectric properties. Journal of Food Engineering 2011, 105, 625–631.
- Figura, L.O.; Teixeira, A.A. Food Physics, Springer–Verlag: Berlin Heidelberg, Germany, 2007, pp. 550.
- Harker, F.R.; Maindonald, J.H. Ripening of nectarine fruit: Changes in the cell wall, vacuole, and membranes detected using electrical impedance measurements. Plant Physiology 1994, 106, 165–171.
- Muramatsu, N.; Takahara, T.; Ogata, T.; Kojima, K. Changes in rind firmness and cell wall polysaccharides during citrus fruit development and maturation. HortScience 1999, 34, 79–81.
- Soltani, M.; Alimardani, R.; Omid, M. Prediction of banana quality during ripening stage using capacitance sensing system, Australian Journal of Crop Science 2010, 4 (6), 443–447.
- Zachariah, G.; Erickson, L.C. Evaluation of some physical methods for determining avocado maturity. California Avocado Society 1965, Yearbook 49, 110–115.
- Zhang, M.I.N.; Stout, D.G.; Willison, J.H.M.; Electrical impedance analysis in plant tissues: Symplasmic resistance and membrane capacitance in the Hayden model. Journal of Experimental Botany 1990, 41 (224), 371–380.
- Hayden, R.I.; Moyse, C.A.; Calder, F.W.; Crawford, D.P.; Fensom, D.S. Electrical impedance studies on potato and alfalfa tissue. Journal of Experimental Botany 1969, 20 (63), 177–200.
- Barsoukov, E.; Macdonald, J.R. Impedance Spectroscopy: Theory, Experiment, and Applications, John Wiley and Sons Inc.: USA, 2005, pp. 606.
- Ragni, L.; Al-Shami, A.; Mikhaylenko, G.; Tang, J. Dielectric characterization of hen eggs during storage. Journal of Food Engineering 2007, 82, 450–459.
- Sosa-Morales, M.E.; Tiwari, G.; Wang, S.; Tang, J.; López-Malo, A.; García, H.S. Dielectric heating as a potential post-harvest treatment of disinfesting mangoes I: Relation between dielectric properties and ripening. Biosystems Engineering 2009, 103, 297–303.
- Singh, S.P.; Kumar, P.; Manohar, R.; Shukla, J.P. Dielectric properties of some oil seeds at different concentration of moisture contents and micro-fertilizer. International Journal of Agricultural Research 2010, 5 (8), 678–689.
- Ladaniya, M.S.; Citrus Fruit, Biology, Technology and Evaluation, Elsevier Inc.: USA, 2008, pp. 574.
- Bean, R.C.; Rasor, J.P.; Porter, G.G. Changes in electrical characteristics of avocados during ripening. California Avocado Society 1960, Yearbook 44, 75–78.
- Pierzynowska-Korniak, G.; Zywica, R.; Wójcik, J. Electric properties of apple purée and pulpy apple juices. European Food Research and Technology 2003, 216 (5), 385–389.