
Abstract
Aquacultured green shelled mussels are an important export product of New Zealand. Using image analysis, several geometrical attributes of live mussels were measured. The volume of individual live mussels was estimated by several methods. When the cubic splines method was applied to top and side view images, volume was estimated with a coefficient of determination of R2 = 0.97. When only the top view area was used, the R2 decreased to 0.94. When the side view area was also included and empirical equations were fitted to estimate whole volume, the R2 was 0.97. When measured length, width, and thickness were used to estimate volume, the R2 was 0.95. There was a wide variation of the measured density of live mussels (1.05–1.27 g/cm3). Also, the condition index of the live mussels varied between 48 and 95. There was no correlation between the size of the mussel and its condition index. The mass of the mussel meat could not be accurately predicted by using the whole mass of the live mussel.
INTRODUCTION
The first operation in the processing of mussels is to open it, either to extract the meat, or to have the product in the form of a “half-shell” mussel. Shucking can be accomplished manually on live mussels, mechanically on live or heat treated mussels,[Citation1] by heating, or by applying ultra-high pressure.[Citation2Citation−Citation4] In mechanically shucking the mussel, a machine vision system and a laser scanner was used to orient the whole shell.[Citation1] Therefore the visual characterization of the mussel shell is important. One attribute of the whole mussel is its volume. Some shellfish are traditionally sold “by the bushel” (by volume). The volume of shellfish can be measured experimentally (by the Archimedes principle); a laser scanner can be used to calculate the volume; or the visual characteristics such as length, width, or view area can be measured and correlated by volume. Alternatively, image analysis with the application of the cubic spline method can be used to estimate the volume. The cubic spline method was used to estimate the liver volume from computerized tomography (CT) images.[Citation5] Liu[Citation6] used cubic spline approximation to estimate the volume of logs. The volume of oysters was calculated with good accuracy using the cubic spline method.[Citation7] The same method was used for the estimation of the volume of whole Alaska Pollock.[Citation8] Other methods of volume measurement for different food products can be found in the literature.[Citation9,Citation10]
Many easily measurable geometric properties of mussels can be correlated with volume. These include:
The length (L), width (W), and thickness (T) of the mussel. These can be multiplied together and this new variable can be correlated with volume:
Another option is to use them separately, for example:
Since a mussel can have four directions to measure view area (two from the sides S1 and S2, and two from the thickness direction T1 and T2) these can be used separately or in combination to estimate volume. Alternatively, the cubic spline method[Citation7] can be used to estimate cross-sectional areas along the length of the mussel, and the integration of these will give an estimate of the volume. The estimation of the cross-sectional areas can be accomplished by image analysis. The objective of this study was to apply different methods to estimate the volume of whole mussels. Image analysis was used to measure several geometric parameters of the mussels, and different equations were fitted to different combinations of these parameters to estimate volume. The combination of these geometric properties such as perimeter and view area has not been used to estimate the volume before. The cubic spline method was also used. Finally, the meat yield (as mass) of the mussel was correlated to the whole mass of the mussel as a measure of its condition index.
MATERIALS AND METHODS
Mussels
Live green lipped mussels (Perna canaliculus, Gmelin, 1791) were purchased from a local fish market in Auckland, New Zealand. The mussels were selected to have as wide a range of size as possible. The average weight of the live mussels were 60.1 g with a range of 33.9 to 93.2 g. They were immediately transported to the University of Auckland laboratory in seawater. A total of 35 mussels were processed.
Weighing and Measurement of Volume
It is important that the mussel is live, and full of water. Gaping mussels will give wrong results. The live mussels were first weighed by using a balance (Sartorius Extend Model ED3202S-CW, Bradford, MA, USA). Then, each mussel was suspended by a fine fishing line, immersed in distilled water, and weighed again by using a balance (Mettler Toledo AX203, Greifensee, Switzerland) with the density accessory kit attached.
The density of air (0.0012 g/cm3) was neglected. The density of water at room temperature was taken as 0.9976 g/cm3. The live mussels were then placed in a light box to obtain their pictures (see below). Finally, the mussels were shucked by hand. The shells and meat were weighed individually. The condition index of live mussels was calculated as:
Since live mussels contain water, whole weight = shell weight + meat weight + water weight. The combined weight of the water in the cavity plus the meat is compared with the weight of the meat only.
Image Acquisition
The live mussels were placed in the light box of a machine vision system developed in the lab.[Citation11] A Nikon D300 digital camera (Nikon Corp., Tokyo, Japan) with an 18–200 mm zoom Nikkor lens was used to capture images. The camera settings are shown in . The mussel was first placed in the light box on its side (called bottom side S1 thereafter, see ), on a small piece of soft, non-hardening modeling material (“silly putty,” Codiform, Mungvo Co., Susan, Korea) to control its horizontal angle. A 4 × 4 cm thin, black metallic square was also placed near the mussel as a size reference. After the picture was taken, the mussel was turned to its other side (called the top side S2 thereafter), and the procedure was repeated. Next, the mussel was turned to its side so that its thickness was facing up (bottom picture in ). This was called side T1. The modeling material was used to keep the mussel vertical. After the picture was taken, the mussel was turned to its other side (called T2 thereafter) and the process was repeated. Four images of each mussel were taken this way.
Table 1 The Nikon D300 camera control settings for back-lighting images
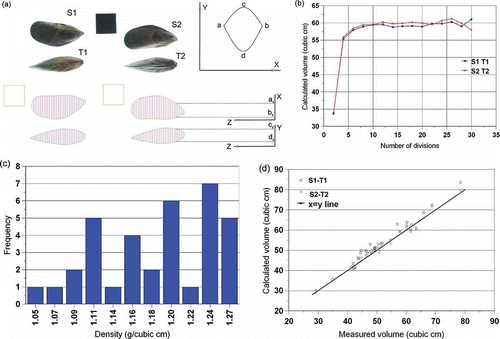
Figure 1 (a) Volume calculation by the cubic spline method. The black square is the size reference (4 cm × 4 cm). The divisions of the mussels, and the coordinates used to calculate the cross sectional areas (Eq. (5)) are shown. (b) The change of the total calculated volume of a mussel as affected by the number of divisions. After about 16 divisions, the calculated volume stabilizes. The volume of the same mussel, calculated based on two different images are also displayed. (c) Distribution of the calculated density frequency of the mussels used. (d) Volume calculated by cubic splines (using the combinations S1-T1 and S2-T2) versus the experimentally measured volume of the mussels.
Analysis of Images
The images of a given mussel were arranged as follows: the “bottom” image S1 was paired with the T1 image. Similarly, the “top” image S2 was paired with the T2 image (see ). The software LensEye (ECS, Gainesville, FL, USA), developed in the lab and modified to perform this analysis, then identified the three objects in the image, fitted the best (smallest) rectangle to each object, rotated each object so that the long axis of this rectangle was horizontal, and finally the bottom picture (T1 or T2) was vertically lined up with the top picture (S1 or S2 images). The length of the rectangle for image S1 was used as the length of the mussel. The width of the same rectangle was used as the width of the mussel. The aspect ratio was calculated as the length divided by the width. The width of the rectangle fitted to image T1 (or T2) was used as the thickness of the mussel (). The aspect ratio for the bottom picture was also calculated. The reference square present in each image allowed the conversion of lengths in pixels to lengths in cm.
The view areas of the mussel from the various directions (S1, S2, T1, and T2) were also measured by the software in pixels, and converted to real areas (cm2) using the known area of the reference square. The perimeter of the images were measured in pixels, and converted to cm length, as described above.
Application of the Cubic Spline Method
The software LensEye then applied the cubic splines method to calculate volume as follows[Citation11]:
The long axis of the mussels was divided into even divisions, going from 2 to 30. This was done to see the effect of the number of divisions on the calculated volume.
To calculate the volume of each section, the distance between the points a and b () on the X axis, and the distance between points c and d on the Y axis were calculated by the software. The true distances in cm were calculated by using the dimensions of the reference square.
The points c and d were assumed to be the mid-points of the distance a and b. With this assumption, the following can be written:
The cross-sectional area of a slice was calculated by fitting a cubic spline curve to points a c b, and another cubic spline to points a d b:
All the cross-sectional areas across the length were then integrated by using the Simpson’s method:
The different volumes calculated based on the number of divisions were evaluated. It was decided to take the average of the volumes calculated from 18 to 28 divisions ().
Other Methods of Volume Estimation
Use of length, width, and thickness
The dimensions in cm, measured from the images by the software were used in two different fitting equations to correlate with measured volume:
where a and b are parameters obtained from fitting the equations to experimental data.
Another approach was also taken in the use of L, W, and T for volume estimation. The following fitting equation was used:
where Ci, i = 0,10 are parameters obtained from fitting the equation to experimental data.
Use of view areas
The correlations between the measured volumes and measured view areas, and between the measured weights and measured view areas were calculated by fitting linear, power, and polynomial equations of the form:
In the above equations, a, b, and Ci are parameters determined by fitting these equations to data. S1 and S2 is the measured view area. The R2 values for the fits, and the sum of square (SS) errors between experimental and predicted values were calculated. In addition, the volume was estimated by using both the top and side view areas and using two empirical equations:
Perimeters and Aspect Ratios
Once perimeters and aspect ratios are calculated, they can be correlated with volume. Since it is expected that the perimeter of the view area will increase as volume increases, and since the aspect ratio has information regarding the shape of the mussel, empirical equations such as Eq. (17) can be developed and tested for their accuracy in predicting volume.
The values of A and B can be obtained by regression. For equation fitting to data, and obtaining the statistical information regarding parameters, TableCurve 3D was used (version 3.01, AISN Software, Florence, OR, USA).
RESULTS AND DISCUSSION
The calculated density of the mussels (measured weight / measured volume) was not constant, but varied from 1.05 to 1.27 g/cm3. The frequency distribution of the calculated densities is shown in . There was no significant correlation between whole mussel weight (implying size) and density (R2 = 0.2).
Cubic Spline Estimation of Volume
The calculated volume (based on two different sets of images S1 T1, and S2 T2) using the cubic spline method versus the measured volume is plotted in , together with the X = Y line. It is apparent that the calculated volumes are close to the measured volume, but the majority of the data are above the X = Y line, indicating a slight over-estimation of the measured volume by the cubic spline method.
Linear regression fitted to the volume calculated by using the S1 T1 combination of images versus measured volume resulted in an R2 = 0.97 (slope = 1.037). Similarly, the volume calculated by using the S2 T2 combination of images versus experimental volume gave an R2 = 0.98 (slope = 1.003).
Estimation of Volume Using L, W, T Data from Image Analysis
The length, width, and thickness of the mussels varied individually. presents the frequency distribution of these dimensions. It can be observed that length varied more than the other two dimensions. The length, width, and thickness data was used to estimate volume (Eqs. (9)—(11). The result is presented in . It was found that all R2 values are above 0.95. Eqs. (9–10) have two parameters, while Eq. (11) has 10 parameters. Since the R2 values are close, it is not necessary to use Eq. (11). It can be concluded that if the length, width and thickness information is available, then volume of mussels can be predicted by using Eq. (9).
Use of View Areas S
Since taking two images of the same mussel, one from the top and one from the side is not convenient; another method of estimating the volume was tested. The view areas were correlated with the measured volume. Again, there are two sets of view area data: the “S2”, and the “S1” images. Linear (R2 = 0.94), power (R2 = 0.93) and second order polynomial (R2 = 0.943) equations were fitted to the measured volume versus “S1” view area. The R2 values for similar fits to the measured volume versus “S2” view area are very close to the above (). Since the R2 values in this case are lower, and the SS values are higher, this method of predicting the volume is not as accurate as using both the top and side view images. This is expected since less data are used for the prediction.
Table 2 Parameters of the fitted equations to volume versus view area
Prediction of Volume by Using S and T View Areas
If the side view area is also used together with the top view area to predict volume, then there are two variables to predict the whole volume using Eqs. (9) and (10). It is expected that since more data are used, and since there are three parameters in the predictive equations, the R2 will be better. This is indeed the case (). The R2 values increase from 0.94 () to 0.97 (). Since both Eqs. (15) and (16) are empirical, and since Eq. (5) is simpler, it is recommended over Eq. (16) if this method of prediction is selected for the whole volume of mussels.
Prediction of Weight Using View Areas S
The measured weight was also estimated by using the view areas from the images taken. Again, linear, power, and second order polynomial equations were fitted to the data. In this case it can be observed () that the R2 values are slightly lower, and the SS error values are higher than in the case of volume estimations (). It can be speculated that the variation in the density of individual mussels may be the cause of this difference.
Table 3 Prediction of whole volume by using the top and side view areas of mussels
Table 4 Parameters of the fitted equations to weight versus view area
Prediction of Meat Mass from Total Mass
Since the ultimate product of the mussel is the meat, it was attempted to estimate the weight of the mussel meat from that of the whole mussel. It has been reported that the weight of the meat changes with season, presumably either by the effect of spawning, and/or by the amount of available nutrients.[Citation4] This work was performed in April, 2012 in New Zealand. Therefore, the weights of the meat reported here reflect this time of the year. The results of fitting linear, power, and polynomial equations to the meat weight versus whole mussel weight data are shown in . In all cases the R2 values are about 0.7, indicating not a good predictability. It is apparent that there are large individual variations between mussels in this case.
Table 5 Parameters of the fitted equations to meat weight versus whole weight
The frequency distribution of the condition index of the mussels, as calculated by Eq. (2) is shown in . There is a wide distribution of the index values, from 48.5 to 95.5. The cause of variation in the condition index may be due to individual differences, since the correlation of the condition index with the whole mussel weight (therefore the size of the mussel) is weak (R2 = 0.2).
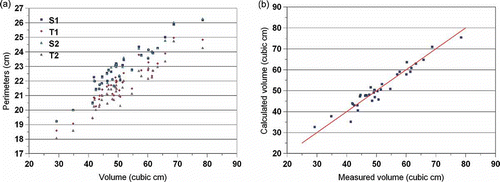
Finally, the frequency distribution of the aspect ratios and the relationship between perimeters and volume are given in and , respectively. It would be interesting to explore if three is a correlation between any and all there geometrical parameters and the sex of the mussel, because there is currently no method of predicting sex before shucking the mussel. Once geometrical parameters are obtained from image analysis, other empirical ways can be developed to predict volume by various combinations of these parameters. For example, after regression of the data to obtain the A and B values for Eq. (17) (A = 21.66, B = –6.58), the prediction of volume had an R2 = 0.94 ().
Figure 2 (a) Length, width and thickness frequency distributions of the mussels, measured by image analysis. (b) Volume calculated by using Length, Width, and Thickness data using Eqns. 10, 11 and 12. (c) Distribution of the frequency of the condition index of the mussels, calculated by using Eq. (2). (d) Distribution frequency of the aspect ratio (length / width) of the S1, S2 views and T1, T2 views of the mussels.
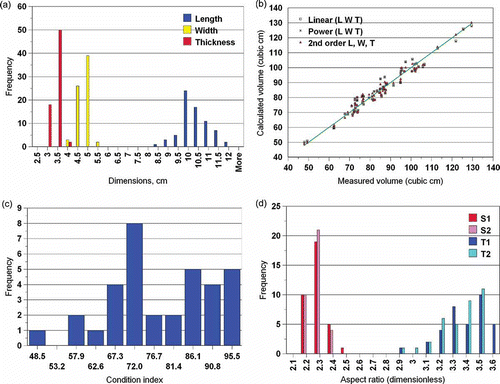
Figure 3 (a) Correlation between volume and perimeters of various view areas. (b) Volume calculated using Eq. (17) vs measured volume.
CONCLUSION
The volume of mussels can be accurately predicted by using the cubic spline method applied to two images (top and side views) of the mussels. The same prediction by using only the view areas, or by using dimensions (length, width, thickness) is less accurate. Prediction accuracy is increased if both the top and side views are used in empirical equations to predict whole volume. The meat weight cannot be predicted accurately by just using the whole weight of the mussel. The same conclusion can also be drawn for the condition index. Better predictive methods both for meat weight and condition index need to be found.
FUNDING
The financial support of TUBITAK for the year-long visit of Dr. Alçiçek to the University of Auckland by the post-doctoral fellowship grant 2011–2012 is gratefully acknowledged.
REFERENCES
- KanDo Innovation. 2009. http://www.kandoinnovation.com/external/Auckland%20Today%20April%202009.pdf ( accessed May 24, 2012).
- Future Cuisine. 2012. http://www.futurecuisine.co.nz/Our-Products.html. ( accessed May 24, 2012).
- Leadley, C.; Shaw, H.; Brown, L.; Burling, S. Pilot trials to determine the benefits of high pressure processing (HPP) for seafood in the UK. Report on phase 1 studies. Report No: FMT/REP/95900/1. CCFRA Technology LTD., Chipping Campden, UK, 2008.
- Gupta, S. High Pressure Processing of New Zealand Mussels (Perna canaliculus); Ph. D Dissertation, Chemical and Materials Engineering Department, University of Auckland, New Zealand, 2012.
- Sandrasegaran, K.; Kwo, K.P.W.; DiGirolamo, D.; Stockberger, Jr. S.M.; Cummings, O.W.; Kopecky, K.K. Measurement of liver volume using spiral CT and the curved line and cubic spline algorithms: Reproducibility and inter-observer variation. Abdominal Imaging 1999, 24 (1), 61–65.
- Liu, C.J. Log volume estimation with spline approximation. Forest Science 1980, Monograph 22 (Supplement to number 3, Sept., 1 1980) 361–369.
- Damar, S.; Yağız, Y.; Balaban, M.O.; Ural, S.; Oliveira, A.C.M.; Crapo, C.A. Prediction of oyster volume and weight using machine vision. Journal of Aquatic Food Product Technology 2006, 15 (4), 5–17.
- Balaban, M.O.; Chombeau, M.; Gumus, B.; Cirban, D. Determination of volume of Alaska Pollock (Theragra chalcogramma) by image analysis. Journal of Aquatic Food Product Technology 2011, 20 (1), 45–52.
- Kabas, O. Methods of measuring bruise volume of pear (Pyrus Communis L.). International Journal of Food Properties 2010, 13 (5), 1178–1186.
- Khojastehnazhand, M.; Omid, M.; Tabatabaeefar, A. Determination of tangerine volume using image processing methods. International Journal of Food Properties 2010, 13 (4), 760–770.
- Luzuriaga, D.; Balaban, M.Ö.; Yeralan, S. Analysis of visual quality attributes of white shrimp by machine vision. Journal of Food Science 1997, 62 (1), 1–7.