
Abstract
Vitamin C is a widely used food ingredient, and its stability is both important and sensitive to environmental conditions. To monitor chemical and color stability, samples were prepared with varying water contents (0–50 mol water/mol solid) and stored at temperatures (22–60°C) for up to eight weeks. Three common methods (UV/Vis spectroscopy, high performance liquid chromatography, and 2,6-dichloroindophenol titration) were used to monitor chemical stability. Color changes were documented using Hunter colorimeter analysis. Both temperature and moisture content had a significant effect on chemical stability. Browning occurred faster than chemical degradation, and kinetic models were developed for both chemical degradation and color change.
INTRODUCTION
Vitamin C is a commonly used ingredient with a wide range of applications in the food, beverage, and pharmaceutical industries. Many different techniques are used to analyze this vitamin, and the method choice is based upon cost, product application, equipment availability, and time. For instance, high performance liquid chromatographic (HPLC) techniques enable the complete separation and analysis of multiple components within a food product,[Citation1] while UV/Vis spectroscopy can analyze degradation over time;[Citation2] and both of these methods can analyze multiple samples. The AOAC (Association of Official Analytical Chemists) approved 2,6-dichloroindophenol titration method is commonly used for fresh fruits, vegetables, and juice-based products, but this method can only quantify vitamin C and not other components within the product.[Citation3] The accuracy of all methods is important due to strict vitamin C labeling requirements for all foods and beverage products, and this vitamin is often used as an indicator for the end of shelf-life. Therefore, it is important to document that all methods are producing the same results during all experimental conditions. However, such comparative studies are limited.[Citation4]
The first perception that a consumer has of a product is appearance, and therefore, the color of a food product is very important.[Citation5] Consumer acceptance of various food products may be altered over time if undesirable pigment changes develop and/or Maillard browning reactions occur. Hunter colorimeter analysis is commonly used for color determination, in which L, a, and b values are designated on a scale designed for a specific food product.[Citation5,Citation6] These values have been further used to calculate reaction rate kinetics for color changes. In studies using this approach, peach puree colors degraded in a first order reaction rate,[Citation5] and the chemical degradation of ascorbic acid was linked to the browning of cashew apples over time.[Citation7] The browning of ascorbic acid was correlated to chemical instability for solid state ascorbic acid samples stored at 50°C over time with nominal amounts of water (0.05–1.0 mol water/mol solid); however, only minimal chemical degradation was observed, and the correlation coefficients varied from 0.5886–0.9768 in first order models.[Citation8] A model has not yet been developed that compares the color change of vitamin C samples to chemical instabilities in powder and saturated solution state systems over a wider range of temperatures and initial moisture contents.
Vitamin C is known to be highly affected by a variety of environmental factors, including pH, temperature, oxygen, light, and moisture.[Citation9,Citation10] Hiatt et al.[Citation9] suggested that a 1 mol water/mol solid ratio was the threshold moisture content above which the chemical stability for vitamin C was reduced. Therefore, it was hypothesized that increasing amounts of initial moisture or increasing storage temperature will lead to enhanced chemical degradation over time. The objectives of this study were to compare the chemical stability and color change of two forms of vitamin C that were subjected to a variety of temperature and moisture conditions using three difference analytical approaches.
MATERIALS AND METHODS
Materials
Sodium ascorbate and ascorbic acid (Sigma Aldrich, St. Louis, MO) were studied. For the microplate reader chemical stability analysis, the following chemicals were used: Potassium phosphate monobasic and dibasic (Mallinckrodt Baker, Paris, KY, USA); trichloroacetic acid (TCA) and 2,2-bipyridine (Mallinckrodt-Baker, Phillipsburg, NJ, USA); and iron chloride and ethanol (EMD Chemicals, Gibbstown, NJ, USA). For HPLC determination of chemical stability, the following chemicals were used: Acetonitrile and HPLC grade water (Mallinckrodt Baker Inc., Phillipsburg, NJ); and trifluoroacetic acid (TFA) (Sigma-Aldrich Co., St. Louis, MO). For chemical stability determination using titration, the following chemicals were used: Acetic acid, meta-phosphoric acid, and 2,6-dihcloroindophenol sodium salt hydrate (Sigma-Aldrich, St. Louis, MO); and sodium bicarbonate (Mallinckrodt Baker Inc., Paris, KY).
Controlled Storage Conditions
Samples of sodium ascorbate or ascorbic acid were stored in sealed glass scintillation vials with various amounts of initial moisture (0, 0.25, 0.5, 0.75, 0.9, 1.0, 1.1, 1.5, 2.5, 2.9, 3.3, 5, 15, 29, and 50 mol water/mol solid ratio) at different temperatures (35, 40, 50, and 60 ± 1°C) in water-jacketed incubators (Forma Scientific Inc., Marietta, OH) for up to eight weeks. Samples were also stored at room temperature (22 ± 3°C) for comparative purposes. A sample size of 7 g was used in 8 mL vials for concentrated systems (0–5 mol water/mol solid). For more dilute systems (15, 29, and 50 mol water/mol solid), larger 20 mL vials were used to allow for the large sample volume. These differences in vial size were used to minimize headspace across sample treatments. Samples were then removed from treatment conditions at select time points and analyzed using one of the three analytical methods. All experiments were conducted in triplicate.
Water Activity Determination
Water activity (aw) was determined for samples of sodium ascorbate and ascorbic acid at 25°C using an AquaLab 4TE water activity meter (Decagon Devices Inc., Pullman, WA). For samples with molar concentrations ranging from 0–5 mol water/mol solid, 4 g of vitamin C was weighed into a water activity sample cup (Decagon Devices Inc., Pullman, WA), and varying amounts of water were added to reach the desired concentration. Samples were sealed and stored for 24 h at room temperature to allow for equilibration prior to analysis. For the samples containing 15–50 mol water/mol solid, samples were premade in 20 mL glass scintillation vials, the powder completely dissolved, and 2 mL of sample was transferred to the water activity meter cup for analysis. This volume was chosen as it covered the bottom of the sample cup but did not overflow the cup.
Chemical Stability Determination with Microplate Reader
A method adapted from Stevens et al.[Citation11] was used to determine the storage treatment effects on vitamin C degradation using a UV/VIS AD 340 Microplate Reader (Beckman Coulter, Inc.) with an absorbance endpoint of 570 nm. The vitamin C samples were removed from the storage chambers after a given time period and then were dissolved in deionized water in 100-mL volumetric flasks. The samples were then further diluted in 6% TCA to an endpoint concentration of 0.1 mg/mL, and absorbance measurements were compared to a standard curve to determine final vitamin C concentration.[Citation11]
Chemical Stability Determination with HPLC
Reverse phase (RP)-HPLC was used to determine the effect of moisture and temperature on the chemical stability of vitamin C over time using an Agilent Technologies 1200 Series liquid chromatography and method adapted from Heudi et al.[Citation12] The system had an Agilent 1200 Series HPLC pump, Agilent 1200 Series High Performance autosampler, a 3.9 mm × 100 mm (3.5 μm pore size) Water Xterra RP-C18 column, and an Agilent 1200 Series Diode Array Detector SL. Resolution was obtained using a 0.25 μL injection volume and an isocratic elution of 0.8 mL/min of 0.025% TFA solution in double distilled water. Detection was conducted at 240 nm for both ascorbic acid and dehydroascorbic acid (DHAA). Quantification was determined using multilevel calibration curves for ascorbic acid and DHAA.[Citation12] Analysis of sodium ascorbate was not conducted due to sample instability during sample preparation and analysis.
Chemical Stability Determination with Titration
Chemical stability was assessed using AOAC method 967.21 for vitamin C.[Citation3] Following storage treatment, the sample was diluted in metaphosphoric acid-acetic acid solution and then titrated with dichloroindophenol reagent until a light pink color was reached. The calculations were based upon those of a standard, known amount of ascorbic acid or sodium ascorbate. Calculations were conducted as follows:
Color Determination Using a Hunter Colorimeter
To monitor color, samples were analyzed using a LabScan XE Hunter Colorimeter (HunterLAB, Reston, Virginia) as directed by the manufacturer with a port view and area size set to 1.2 and 0.5 inches, respectively. Samples were analyzed on a weekly basis in the scintillation vials in which they were stored using Universal V3.7.1 software (HunterLAB, Reston, Virginia). The scintillation vials were cleaned with a Kimwipe and the instrument was calibrated using white and black tiles prior to analysis. Hunter L, a, and b values were determined with results indicated as: L representing whiteness (100) and darkness (0); a indicating redness (positive values) and greenness (negative values); and b describing yellowness (positive values) and blueness (negative values). All analyses were conducted in triplicate. Results were further used to calculate the total color difference (ΔE) using Equation 3:[Citation13]
End Product Determination Using Fourier-Transform Infrared Spectroscopy-Attenuated Total Reflectance (FTIR-ATR)
FTIR was used to evaluate structural differences between control and degraded ascorbic acid samples. Spectra were obtained using a Bio-Rad FTS 600 (Bio-Rad Laboratories, Hercules, CA) with a Golden Gate MII ATR sample accessory with a diamond top plate (Specac, Inc., Woodstock, GA) for use on powdered samples. The FTIR was equipped with a globar infrared source, a KBr beamsplitter, and a DTGS detector (Bio-Rad Laboratories, Hercules, CA). Degraded samples included ascorbic acid in 50 mol initial water/mol solid stored at 60°C for eight weeks and ascorbic acid in 1.0 mol initial water/mol solid stored at 40°C for five weeks. Prior to analysis, samples were dried at 60°C in glass petri dishes for two days to remove excess water, which could interfere with the analysis. Results were compared to control ascorbic acid samples. Analysis was conducted similar to a method by Yang and Irudayaraj.[Citation14] The scan range was set from 4000–500 cm−1 with a resolution of 4 cm−1, and 128 scans were co-added.
Reaction Kinetics
A first order kinetic model was used to develop mathematical models for vitamin C chemical degradation using the data obtained by UV-Vis spectrophotometry. The content of vitamin C could be described by the following equation:
For modeling color degradation, browning was the major color change for vitamin C; therefore, the L value, i.e., brightness, was chosen as an indication of color changes for mathematical modeling. The fractional first order kinetic model was used to describe color changes:[Citation15]
TABLE 1 Percent ascorbic acid remaining over time stored at various temperatures with various amounts of initial moisture using UV/Vis Spectroscopy
Statistical Analysis
Statistical analysis was conducted using ANOVA models for chemical stability, initial moisture content, color (L, a, b, and ΔE values), water activity, time, and temperature. Individual differences were determined using Tukey multiple comparisons. Contribution to variability was calculated similar to a method by Wang et al.[Citation16] The mean square error, MSE (type III sum of squares error versus the degrees of freedom for the treatment variable) versus the corrected total MSE for all treatment variables from the ANOVA models was used to calculate individual contributions to variability, and the sum of all treatment variable contributions to variability is 100%. Linear and non-linear regressions were conducted using OriginPro8 (OriginLab Corp., Northampton, MA) and Matlab R2009a (The MathWorks Inc., Natick, MA). All statistical analyses were conducted using PC SAS 9.3 (SAS Institute Inc., Cary, NC) with α = 0.05.
TABLE 2 Comparison of analytical methods for the percent ascorbic acid remaining over time stored with various amount of initial moisture at different temperatures
TABLE 3 Rate constants and t1/2 values for ascorbic acid upon storage under different conditions
RESULTS AND DISCUSSION
Effect of Initial Moisture and Temperature on the Chemical Stability of Vitamin C
The chemical stabilities of ascorbic acid samples containing different amounts of water and stored at temperatures ranging from 22 to 60°C are displayed in . There were no significant differences between the chemical stabilities of ascorbic acid stored at 22 and 35°C found using any of the analytical methods (). For ascorbic acid samples stored at 40, 50, and 60°C, increases in temperature led to greater chemical instability over time, consistent with previous reports.[Citation10] For sodium ascorbate samples, there were no significant differences in chemical stability at the different storage temperatures (22, 35, or 40°C) or with various amounts of initial moisture determined using UV/Vis and titration techniques (data not shown). Trends in the stability of sodium ascorbate at these temperatures were similar to those found for ascorbic acid at 22 and 35°C. The chemical degradation of ascorbic acid appeared to follow first-order reaction rate kinetics () consistent with previous reports,[Citation9,Citation10] although when data were fit to zero-order kinetic models the R2 results were similar (data not shown). The limited amount of chemical degradation present in the majority of samples, particularly those containing the least amount of water, may have limited the regression results. Reaction rate constants were then fit to the Arrhenius equation, and results are shown in . Overall, R2 values were high (> 0.95), indicating good correlation to the determined models. The significant effect of temperature on reaction rate constants is likely the basis of the good fit of the Arrhenius relationship.
TABLE 4 Kinetic models of ascorbic acid degradation
Gas production occurred in samples stored either at elevated temperatures or with high amounts of initial moisture ( and ). Vitamin C is known to degrade via two well reported pathways: aerobic and anaerobic degradation. Under aerobic conditions, the vitamin C is oxidized to DHAA[Citation17] and further hydrolyzed to 3-deoxy-L-pentosone (3DP) and 2,3-diketo-L-gulonic acid (DKG).[Citation18,Citation19] Next, the lactone ring structure is cleaved in the presence of water to form L-xylosone bis-2,4-dinitrophenylhydrazone (L-xylosone), followed by more oxidation and dehydration to form both 2-furoic acid and 3-hydroxy-2-pyrone.[Citation19] This aerobic pathway is predicted to be the primary source of chemical degradation for vitamin C in fruits and vegetables.[Citation17] Under anaerobic conditions, the lactone ring structure is cleaved in the presence of water, and further decarboxylation and molecular rearrangement lead to the production of furfural.[Citation19] Within both pathways, gases in the form of CO2 and H2 are released,[Citation18−Citation20] and this could create the air pockets seen within the sample vials ( and ). Due to the pressure building up within the closed system, the gas pushed the sample up towards the top of the vial. In ascorbic acid with 5 mol water/mol solid () and sodium ascorbate with 3.3 mol water/mol solid stored at 35°C (), the pressure (due to the gas production) was high enough to cause the sample to break the vial seal and leak over the outside of the vial. This caused difficulties in analyzing these samples. However, there was no significant difference in chemical degradation between samples with and without visible gas production.
FIGURE 1 A Visual comparison of ascorbic acid samples stored at 35°C over time with various amounts of initial moisture.
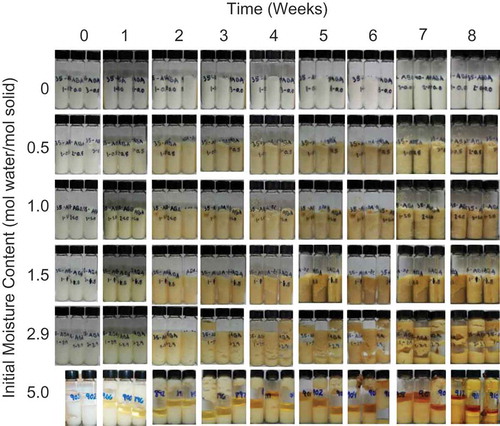
FIGURE 1 B Visual comparison of sodium ascorbate samples over time at various temperatures with 3.3 mol water/mol solid initial moisture content.
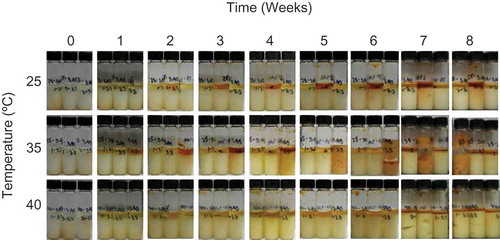
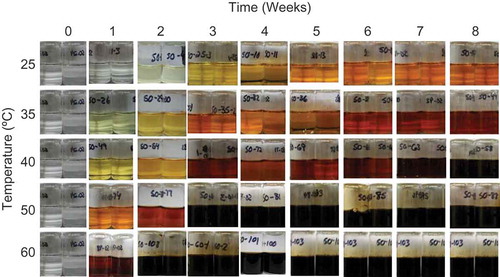
FIGURE 2 Color comparison of ascorbic acid samples over time held at various temperatures with 50 mol water/mol solid initial moisture.
A separate, smaller study was conducted to determine if the gas production and resultant pressure build-up in the vials affected chemical degradation. Samples of ascorbic acid were stored at 40 and 50°C with 1.0 mol water/mol solid initial moisture content. Three vials at each temperature were sealed with a rubber stopper, while three vials had an air vent created by using syringe needle applied through the rubber stoppers to allow for gas release. After only three days at 50°C, all samples developed enough gas pressure to rupture off the rubber stoppers. For the samples stored at 40°C, after two weeks the gas production pushed the samples up in the vials but did not cause any rupturing. After analysis using the UV/Vis spectrophotometer, no significant differences in the chemical stabilities of all 12 samples were found (data not shown).
Yuan et al.[Citation19] reported that stability variation and differences in degradation end products may occur between vitamin C replicates due to differing environmental conditions. Visible differences in both browning and gas production were observed within replicates of ascorbic acid and sodium ascorbate samples (such as sodium ascorbate samples stored at 22 and 35°C with 3.3 mol water/mol solid, ). These differences may explain the large standard deviations observed in the chemical stability assays (). The cause of variability between replicates is concerning but could be due to different degradation pathways. Over 100 different degradation end products have been reported in the degradation pathway for ascorbic acid.[Citation8,Citation17−Citation19] There is the potential within replicates to have samples degrade by different mechanisms if intermediate degradation products produce different pHs, as vitamin C stability does not have a linear relationship with pH.[Citation17] The three vitamin C analysis methods used in our study monitored loss of the initial compound to track stability, not development of degradation products, thus differences in degradation pathways were not confirmed.
At lower temperatures (< 50°C), no significant differences in the chemical stability of ascorbic acid samples containing 0–15 mol water/mol solid were found; however, higher water contents (29 and 50 mol water/mol solid) significantly reduced chemical stability over time compared to samples with less water. This may be due to aw differences in the samples (): Ascorbic acid samples with 29 and 50 mol water/mol solid had significantly higher aws than the samples with less water. These results are similar to those reported by Bell and Hageman[Citation21] in that the chemical degradation of aspartame was greatly affected by increases in aw, which led to greater amounts of molecular mobility. When enough water was present to significantly increase the water activity of the vitamin C sample, complete dissolution of the sample was observed, and this coincided with the decrease in the chemical stability.
TABLE 5 Comparison of water activity (aw), molar concentration, and moisture content for sodium ascorbate and ascorbic acid samples
The RH0 of the samples can be estimated using the aw of the saturated solution of that sample.[Citation22] Based upon this approach, the RH0 of ascorbic acid is 96.8% RH at 25°C, while the RH0 of sodium ascorbate is 85.6% RH at 25°C. These values are near previous reports of 98% RH for ascorbic acid and 86% RH for sodium ascorbate.[Citation9] No differences in chemical stability were seen in sodium ascorbate or ascorbic acid samples when the aw was at or below this RH0. In ascorbic acid samples, significant differences in chemical stability were only found in samples that also had significantly higher aws than the RH0 (samples containing 29 and 50 mol water/mol solid). Others have reported that at RHs below RH0, vitamin C is relatively stable, while above or approaching RH0, vitamin C begins to degrade.[Citation9] However, in these studies, the powdered samples sorbed moisture over time while stored in open containers in constant RH desiccators, and this may have led to differences in degradation pathways and altered the moisture sorption threshold relating to chemical degradation.[Citation9,Citation23]
A general linear ANOVA test was conducted to determine the contribution of treatment variables (storage time, storage temperature, initial moisture content, and vitamin C type) to chemical stability (). Although all individual treatments and interactions of treatments were tested, only those listed in significantly affected the chemical stability of vitamin C (P < 0.05). When evaluating the treatment contributions to variability (based upon MSE values), the initial moisture content and the interaction of initial moisture content and storage temperature contributed the most to the change in chemical stability of vitamin C, accounting for 36.4 and 34.2% of the data variability, respectively. The interaction of storage time, initial moisture content, and storage temperature was an important factor in the chemical stability of vitamin C (25.0%). Storage time (3.8%) and vitamin C type (0.6%), although significant, contributed less to the data variability. These results are consistent with previous reports indicating that changes in RH had a greater impact on chemical stability than temperature.[Citation10] This supports the conclusion that when the initial moisture content of the sample was high enough that the aw of the sample was above the RH0, the vitamin C chemical stability was significantly reduced (). The effect of temperature alone on chemical stability was also significant and follows the Arrhenius equation described in , although temperature does not appear in likely due to the different modeling approaches reported in and .
TABLE 6 Chemical stability of vitamin C: Effect and contribution of treatment factors on the variability of vitamin C chemical stabilitya as determined from MSEb values
Differences in Analytical Methods for Vitamin C Determination
At all temperatures studied, there were no significant differences in vitamin C chemical stability results when comparing UV/Vis, HPLC, and titration methods (α = 0.05), although there were differences in the variability (standard deviation) of the data (). A comparison of the pros and cons for each method are listed in . Sample variation (standard deviation) was greatest for results obtained using HPLC and UV/Vis, while the standard deviation was smallest for the titration analysis. HPLC analysis required 9 min per sample, titration about 8 min per sample, and UV/Vis 20 s per 96 samples with a 40 min incubation period. HPLC analysis enables the detection of both ascorbic acid and DHAA individually,[Citation17] while titration and UV/Vis could not differentiate between stable and oxidized forms of vitamin C. Titration was determined to be useful for quick analysis and minimal amounts of equipment or training; however, samples must be analyzed individually, and endpoint determination can lead to subjectivity.[Citation24] HPLC would be beneficial for the differentiation of ascorbic acid and DHAA; however, capital equipment costs and training are required, and degradation may occur within autosampler vials.[Citation23] UV/Vis is ideal for the analysis of multiple samples at once and obtained the most precise results for this set of experiments.
TABLE 7 Comparison of analytical techniques use for the determination of the chemical stability of various forms of vitamin C (ascorbic acid and sodium ascorbate)
Effect of Initial Moisture and Temperature on Color
The formation of degradation compounds from ascorbic acid leads to the production of off flavors and colors, and this decreases the overall quality of a food product.[Citation18,Citation19] Furanone intermediates, such as 3,4-dihydroxy-5-methyl-2-furanone intermediates, are products of dehydration that lead to the formation of caramel-like pigments and melanoidins.[Citation17,Citation18] Furfural, 3DP, and DKG, degradation end products and intermediates, are brown pigments often associated with non-enzymatic browning.[Citation18] These pigments occur through both oxidative and non-oxidative conditions are are often preceeded by the release of water in the degradation pathway of vitamin C.[Citation18,Citation19] However, hydrolysis is a pivotal step in ascorbic acid instability, as it opens the lactone ring structure, rendering it biologically inactive. This step initiates the further production of pigmented end products.[Citation17−Citation20]
Increases in moisture content and storage temperature lead to greater color formation in food products containing vitamin C,[Citation7,Citation25] conditions which were shown to significantly decrease the stability of vitamin C in this study (). Similar treatment effect trends on color formation of samples containing only ascorbic acid or sodium ascorbate and water were observed in this study (photographs for a representative set of samples are shown in , , and ). The color of the samples darkened and also turned more orange over time with all amounts of initial moisture and storage above 25°C. With increases in temperature in dilute solutions, the samples turned more brown (), which is consistent with previous reports[Citation25] that greater amounts of browning occurred with increases in temperature around 50 and 60°C. Discoloration may be due to the formation of vitamin C degradation end products, including furfural, 3DP, and DKG.
Water content has been directly linked to the discoloration of vitamin C.[Citation8] Using ANOVA tests, it was determined that the initial water content signficantly impacted the the L, a, b, and ΔE parameters (P < 0.0001) of the samples, although correlation coefficients were low (R2 < 0.2000 for all variables). This may be due to the fact that initial moisture was a categorical variable while color values were quantified over time. A general linear ANOVA test was conducted to determine the contributions of treatment variables to ΔE values, and results are listed in . Although all individual treatment factors and interaction terms were tested, only the treatments listed in the table were significant (P < 0.05). As indicated by the contribution to data variability (as determined by MSE values), the interaction of storage temperature and storage time had the greatest impact on the total color change for vitamin C samples, contributing to 58.4% of the data variability. The interaction of initial moisture content, storage time, and storage temperature contributed the second highest variability, at 19.7%, while the initial moisture content contributed the least, 2.3%. There was no difference in color formation between samples of ascorbic acid and sodium ascorbate. No other variables, independent or interactive, were significant in affecting the color change of the vitamin C samples.
TABLE 8 Color change in vitamin C: Effect and contribution of treatment factors on the variability of ΔEa as determined from MSEb values
TABLE 9 Kinetic parameters for the color degradation of ascorbic acid at 35°C
For kinetic modeling of browning, the L (brightness) values were selected as an indication of color changes of ascorbic acid. The L values initially decreased rapidly over time, and then gradually reached a plateau. Therefore, a first order fractional conversion model was used to determine the rate constants for color degradation of ascorbic acid. The results are given in , with high correlations (R2: 0.944–0.990). The reaction rate constant k increased when water content increased from 1 to 50 mole per mole solid ascorbic acid. Such results might be due to the enhanced molecular mobility resulting from increased water content. There were little, if any, differences in values obtained for samples containing 0.5, 1, 1.5, and 2.5 mol water/mol solid. However, when the water content increased to 29 or 50 molar, the
value decreased drastically from around 60 to around 10, indicating significant increases in sample darkening. Such results are consistent with the chemical stability results, wherein enhanced chemical degradation was observed in samples with the highest water contents studied of 29 and 50 mol water/mol solid.
When comparing the significant treatment effects, there were differences between the chemical stability and color data. The color development reached a plataeu after a short period of storage, while chemical degradation continued beyond that point. Significant color degradation was observed in all samples, even though most of the samples remained chemically stable, suggesting that color is a much more sensitive indication of vitamin C stability compared to the concentration of vitamin C remaining. Both temperature and moisture content affected the color and chemical stability of vitamin C significantly. Much more severe browning and significant chemical degradation were observed in samples in the solution state (29 and 50 mol water/mol solid) compared to those in the solid state (water content below 29 molar), suggesting the physical state of ascorbic acid signifcantly affected its stability.
Comparison of Chemical Structure for Control and Degraded Ascorbic Acid Samples
FTIR spectroscopy was used to characterize structural differences between control samples and samples stored at higher temperatures where color development was present. FTIR spectra are shown in . The spectrum of the sample stored at 40°C (five weeks at 40°C with 1.0 mol water/mol solid) was similar to the spectrum of the control sample of ascorbic acid (no storage treatment). For samples stored at 60°C (eight weeks at 60°C with 50 mol initial water/mol solid), many spectral differences were found compared to the control. The four peaks between 3500–3000 cm−1 (3522, 3401, 3303, and 3196 cm−1) in spectra of both 40°C and control samples are representative of O-H stretching. Often, O-H stretching is portrayed by a broad region due to hydrogen bonding interactions. However, when hydrogen bonding is sterically hindered, the broad peak is replaced with sharp peaks in the 3600–3000 cm−1 range,[Citation26] as seen in these spectra. The four peaks are therefore indicative of the four hydroxyl groups of ascorbic acid.[Citation27] However, in the spectra of the 60°C samples, the O-H stretching region had a broad peak. This could be due to the loss of cyclical compounds and the formation of new degradation compounds or due to the loss of sterically hindered OH groups on the carbon ring. Many degradation compounds are not in a cyclical structure, thus there is no steric hindrance. The hydroxyl groups present on the degradation products 2-keto-L-gulonic acid and L-xylosone are not sterically hindered by the carbon ring. In addition, the cyclical degradation compounds of 2-furoic acid and 3-hydrxy-2-pyrone have OH groups that may participate in hydrogen bonding, which would lead to a broad O-H stretching region. The spectra in are an indication that degradation occurred in ascorbic acid stored at 60°C but not in the control and 40°C samples. These results are consistent with the findings from UV/Vis analysis in that samples stored with 50 mol water/mol solid at 60°C for eight weeks had 0% ascorbic remaining and were black in color (), while samples stored with 1.0 mol water/mol solid at 40°C for five weeks had 91.0 ± 1.3% ascorbic acid remaining and were a slightly yellow to brown in color (similar to the samples with 1.0 mol water/mol solid stored at 35°C shown in ).
FIGURE 3 FTIR-ATR spectra for ascorbic acid samples stored at 60°C for eight weeks with 50 mol initial water/mol solid and 40°C for five weeks with 1.0 mol initial water/mol solid as compared to the control (no storage treatment).
Other differences in the spectra of the samples stored at 60°C include a peak shift from 1678 cm−1 to 1714 cm−1, an indication of C=C ring stretching.[Citation28] Shifting of peak wavenumbers may be attributed to conjugated or neighboring functional groups as well as changes in electron density. If neighboring atoms add electron density to the functional group, the peak shifts to a higher absorbance, while decreasing electron density shifts the peak to a lower absorbance.[Citation26] Ascorbic acid and DHAA are two of the few molecules along the degradation pathway of vitamin C that remain in the cyclical structure. Therefore, as water hydrolyzes the lactone ring structure of ascorbic acid, linear molecules are formed.[Citation18,Citation19] A decrease in intensity in the C=C ring stretch could signify a greater presence of degradation compounds. However, the degradation end products, furfural, 2-furoic acid, and 3-hydrxy-2-pyrone, form cyclical structures. Hence, a shift in the C=C ring stretch could be due to the formation of new cyclical structures as compared to the control and 40°C samples. Furfural has been reported to produce a dark pigment,[Citation18] which can be seen in the samples shown in . The dark brown samples correspond the peak shift as an indication that furfural is present within the 60°C sample.
The peak at 1323 cm−1, indicative of C-O-H bending, found in the spectra of 40°C and control samples is nonexistent for the ascorbic acid stored at 60°C.[Citation14,Citation28] The peak for C-C(=O)-O stretching, at 1202 cm−1, and the peak for C-O-C stretching, at 1140 cm−1, are also present in the spectra for 40°C and control samples but not observed for the 60°C sample.[Citation14,Citation28] In addition, the peaks present between 1150–1000 cm−1 (C-O-C stretching and C-O-H bending)[Citation14] and at 990 cm−1 (C-H and O-H bending)[Citation14,Citation28] are less pronounced in the 60°C sample than in the other samples. The peaks for C-H bending (850–750 cm−1) are no longer present or are shifted in the 60°C as compared to the 40°C and control samples. Yang and Irudayaraj[Citation14] indicated that an increase in vitamin C concentration led to changes in a variety of peaks in the spectra of pure ascorbic acid, especially in the 1000–950 cm−1 range. This was due to the possible interference of other functional groups present within the system, such as aldehydes, ethers, esters, and hydroxyl groups that were present in many of the degradation products from vitamin C. Therefore, wavenumber shifts for these peaks do not give an indication of the specific degradation products produced within this experiment since changing concentrations also influence the spectra. However, it is clear that samples stored at 60°C are structurally different from the control and 40°C samples.
Storage conditions and initial water content significantly influenced the chemical stability and color of ascorbic acid and sodium ascorbate. The initial moisture content led to greater chemical instability when the aw was above the critical aw and RH0 where ascorbic acid was completely dissolved in the solution. There were no significant differences in the methods for chemical analysis when comparing HPLC, UV/Vis, and titration, although HPLC and titration led to greater data variability and larger standard deviations of results. Color formation occurred at a faster rate than chemical degradation, and although no loss of vitamin C was found in samples with some yellowing present, significant dark color formation was indicative of significant vitamin C degradation. Mathematical models were developed for both color and chemical degradation of ascorbic acid with high correlations. Research in more dilute solutions could further enhance these models, since the majority of the chemical stability data collected was for samples with little degradation within the experimental space. This would allow for better predictions of vitamin C chemical stability as it relates to color formation and storage treatment.
ABBREVIATIONS
3DP: 3-deoxy-L-pentosone;
aw: water activity;
DHAA: dehydroascorbic acid;
DKG: 2,3-diketo-L-gulonic acid;
L-xylosone: L-xylosone bis-2,4-dinitrophenylhydrazone;
MSE: mean square error;
RH: relative humidity;
RH0: deliquescence point;
SSE: sum of square error.
ACKNOWLEDGMENTS
The authors would like to thank Dr. Fernanda San Martin for providing assistance with HPLC analyses.
REFERENCES
- Zafra-Gómez, A.; Garballo, A.; Morales, J.C.; García-Ayuso, L.E. Simultaneous determination of eight water-soluble vitamins in supplemented foods by liquid chromatography. Journal of Agricultural and Food Chemistry 2006, 54 (13), 4531–4536.
- Meng, Q.; Teng, L.; Jiang, C.; Jin-shuang, A.; Li, L.; Lu, J.; Teng, L. First-order derivative spectrophotometry for the determination of vitamin C in medicament. Chemical Research in Chinese Universities 2008, 24 (1), 29–31.
- AOAC. Aoac Official Method 967.21 Ascorbic Acid in Vitamin Preparations and Juices: 2-6,dichloroindophenol Titrimetric Method. In: Vitamins and Other Nutrients; Gaithersburg: AOAC International, 2006; 45.41.14.
- Rekha, K.; Murthy, B.N. Validation and application of an ascorbate oxidase biosensor for the rapid analysis of vitamin c in food and pharmaceutical samples. Food and Agricultural Immunology 2010, 21 (2), 103–111.
- Ávila, I.M.L.B.; Silva, C.L.M. Modelling kinetics of thermal degradation of colour in peach puree. Journal of Food Engineering 1999, 39 (2), 161–166.
- Francis, F.J.; Clydesdale, F.H. Food Colorimetry: Theory and Applications, AVI Publishing: Westport, 1975; 130–142.
- Lima, J.R.; Elizondo, N.J.; Bohuon, P. Kinetics of ascorbic acid degradation and colour change in ground cashew apples treated at high temperatures (100–180°C). International Journal of Food Science and Technology 2010, 45, 1724–1731.
- Shepard, A.B.; Nichols, S.C.; Braithwaite, A. Moisture induced solid phase degradation of l-ascorbic acid part 1: A kinetic study using tristimulus colorimetry and a quantitative HPLC assay. Talanta 1999, 48, 585–593.
- Hiatt, A.; Ferruzzi, M.; Taylor, L.; Mauer, L. Deliquescence behavior and chemical stability of vitamin C forms (ascorbic acid, sodium ascorbate, and calcium ascorbate) and blends. International Journal of Food Properties 2010, 14, 1330–1348.
- Hiatt, A.N.; Taylor, L.S.; Mauer, L.J. Influence of simultaneous variations in temperature and relative humidity on chemical stability of two vitamin C forms and implications for shelf life models. Journal of Agricultural and Food Chemistry 2010, 58 (6), 3532–3540.
- Stevens, R.; Buret, M.; Garchery, C.; Carretero, Y.; Causse, M. Technique for rapid, small-scale analysis of vitamin C levels in fruit and application to tomato mutant collection. Journal of Agricultural and Food Chemistry 2006, 54 (17), 6159–6165.
- Heudi, O.; Kilinc, T.; Fontannaz, P. Separation of water-soluble vitamins by reverse-phase high performance liquid chromatography with ultra-violet detection: Application to polyvitaminated premixes. Journal of Chromatography A 2005, 1070, 49–56.
- Lv, B.; Li, B.; Chen, S.; Chen, J.; Zhu, B. Comparison of color techniques to measure the color of parboiled rice. Journal of Cereal Science 2009, 50 (2), 262–265.
- Yang, H.; Irudayaraj, J. Rapid determination of vitamin C by NIR, MIR, ad FT-Raman techniques. Journal of Pharmacy and Pharmacology 2002, 54 (9), 1247–1255.
- Li, N.; Ferruzzi, M.G.; Taylor, L.S.; Mauer, L.J. Color and chemical stability of tea polyphenol (-)-epigallocatechin-3-gallate in solution and solid states. Food Research International 2013, In Press.
- Wang, L.N.; Hayes, K.D.; Mauer, L.J. Effects of heat and beta-lactoglobulin on distribution of fluorescently labeled tissue- and urokinase-type plasminogen activators in a model milk system. International Dairy Journal 2007, 17 (5), 448–458.
- Fennema, O. Fennema’s Food Chemistry Fourth Edition. CRC Press: Boca Raton, 1996; 1144.
- Kurata, T.; Sakurai, Y. Degradation of l-ascorbic acid and mechanism of nonenzymatic browning reaction part II. Non-oxidative degradation on l-ascorbic acid including the formation of 3-deoxy-l-pentosone. Agricultural and Biological Chemistry 1967, 31 (2), 170–176.
- Yuan, J.P.; Chen, F. Degradation of ascorbic acid in aqueous solution. Journal of Agricultural and Food Chemistry 1998, 46 (12), 5078–5082.
- May, J.M. Ascorbate function and metabolism in the human erythrocyte. Frontiers in Bioscience 1998, 3, D1–D10.
- Bell, L.N.; Hageman, M.J. Differentiating between the effects of water activity and glass transition dependent mobility on a solid state chemical reaction: Aspartame degradation. Journal of Agricultural and Food Chemistry 1994, 42 (11), 2398–2401.
- Mauer, L.J.; Taylor, L.S. Water-solid interactions: Deliquescence. Annual Review of Food Science and Technology 2010, 1, 41–63.
- Lipasek, R.A.; Taylor, L.S.; Mauer, L.J. Effects of anticaking agents and relative humidity on the physical and chemical stability of powdered vitamin C. Journal of Food Science 2011, 76 (7), C1062–C1074.
- Robertson, G.L.; Samaniego, C.M.L. Effect of initial dissolved oxygen levels on the degradation of ascorbic acid and the browning of lemon juice during storage. Journal of Food Science 1986, 51 (1), 184–187.
- Vikram, V.B.; Ramesh, M.N.; Prapulla, S.G. Thermal degradation kinetics of nutrients in orange juice heated by electromagnetic and conventional methods. Journal of Food Engineering 2005, 69 (1), 31–40.
- Coates, J. Interpretation of infrared spectra, a practical approach. In: Encyclopedia of Analytical Chemistry; Meyers, R.A. Ed.; John Wiley & Sons Ltd.: Chichester 2000; 10815–10837.
- Nath, M.; Jairath, R.; Eng, G.; Song, X.; Kumar, A. New organotin (iv) ascorbates: synthesis, spectral characterization, and biological and potentiometric studies. Spectrochimica Acta Part A 2005, 61, 77–86.
- Yohannan Panicker, C.; Tresa Varghese, H.; Philip, D. FT-IR, FT-Raman and SERS spectra of vitamin C. Spectrochimica Acta Part A: Molecular and Biomolecular Spectroscopy 2006, 65 (3–4), 802–804.