
Abstract
This article describes an image processing based technique used to estimate the relationship between volume and mass of axi-symmetric fruits like apple, sweet-lime, lemon, and orange. The technique used a single camera to capture five different views of a fruit. The volume of the fruits was estimated based on its shape. The fruits were categorized into spherical, ellipsoid, and paraboloid shapes and an appropriate analytical model for calculating volume was used for each category. The volume computed was in accordance with the actual volume determined by water displacement method. The average densities measured were 0.808 g/cm3 for apples, 0.912 g/cm3 for sweet-limes, 0.912 g/cm3 for lemons, and 0.814 g/cm3 for oranges. As the density of a particular fruit within a batch was fairly constant, there was a good correlation between the volume and mass of fruits. This hypothesis was used to determine the mass of the fruits based on the estimated volume. Thus with a simple approach used to estimate the volume using a single camera, it was also possible to find the mass of the fruits. The proposed techniques were implemented using C++ language and open source computer vision library and the results were found to be reasonably accurate.
INTRODUCTION
Traditionally, volume and mass of fruits are estimated manually by water or gas displacement method and digital weighing balance method, respectively. Computer vision (CV) based fruit grading and sorting systems are considered as a potential replacement to traditional manual inspection in fruit packaging and export industries. The main purpose of such sorting systems is to sort the fruits based on its quality parameters. Several parameters such as color, size, shape, volume, mass, surface area, and hidden defects come into play while deliberating upon the quality of fruits. The existing CV systems for sorting of fruits generally focus on color (ripeness) and surface defects only. They give least importance to the parameters like volume and mass.
Estimation of volume and mass of fruits is needed for applications in quality inspection, meeting quality standards, increasing market value and for planning the packaging, transportation, and marketing operations.[Citation1] If the volume and mass of fruits are known, then it is easy to calculate the fruit density which would be helpful in identifying the hidden defects present in the fruits.[Citation2]
Different mathematical models and numerical analysis methods have been applied to extract a representation of volume.[Citation3] Some commonly used methods to determine volume include geometric mean diameter, water displacement method (WDM), and gas displacement method. The WDM is a simple and easy way, but the fruits might be damaged by the immersion into the liquid.[Citation4] The gas displacement method does not damage the fruit but it takes a very long time for estimating volume. Three dimensional shape determination using ultrasonic devices[Citation5] or projections of structured light[Citation6,Citation7] or X rays have considerable potential for providing accurate volume estimation, but the expense of installation of these devices outweighs the benefits to the packing house. Hence, it is of prime importance to develop a system that is economically feasible and at the same time provide high accuracy in results.
Tillet et al.[Citation8] estimated the volume of potatoes based on 12 different images captured using two cameras as the potatoes rolled along a conveyor system. Assuming that the potato density is relatively constant among the potatoes, weight of individual potato was estimated from its volume. Similar methods were used by William et al.[Citation9] to determine the volume of oranges using average diameter measured from eight images at equal angular intervals taken during a single rotation of the orange. Forbes and Tattersfield[Citation10] developed an algorithm for estimation of apple volume assuming symmetry and using four images of the fruit rotated around its stem-calyx axis. Hahn and Sanchez[Citation11] proposed two model-based algorithms to predict volumes of fruits and vegetables. Ljiljana Babic et al.[Citation12] developed a mathematical model and algorithm for the estimation of a pear quarter’s surface area and volume on the basis of just the pear’s length. Soltani et al.[Citation13] developed a mathematical model to estimate the volume of banana fruit using first Papus theorem. However, they have not applied any image processing techniques for estimating the volume. It was presumed that the cross section of banana was elliptical and the volume of each plane was performed by rotation of elliptical area about the center of curvature.
Sabilov et al.[Citation14] and Wang and Nguang[Citation15] used image processing techniques to compute the volume and surface area of axi-symmetric agricultural products. Lee et al.[Citation16] and Eifert et al.[Citation17] adopted the machine vision approach and developed imaging systems for estimating the volume for irregular shaped agricultural products using radial projections. Koc[Citation18] determined the volume of watermelon using ellipsoid approximation and image processing. Khojastehnazhand et al.[Citation19] developed and tested machine vision and image processing for computing surface area and volume of axi-symmetrical agricultural products. Tabatabaeefar et al.[Citation20] modeled orange mass, based on its dimensions measured using micrometer and ΔT area-meter. Only limited literatures are available on mass computation of fruits.
More recently, Iqbal et al.[Citation21] estimated the volume of apple fruits based on single view fruit images and the shape-based analytical models. Here the ideas are extended and presented in the above article in four ways: (1.) analyzing five images captured by a single camera and averaging the results for improved accuracy, (2.) extending it to the case of axi-symmetric fruits like sweet-lime, lemon, and orange, (3.) using a modified volume estimation method for paraboloid shaped fruits as a special case of ellipsoid approximation to bring down the deviation in estimation, and (4.) implementing the proposed techniques using C++ language and open source CV library to make the execution time faster compared to other software. The relationship between the actual volume and the actual mass of each fruit was derived. With this relationship, it was possible to estimate the mass of the fruit based on the volume estimated by image processing technique.
MATERIALS AND METHODS
The proposed method estimates the volume of the fruits based on its shape and hence mass. The step by step procedure involved in the estimation of volume and mass of fruit is shown in .
FIGURE 1 Steps involved in the proposed method.

Depending upon the cultivar and type of the fruit, the fruit shape falls under one of the three categories, namely, circle, ellipse, and parabola.[Citation21] A separate analytical method was used for each of these categories to determine the volume of the fruit. The method analyzed the boundary information of the fruit image. It involved obtaining the contour of the fruit, orienting the fruit along a particular axis, and judging the shape based on the eccentricity and the AB ratio given by b/a where 2b = polar diameter and 2a = equatorial diameter of the fruit.
Extraction of Contour
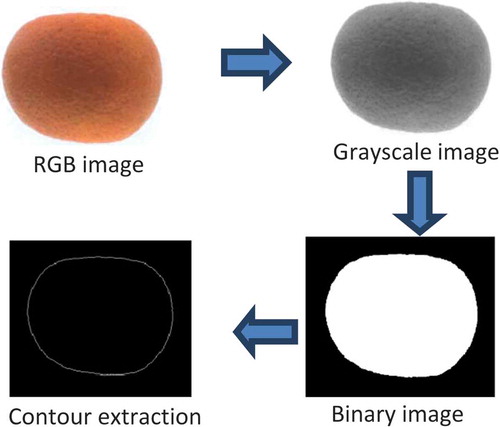
The image captured by the camera was a Red Green Blue (RGB) image. Since only the boundary of the fruit is important for volume estimation we extracted the contour from the fruit image. The RGB image was first converted into a grayscale image and the grayscale image was then converted to a binary image. The Otsu’s Algorithm was used to determine the threshold value. Finally, the contour was extracted from this binary image. shows the process that is involved.
FIGURE 2 Steps in extraction of contour.
Orientation of the Fruit Image
For easier computation of volume, the fruit images were oriented such that the stem-calyx axis of the fruit lied parallel to the vertical edge or horizontal edge of the image. If the fruit image is not oriented appropriately, the angle of inclination or the angle of tilt of stem-calyx axis has to be determined from the fruit boundary pixel data information by the following procedure.[Citation22]
Considering {(xi, yi), i = 1, 2, 3 … n} as the set of boundary pixel points, the angle of tilt Φ, with respect to horizontal axis can be obtained as:
Ix = moment of inertia about x-axis, Iy = moment of inertia about y-axis, Ixy = product of inertia, xi = x-coordinate of i-th pixel point in the fruit contour, yi = y-coordinate of i-th pixel point in the fruit contour, xav = average value of the x-coordinates of n pixel points in the fruit contour, yav = average value of the y-coordinates of n pixel points in the fruit contour and n = number of boundary pixel points under consideration. Based on elaborative trials, it was observed that for an angle of tilt up to 10°, the volume estimations were found to be reasonable and hence the images were not rotated till 10°. For tilt angles greater than 10°, rotation was required. From this rotated image, the boundary pixel information was obtained again and used for further analysis.
Shape Determination
Boundary pixel information was analyzed to classify the shape of the image. The boundary points depicted in the were determined.[Citation21] The distance between the left extreme point (xmin, ycor1) and the right extreme point (xmax, ycor2) was considered as the length of the major axis (or equatorial diameter, ED), ‘2a’:
FIGURE 3 Boundary points of apple.
The mid-point (xmid1, ymid1) of the line joining the top extreme points (xcor1, ymax1) and (xcor2, ymax2), and the mid-point (xmid2, ymid2) of the line joining the bottom extreme points (xcor3, ymin1) and (xcor4, ymin2) are determined as given below:
The distance between these two mid points was assumed to be the length of the minor axis (or polar diameter, PD), ‘2b’:
The eccentricity was then computed as:
The AB ratio was given as ‘b/a’. The eccentricity of the fruit boundary and the position of the ED with respect to the mid-point of the PD were used as the basis for comparison of shapes. If the position of the ED is nearer to the mid-point of the PD then the boundary is either a circle or an ellipse. If the ED is far-off from the mid-point of the PD and nearer to the stem-edge (top portion) of the PD, then the image contour is a parabola. Thus, based on the eccentricity value, and the position of the ED with respect to the PD, the fruit was classified as spheroid, ellipsoid, or paraboloid for estimating the volume. The obtained values were utilized to determine the criteria for shape models as given in .[Citation21]
TABLE 1 Criteria for shape models
Volume Estimation
Once the shape of the fruit is determined, volume can be estimated using the three evaluation methods given below.[Citation21]
Circular evaluation method
This method was used to estimate the volume of fruit having circular shapes. Referring to , the shape of the fruit was assumed to be a circle passing through the left extreme point (xmin, ycor1), right extreme point (xmax, ycor2) and bottom left point (xcor3, ymin1). The general equation of the circle is given by:
Elliptical evaluation method
This method is best suited for estimating the volume of fruit with elliptical shapes. Referring to , an ellipse was drawn using boundary pixel points, (xmin, ycor1), (xmax, ycor2), (xmid1, ymid1), and (xmid2, ymid2) and the values of semi-major axis ‘a’ and semi-minor axis ‘b’ were determined as given in Eqs. (4) and (6). The equation of the ellipse obtained would be of the form:
The volume of the solid of revolution of the above elliptical contour about y-axis (oblate ellipsoid) was estimated as:
Parabolic evaluation method
The parabolic evaluation method is considered as a special case of elliptical evaluation method, except for the fact that the major and minor axes are interchanged. Thus, the volume was obtained as:
This method was found to give more accurate results when compared to the method adopted by Iqbal et al.[Citation21]
The above methods were evaluated in the laboratory by imaging and analyzing commercially available fruits. A total of 120 samples of four varieties of fruits, namely, apples, sweet-limes, lemons, and oranges were purchased from the local market for evaluation, consisting of 20 apples, 40 sweet-limes, 20 lemons, and 40 oranges. The actual volumes and actual masses of the fruits were measured to 0.01 cm3 and 0.01 g accuracy using WDM and digital weighing balance, respectively. A graduated one-liter beaker filled with 500 ml of water was used for WDM and a LC-GC make Model:LT6001 weighing balance was used for weighing fruits.
The fruits were imaged using a JAI make CV – M7 + CL CCD camera having image resolution of 1380×1030 pixels. Four views of each sample fruit rotated at 90º manually and one more view by placing the fruit in random position manually were captured as images under uniform, diffused and glare-free lighting conditions in a fixed setup. Any alteration to the setup like adjusting the position of the camera may lead to a different scale factor. It is important that the fruits are imaged with a fixed scale factor (pixels/mm).
The obtained fruit images were analyzed using image processing techniques involving segmentation of fruit object, determination of fruit boundary and extraction of boundary pixel information. The eccentricity values, ED and PD were obtained using the boundary information. It was observed that the images obtained with lemons and sweet-limes were almost spherical, the images obtained with oranges were mostly elliptical and few spherical, whereas the images obtained with apples were falling into all the categories, namely, spherical, elliptical, and paraboloidal. Scale factor was suitably incorporated into the calculations to convert the image parameters into real physical parameters.
C++ language was used for implementation of volume and mass estimation of fruits. Libraries/packages, namely, open CV, GNU plot, libConfuse, etc., that are highly platform independent were used alongside for successful implementation of software. The implementation of volume and mass measurement of fruits in C++ were put under rigorous testing so as to ensure the correctness of its design and implementation. The two testing levels, namely, unit testing and integration testing were primarily used here. Testing was performed to identify errors and was an integral part of the entire development and maintenance process.
Fifty percent of the sample fruits from each category, i.e., 60 total fruits were used for training purposes. Based on the above training, the model estimated the volume of any new sample fruit. All the 120 sample images of four varieties of the fruits, namely, apples, sweet-limes, lemons, and oranges were tested using the developed models.
Mass Determination
For any object within a batch, with fairly constant densities, the mass is highly correlated to its volume.[Citation1] This particular idea was used to determine the mass of the fruit from the estimated volume. Before the mass of a fruit was estimated from its volume by image processing, few samples of the fruit under consideration were taken for training purposes. The samples were studied for correlation between the actual volume and actual mass. The result of this study was used for further processing.
Omid et al.[Citation3] used correlation formula, derived based on the collected data on mass and computed volume by image processing for orange, lemon, lime, and tangerine. In the proposed method, the actual volume (x) and actual mass (y) parameter of the fruit samples taken for training was studied and regression equations were obtained with mass as the dependent variable and volume as the independent variable.
These regression equations were then used by the software for estimating the mass of fruits based on the volume computed by image processing.
RESULTS AND DISCUSSIONS
The volume and hence the mass of fruits like apples, sweet-limes, lemons, and oranges were estimated using spherical, ellipsoid, and paraboloid approximation and were compared with the actual measurements done with WDM and with digital weighing balance, respectively. The measured and estimated volumes and masses of these fruits are shown in along with the percentage deviations. The percentage deviation between measured volume and estimated volume for apple, sweet-lime, lemon, and orange samples were found to be within –3.95 to +5.5%, –7.13 to +4.91%, –6.55 to +7.01%, and –7.72 to +7.93%, respectively. It can be very well seen that the percentage deviation in volume estimation of paraboloid apples obtained by Iqbal et al.[Citation21] as ±11% is considerably reduced by the modified method applied for paraboloid apples. Likewise, the percentage deviation between measured mass and estimated mass for apple, sweet-lime, lemon, and orange samples were found to be within –7.72 to +6.15%, –6.44 to +5.17%, +0.15 to +7.41%, and –7.69 to +7.7%, respectively. The results obtained were found to be encouraging. The estimated volumes and the estimated masses were found to be closely following the corresponding measured values.
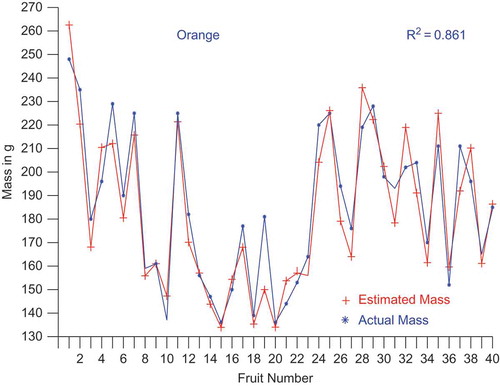
shows the plot of estimated volume versus actual volume of apple, sweet-lime, lemon, and orange samples, respectively, actual volumes being measured using WDM. shows the plot of estimated mass versus actual mass of apple, sweet-lime, lemon, and orange samples, respectively, actual masses being measured using digital weighing balance.
TABLE 2 Estimated and actual values of volume and mass of apple, sweet-lime, lemon, and orange fruits with % deviation
FIGURE 4(a) Comparison of estimated and actual volume of apples.
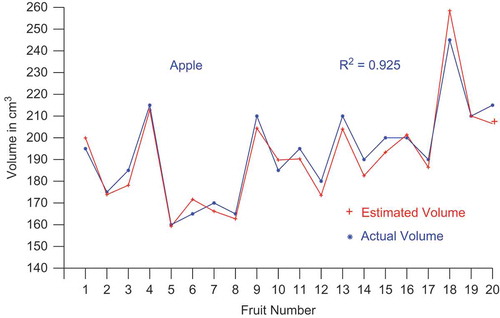
FIGURE 4(b) Comparison of estimated and actual volume of sweet-limes.
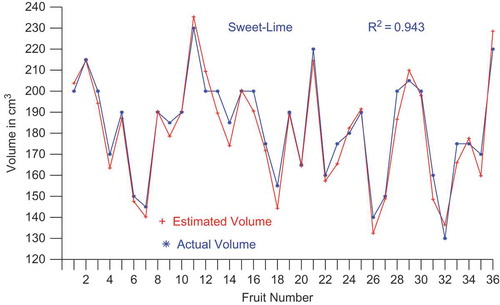
FIGURE 4(c) Comparison of estimated and actual volume of lemons.
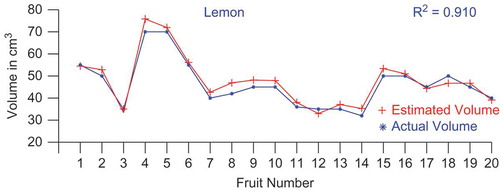
FIGURE 4(d) Comparison of estimated and actual volume of oranges.
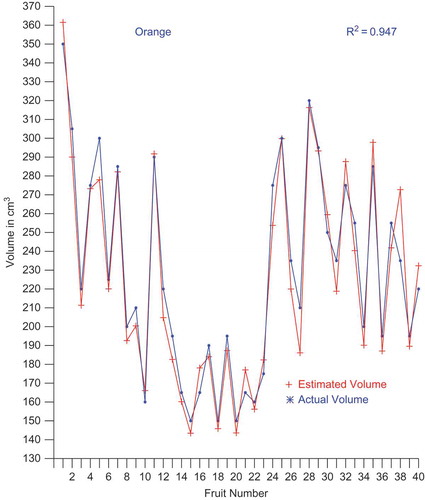
FIGURE 5(a) Comparison of estimated and actual mass of apples.
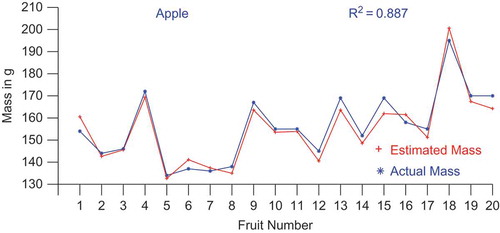
FIGURE 5(b) Comparison of estimated and actual mass of sweet-limes.
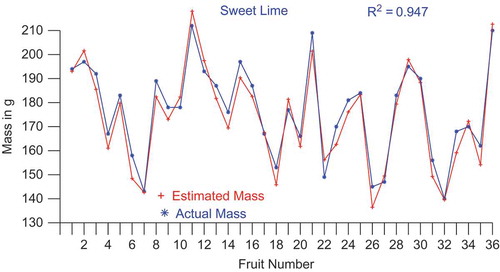
FIGURE 5(c) Comparison of estimated and actual mass of lemons.
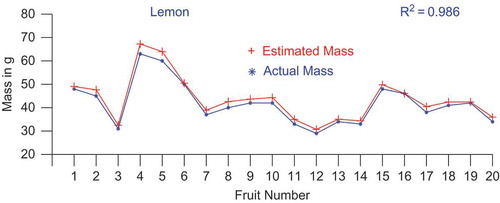
FIGURE 5(d) Comparison of estimated and actual mass of oranges.
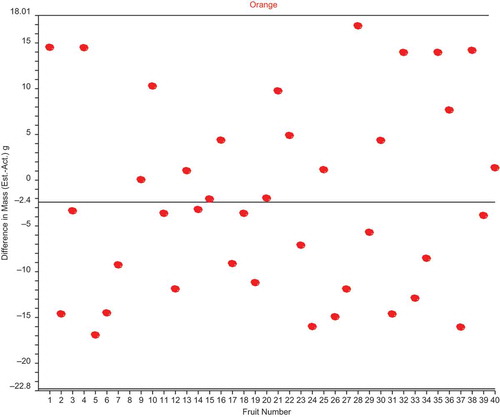
Statistical analysis was done for all the data obtained with 120 fruits to study the extent of deviations. It was found that for apple fruits, the mean deviation for volume measurement was –1.72 cm3 and the 2σ limits were –12.68 cm3 and +9.25 cm3. For sweet-lime, the corresponding mean deviation was –2.84 cm3 and the 2σ limits were –14.78 cm3 and +9.09 cm3. For lemon, the mean deviation was +1.40 cm3 and 2σ limits were –2.56 cm3 and +5.35 cm3. For orange, the mean deviation was –4.34 cm3 and 2σ limits were –25.70 cm3 and +17.02 cm3. Similarly, it was found that for apple fruits, the mean deviation for mass measurement was –1.27 g and the 2σ limits were –11.15 g and +8.61 g. For sweet-lime, the corresponding mean deviation was –2.48 g and the 2σ limits were –12.12 g and +7.17 g. For lemon, the mean deviation was +1.93 g and 2σ limits were –0.15 g and +4.00 g. For orange, the mean deviation was –2.40 g and 2σ limits were –22.80 g and +18.01 g.
The deviations in volume measurement were plotted along with the mean deviation and the ±2σ limits for apple, sweet-lime, lemon, and orange samples as shown in . The deviations for mass measurement were plotted along with the mean deviation and the ±2σ limits for apple, sweet-lime, lemon, and orange samples as shown in . It could be seen that all the deviations were well within ±2σ limits.
FIGURE 6(a) 2–σ plots for the difference in volume (estimated volume–actual volume) of apples.
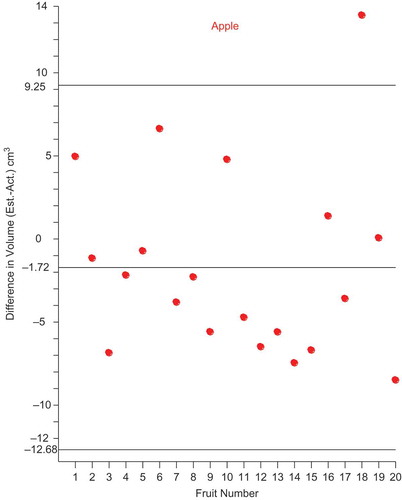
FIGURE 6(b) 2–σ plots for the difference in volume (estimated volume–actual volume) of sweet-limes.
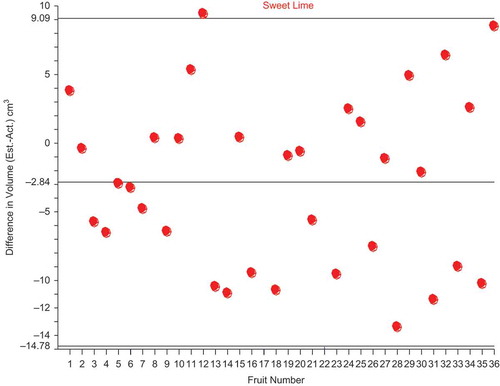
FIGURE 6(c) 2–σ plots for the difference in volume (estimated volume–actual volume) of lemons.
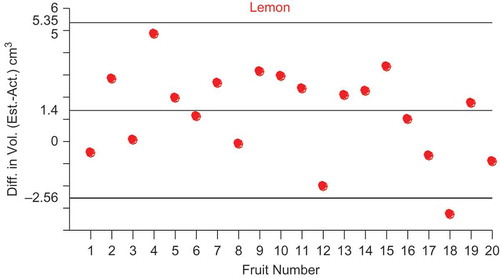
FIGURE 6(d) 2–σ plots for the difference in volume (estimated volume–actual volume) of oranges.
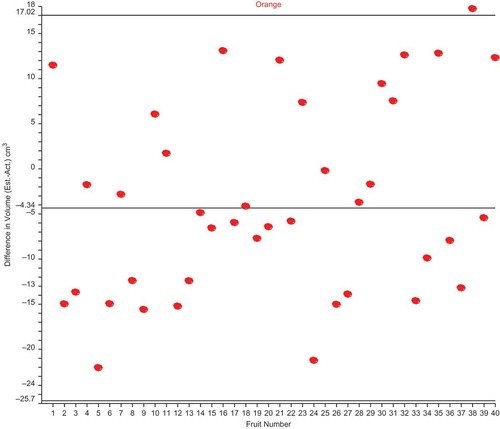
FIGURE 7(a) 2–σ plots for the difference in mass (estimated mass–actual mass) of apples.
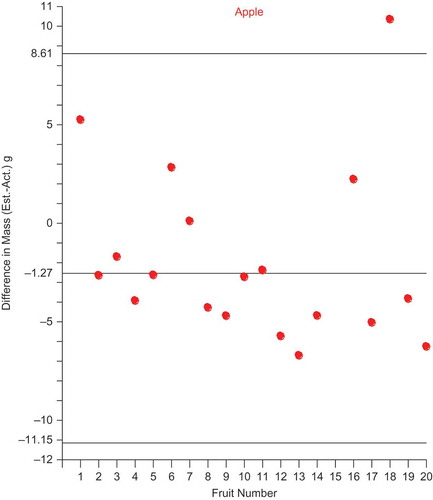
FIGURE 7(b) 2–σ plots for the difference in mass (estimated mass–actual mass) of sweet-limes.
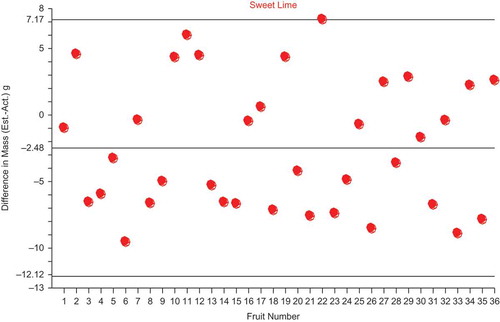
FIGURE 7(c) 2–σ plots for the difference in mass (estimated mass–actual mass) of lemons.

FIGURE 7(d) 2–σ plots for the difference in mass (estimated mass–actual mass) of oranges.
The data was analyzed to check the variance of one variable (either volume or mass) that is predictable from its corresponding measured variable using the co-efficient of determination, R2 because it gives the proportion of the fluctuation. It allows the determination of how close the estimated values are to the measured values of volumes and masses. The coefficient of determination, R2 for the set of measured and estimated volumes and masses for the fruits, namely apples, sweet-limes, lemons, and oranges under consideration were obtained. The value of R2 gives an indication of closeness between the estimated and the measured volumes or masses where R2 = 1 indicates perfect correlation and R2 value close to zero indicate poor correlation.
shows the values of the coefficient of determination (R2) for volume and mass parameters for each category of fruits. The coefficient of determination between measured volume and estimated volume for apple, sweet-lime, lemon, and orange samples were found to be 0.925, 0.943, 0.910, and 0.947, respectively and the coefficient of determination between measured mass and estimated mass for apple, sweet-lime, lemon, and orange samples were found to be 0.887, 0.947, 0.986, and 0.861, respectively. It was found that the coefficient of determination was higher for near spherical fruits like lemon and sweet-lime compared to fruits like orange and apple which are not so spherical.
CONCLUSION
The statistical analysis made above indicate that the proposed methods of volume and mass estimation are reasonably accurate for any type of axi-symmetrical fruits. The analysis showed a better result for paraboloid shaped apples when compared to the results obtained in the earlier analysis made by the authors, Iqbal et al.[Citation21] The deviation in estimation of volumes and masses was less than 10% for any shape of axi-symmetric fruits, namely, spherical, ellipsoid, or paraboloid. The measured and estimated volumes and masses exhibited high correlation as listed in and the corresponding volume and mass differences fall within ±2σ limits as shown in and . From and , it could be seen that the pattern of mass of all the fruits were very much similar to the pattern of corresponding volumes of these fruits. From the forgoing analysis it was observed that by evaluating the shape parameters, the volume and mass of axi-symmetric fruits could be estimated. This will enhance the grading process quickly due to less computation time. Also from the estimated volume and mass of fruits, the maturity of the fruits could be estimated.
The volume and mass estimation methods based on five view image of axi-symmetric fruits using a single camera have the potential to simplify and support the fruit inspection capabilities. By using a single camera, the hardware cost was reduced and the processing time was considerably minimized. This method eliminated the online weight measurement using load-cell and the associated hardwares and software. Open source CV library can be easily embedded with any kind of platform and the execution time of libraries are faster compared to other software. With suitable modifications, the developed methods may be extended for volume and mass estimation of other varieties of fruits having axi-symmetric shape.
TABLE 3 Correlation data of fruit samples
REFERENCES
- Khojastehnazhand, M.; Omid, M.; Tabatabaeefar, A. Determination of tangerine volume using image processing methods. International Journal of Food Properties 2010, 13 (4), 760–770.
- Forbes, K.A.; Tattersfield, G.M. Estimating fruit volume from digital images. IEEE Africon 1999, 1, 107–112.
- Omid, M.; Khojastehnazhand, M.; Tabatabaeefar, A. Estimating volume and mass of citrus fruits by image processing technique. Journal of Food Engineering 2010, 100, 315–321.
- Mohsenin, N.N. Physical Properties of Plants and Animal Materials, Gordon and Breach Science Publishers: New York, NY 1970.
- Laing, A.; Smit, Q.; Mortimer, B.; Tapson, J. Ultrasonic fruit sizing device. Journal of the South African Acoustics Institute 1995, 6, 60–65.
- Dunn, S.M.; Keizer, R.L.; Yu, J. Measuring the area and volume of the human body with structured light, IEEE Transactions on Systems. Man and Cybernetics 1989, 19 (6), 1350–1364.
- Yang, Q. Finding stalk and calyx of apples using structured lighting. Computers and Electronics in Agriculture 1993, 8, 31–42.
- Tillet, R.D.; Onyango, C.M.; Davis, P.F.; Merchant, J.A. Image analysis for biological objects. Third International Conference on Image Processing and its Applications, Warwick, UK, July 18–20, 1989; 207–211.
- Miller, W.M.; Peleg, K.; Briggs, P. Automatic density separation for freeze-damaged citrus. Applied Engineering in Agriculture 1998, 4 (4), 344–348.
- Forbes, K.A.; Tattersfield, G.M. An investigation into the volumetric determination of apples using machine vision techniques. In: PRASA Proceedings of the Ninth Annual South African Workshop on Pattern Recognition Weber, D.M.; Herbst, B.; du Preez, J.A.; Eds.; 1998; 55–59.
- Hahn, F; Sanchez, S. Carrot volume evaluation using imaging algorithms. Journal of Agricultural Engineering Research 2000, 75, 243–249.
- Soltani, M.; Alimardani, R.; Omid, M. A new mathematical modeling of banana fruit and comparison with actual values of dimensional properties. Modern Applied Science 2010, 4 (8), 104–112.
- Babic, L.; Matic-Kekic, S.; Dedovic, N.; Babic, M.; Pavkov, I. Surface area and volume modeling of the Williams pear (Pyrus Communis). International Journal of Food Properties 2012, 15 (4), 880–890.
- Sabliov, C.M.; Boldor, D.; Keener, K.M.; Farkas, B.E. Imaging processing method to determine surface area and volume of axi-symmetric agricultural products. International Journal of Food Properties 2002, 5, 641–653.
- Wan, T.Y.; Nguang, S.K. Low cost sensor for volume and surface area computation of axi-symmetric agricultural products. Journal of Food Engineering 2007, 79, 870–877.
- Lee, D.J.; Eifert, J.D.; Jahn, P.; Westover, B. Fast surface approximation for volume and surface area measurements using distance transform. Optical Engineering 2003, 42 (10), 2947–2955.
- Eifert, J.D.; Sanglay, G.C.; Lee, D.J.; Sumner, S.S.; Pierson, M.D. Prediction of raw produce surface area from weight measurement. Journal of Food Engineering 2006, 74, 552–556.
- Koc, A.B. Determination of watermelon volume using ellipsoid approximation and image processing. Postharvest Biology & Technology 2007, 45 (3), 366–371.
- Khojastehnazhand, M.; Omid, M.; Tabatabaeefar, A. Determination of orange volume and surface area using image processing technique. International Agro Physics 2009, 23, 237–242.
- Tabatabaeefar, A.; Vefagh-Nemotolahee, A.; Rajabipour, A. Modeling of orange mass based on dimensions. Journal of Agricultural Science and Technology 2000, 2, 299–305.
- Md. Iqbal, S.; Gopal, A.; Sarma, A.S.V. Volume estimation of apple fruits using image processing. Proceedings of International Conference on Image Information Processing; 2011. (Published online in IEEE Explorer; Object Identifier: 10.1109/ICIIP.2011.6108909).
- Sudhakara Rao, P.; Md. Iqbal, S.; Gopal, A. A new approach for size determination of apple fruits for automatic sorting and grading. Proceedings of Second International Conference on EIT-2001, Oakland University, USA, June 7–9, 2001 [IEEE Sponsored conference].