
Abstract
Chemometric resolution techniques are implemented to full analysis of Valeriana officinalis L. essential oil with gas chromatography-mass spectrometry. Multivariate curve resolution-alternating least square was used to obtain pure elution and mass spectral profiles of components in peak clusters. Other chemometric resolution techniques were used to overcome the problems of baseline offset, retention time shifts, asymmetric peaks, and overlapped/embedded peaks. The 65 components of the essential oil were identified with gas chromatography-mass spectrometry and direct similarity search. Nevertheless, this number was expanded to 106 components with the aid of chemometrics. The most important identified components of the Iranian Valeriana officinalis L. were Valerianol (12.55%), (Z)-valerenyl acetate (12.19%), valerenal (11.27%), α-kessyl acetate (11.06%), and valeranone (4.11%). Despite previous studies, the result indicated that the chemometric resolution techniques were necessary to obtain the mass spectra and chromatographic profiles of almost all components of the essential oil.
INTRODUCTION
The gas chromatography-mass spectrometry (GC-MS) technique has been proved to be a powerful method for both qualitative identification and quantitative analysis of complex mixtures of essential oils in natural compounds.[Citation1] However, the complexity of the analytical signals and the huge amount of data produced by hyphenated instruments are still obstacles to qualitative identification and quantitative analysis.[Citation2] In many cases, signals of compounds are overlapped or embedded with coexistent components, making the detection very hard, and even impossible.[Citation3] In GC-MS analysis, the components are solely identified by the direct similarity searches in mass spectrometry (MS) databases connected to the instrument. Even with the best experimental conditions, the baseline offset, background, retention time shifts, asymmetric peaks, and some overlapping/embedded peaks may exist in complex mixtures analysis causing mistaken similarity matches in the MS library and exact qualitative identification and quantitative analysis of components.[Citation4] Although many experimental efforts have been made to improve the throughput of hyphenated chromatographic techniques using advanced technologies, it is not possible to obtain maximum information from the instrument and the interpretation of the results without using suitable data analysis tools. Chemometrics has provided an alternative way for improving the efficiency of hyphenated chromatographic techniques. In fact, chemometric resolution techniques can be of great help for extracting hidden information from the multicomponent overlapping/embedding signals. Fortunately, in recent decade, different chemometric resolution methods such as morphological score, subspace comparison, orthogonal projection approach (OPA), simple-to-use interactive self-modeling mixture analysis (SIMPLISMA), evolving factor analysis (EFA), fixed size moving window-evolving factor analysis (FSMW-EFA) and multivariate curve resolution-alternating least square (MCR-ALS)[Citation4,Citation5] have been proposed to compensate the lack of selectivity problem in chromatographic systems and to obtain pure chromatographic and spectroscopic profiles of components in complex mixtures.
As a traditional herbal medicine, Valeriana officinalis L. essential oil is used for the preparation of phytomedicines that are employed as mild traditional sedatives, antianxiety, digestive, and antispasmodic formulations.[Citation6] Valerian essential oils are used in the formulations of personal care products, cosmetics, aromatherapy, and veterinary practices. They are also packed in cloth bags and put around stored grain, fruits, berries, or vegetables to fend off insects, rodents, and other damaging animals. Valerian essential oils have been used to treat mild or moderate insomnia in Europe and America.[Citation7] The US Food and Drug Administration (FDA) lists valerian as a food supplement, and regulatory control of valerian is limited to labeling requirements. The German Commission approves the use of valerian for the treatment of insomnia and restlessness without any specific contraindications.[Citation6,Citation7] There were some articles that identified some of components of the essential oils including monoterpenes, sesquiterpenes, and their oxygenated derivatives in different regions without using any chemometrics resolution technique.[Citation8−Citation10] All previous studies analyze the essential oil, as a complex sample, through the direct similarity searches in MS databases which may mislead to the wrong identification due to presence of overlapped/embedded peak clusters. To the best of the author’s knowledge, so far the components of Valeriana officinalis L. essential oil has not been identified implementing chemometric resolution techniques in the GC-MS data. Therefore, the main aim of the present work was to identify and determine the components of Valeriana officinalis L. essential oil using GC-MS combined with the mentioned chemometric resolution techniques. The morphological score and subspace comparison were used for chemical rank determination of GC-MS data. In addition, MCR-ALS method was successfully applied for the resolution of chromatographic and mass spectra profiles of components in Valeriana officinalis L. essential oil.
MATERIALS AND METHODS
Isolation of the Essential Oil
The 30 g of dried Valeriana officinalis L. roots were fully submerged in water in a 1000 mL round bottom flask. The mixture was hydro-distilled (HD) in a full glass Clevenger-type apparatus for 3.5 h. When the system cooled down, the essential oil was decanted from the water and dried with anhydrous sodium sulfate until the last traces of water were removed. To improve the recovery, the essential oil was taken upin n-hexane and stored in a dark glassbottle at 5°C. The extraction yield was 1.62%.
Analysis and Identification
GC-MS analysis of Valeriana officinalis L. essential oil was carried out on Agilent HP-6890 gas chromatograph coupled with Agilent HP‐5973 mass selective detector equipped with a HP-5MS fused silica column (30 m × 0.25 mm i.d., 0.25 μm film thickness). Operating conditions were as follows: Carrier gas, He (99.999%), with a flow rate of 1 mL min−1; injector temperature, 200°C; detector temperature, 250°C; split ratio, 1:20. Mass spectra were taken at 70 eV. Oven temperature was started at 50°C, held for 1 min then programmed to 250°C at a rate of 3°C/min, held for 10 min. Mass range was from 40 to 550 amu. After implementing curve resolution techniques, the components of the essential oil were identified by comparing of their mass spectra fragmentation patterns with those stored on the Wiley 7n.1 MS and NIST v1.7 (National Institute of Standards and Technology, Gaithersburg, MD) built up using pure substances and confirmed by comparison of their retention indices.[Citation3,Citation8−Citation10] The Kovats retention indices of all the components were obtained using GC-FID by logarithmic interpolation between bracketing n-alkanes.
Analysis of GC-MS Data Using Chemometric Techniques
The following steps show the general framework of the strategy proposed in this work for analysis of Valeriana officinalis L. essential oil. The following steps were performed for every overlapped peak cluster as a subset of the total ion chromatogram (TIC):
Data processing: The TIC of the essential oil is very complicated due to the large number of components. This step includes baseline correction, de-noising, and smoothing. Congruence analysis and least square fitting were used to remove the baseline drift and spectral background in the chromatographic data. In addition to the background in GC-MS data, there are white and heteroscedastic noises that can interfere in the identification and quantification of components of Valeriana officinalis L. GC-MS data acquired in full scan mode contains many noise channels. The white noises from the data were removed using morphological score to discriminate between the noises and the signal channels. The GC-MS data was also smoothed to transform heteroscedastic noise to homoscedastic one.
Determination the chemical rank: Morphological score and subspace comparison (PCA, OPA, and SIMPLISMA) methods were used to determine the correct number of chemical components. In this method, key spectra were used instead of full rank matrices in order to acquire more reliable results.
Local rank analysis: The peak purity of two-way data can be controlled by FSMW-EFA plot. Using this technique, selective regions, zero component regions (ZCR) and overlapped regions were determined for each peak cluster.
Resolution: MCR-ALS is a powerful curve resolution technique which performs the bilinear decomposition of a data matrix in the product of two factor data matrices using alternating least squares. In the case of GC-MS data, one of the factor matrices contains the resolved chromatographic profiles of the coeluted compounds and the other factor matrix contains the resolved pure mass spectra of these coeluted compounds. The method of MCR-ALS calculates the chromatographic and mass spectra profiles of the components in the peak clusters using the confirmed number of chemical components and information of local rank analysis. This algorithm starts with initial estimates obtained by the SIMPLISMA, EFA or OPA and proper constraints until the concentration and pure spectra optimally fit in the experimental data matrix.
Validation of the results: The reliability and quality of the resolved profiles can be confirmed using spectral similarity match with MS database.
RESULTS AND DISCUSSION
The TIC of the Valeriana officinalis L. essential oil is shown in . There is the probability of finding some embedded or overlapped peaks in the TIC. The similarity indices (SIs) are very low for many chromatographic peaks obtained from direct MS database searching. Also, one can obtain different compounds at different scan points of a single peak using library searching. The traditional searching based on MS database would fail if the overlapped/embedded peaks could not be resolved. Roughly, there are 61 detached peaks for Valeriana officinalis L. Therefore, the measured matrix was divided into 61 subsets using ZCR along elution sequence for this essential oil. Due to the overlapped or embedded peaks, SIs obtained from direct searching with the MS database was quite low for many of these peaks. So, the overlapped/embedded peaks must be resolved into pure chromatographic profiles and mass spectra for the qualitative and quantitative analyses. In order to illustrate the resolution procedure one peak cluster (X) was selected as an example having retention time range from 38.37 to 38.98 min (Scans: 5547–5202). The local TIC of the peak cluster X is shown in .
FIGURE 1 TIC for Iranian Valeriana officinalis L. essential oil. Subset (peak cluster X) was used for showing MCR procedure.
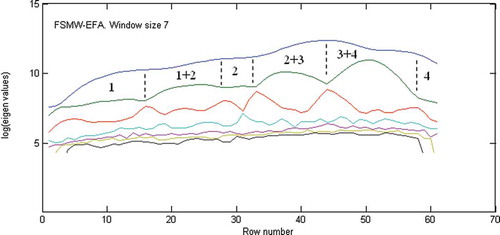
Prior to starting the chemometric resolution techniques, baseline correction, de-noising and smoothing performed for the peak cluster. Then the chemical rank in the peak cluster X was determined using morphological score plot as shown in . This was concluded by counting the number of singular vectors with the morphological scores higher than that of the noise levels. Due to the accumulation of noise in GC-MS data it is often difficult to arrive at safe results using just one method. Therefore subspace comparison is also utilized for determination of the chemical rank. In order to reduce the noise effects, key spectra instead of full rank matrices are analyzed in subspace comparison and morphological score. The results of PCA-SIMPLISMA, OPA-SIMPLISMA, and PCA-OPA subspace plots are shown in a, 3b, and 3c, respectively. The correct number of chemical components in the peak cluster X is four as indicated in and . After chemical rank determination, the peak purity resolution of two-dimensional data (local rank analysis) was controlled using the FSMW-EFA method as shown in . In FSMW-EFA plot, the logarithmic curve of eigen values higher than the noise level represents the presence of a new component. If a system contains only one species, only one curve is higher than the noise level in its FSMW-EFA plot. It should be noted that the window size is an important parameter in this plot and must be optimized. From , one can get some information about the local ranks and patterns of elution for the peak cluster X (the window size was 7). This figure also shows that there are four components for the peak cluster X (marked by numbers) which strongly confirmed the results obtained from chemical rank determination.
FIGURE 2 Morphological score plot for the peak cluster X.
FIGURE 3 Subspace plot for the peak cluster X: (a) comparison between PCA scores and SIMPLISMA variables, (b) comparison between OPA variables with SIMPLISMA variables, and (c) comparison between PCA scores and OPA variables.
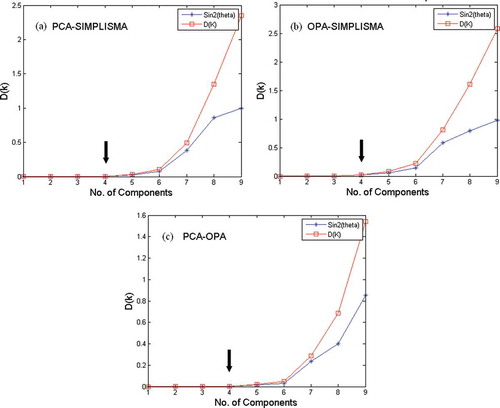
FIGURE 4 FSMW-EFA plot for the peak cluster X after heteroscedastic noise correction.
After the determination of chromatographic elution order, the number of components in the peak cluster X, selective regions and ZCR of components, the two dimensional data matrix has been uniquely resolved into chromatographic profiles and mass spectra of related components. For resolving the peak clusters, MCR-ALS method was applied. For cases without selective regions, the MCR-ALS method has been used with initial estimates of chromatographic profile obtained by EFA or SIMPLISMA together with non-negativity, unimodality, and selectivity constraints. The resolved chromatogram of the peak cluster X is shown in . Afterwards, the components can be identified by similarity searches using the NIST mass database and can be verified with retention indices. Similarity searches in the MS database revealed the components in the peak cluster X are 13-ol-8-cedren, guaiol, cubenol, and α-copaen-11-ol. Consistency and reliability of this resolution technique was demonstrated by similarity between the mass spectra of these compounds with those of their counterpart standards. As an example, the standard mass spectrum and resolved mass spectrum of cubenolinthe peak cluster X are shown in . As this figure shows there is a good agreement between (a) standard mass spectrum, and (b) resolved mass spectrum. For all other peak clusters the above procedure were performed as explained. Consequently, a total of 106 components were identified in the present contribution, from which 41 components identified by resolving peak clusters using MCR-ALS method. shows the obtained chemical components of the Valeriana officinalis L. essential oil implementing the chemometric resolution techniques in GC-MS data. There are few reports on analyzing the Valeriana officinalis L. using GC-MS without using any MCR techniques.[Citation8−Citation10] For the sake of comparison, the numbers of identified components of the Valeriana officinalis L. essential oil reported by previous works are listed in . As this table shows, the number of components of this study is more than that of all previous reports. It should be mentioned that the presence of the noise, background and overlapped/embedded peaks decreases the MS similarity in GC-MS. Hence, the use of curve resolution techniques may improve the identification of components obtained from the GC-MS data.
TABLE 1 Chemical components of Iranian Valeriana officinalis L. essential oil implementing chemometrics resolution techniques in GC-MS data
TABLE 2 Comparison between HD-GC-MS-MCR and other methods for identification of Valeriana officinalis L. essential oil components
FIGURE 5 The resolved concentration profiles of the peak cluster X.
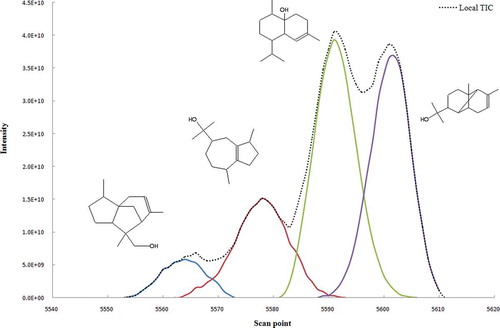
FIGURE 6 (a) The standard mass spectrum and (b) resolved mass spectrum of Cubenol in peak cluster X.
The quantitative analysis of chemical components of the essential oil, the peak area integration at every m/z point for each component was calculated. Its sum is called the overall volume integration (OVI)[Citation5] which is directly proportional to the concentration of the components. The reason for using this method in this work was unavailability of many standards for the essential oil components. The advantage of this method prior to the peak area integration and peak splitting is that all mass spectra absorbing points are taken into consideration and much more accurate results can be reached. The final relative quantitative values of the Valeriana officinalis L. essential oil components are presented in . These components account for 98.71% of the total relative content. Also, the reproducibility in peak responses was investigated using three replicate experiments (n = 3). The relative standard deviations (RSD) for the components are presented in . As this table shows, the most important components of the Iranian Valeriana officinalis L. essential oil are valerianol (12.55%), (Z)-valerenyl acetate (12.19%), valerenal (11.27%), α-kessyl acetate (11.06%), and valeranone (4.11%).
CONCLUSIONS
There is a high possibility that the overlapped/embedded peaks can result in incorrect similarity matches in the MS library for complex mixtures such as Valeriana officinalis L. essential oils. Therefore, the combined approach of GC-MS with chemometric resolution methods was utilized for the first time to analyze the essential oil components of the Iranian Valeriana officinalis L. in the present contribution. A total of 106 components with concentrations higher than 0.01% were resolved using above techniques. Only 65 components were identified using MS database without using chemometric resolution techniques. Furthermore, the identification and determination of highly overlapped/embedded peaks is possible using subspace comparison, morphological score and MCR-ALS methods as chemometric resolving methods. Finally, it can be concluded that the combination of hyphenated chromatographic techniques with MCR methods can open a new window for quick and accurate analysis of the complex mixtures such as Valeriana officinalis L. essential oil.
REFERENCES
- Augusto, F.; Hantao, L.W.; Aleme, H.G.; Pedroso, M.P.; Sabin, G.P.; Poppi, R.J. Multivariate curve resolution combined with gas chromatography to enhance analytical separation in complex samples: A review. Analytica Chimica Acta 2012, 731, 11–23.
- Konoz, E.; Abbasi, A.; Parastar, H.; Moazeni, R.S.; Jalali-Heravi, M. Analysis of olive fruit essential oil: Application of gas chromatography-mass spectrometry combined with chemometrics. International Journal of Food Properties 2013, DOI:10.1080/10942912.2012.687797.
- Jalali-Heravi, M.; Moazeni, R.S.; Sereshti, H. Analysis of Iranian rosemary essential oil: Application of gas chromatography-mass spectrometry combined with chemometrics. Journal of Chromatography A 2011, 1218, 2569–2576.
- Gemperline, P. Practical Guide to Chemometrics, 2nd Ed; CRC Press/Taylor & Francis Groups: Boca Raton, FL, 2006.
- Brown, S.D.; Tauler, R.; Walczak, B. Comprehensive Chemometrics: Chemical and Biochemical Data Analysis, Vol. 2, Elsevier: Amsterdam, Netherlands, 2009.
- Tlili, N.; Elfallehb, W.; Hannachib, H.; Yahiab, Y.; Khaldic, A.; Ferchichib, A.; Nasria, N. Screening of natural antioxidants from selected medicinal plants. International Journal of Food Properties 2013, 16, 1117–1126.
- Singh, N.; Gupta, A.P.; Singh, B.; Kaul, V.K. Quantification of Valerenic acid in Valeriana jatamansi and Valeriana officinalis by HPTLC. Chromatographia 2006, 63, 209–213.
- Fatemi, S.; Safaralie, A.; Sefidkon, F. Essential oil composition of Valeriana officinalis L. roots cultivated in Iran comparative analysis between supercritical CO2 extraction and hydrodistillation. Journal of Chromatography A 2008, 1180, 159–164.
- Baranauskiene, R. Essential oil composition of Valeriana officinalis ssp. officinalis grown in Lithuania. Chemistry of Natural Compounds 2007, 43, 331–333.
- Huang, B.; Qin, L.; Chu, Q.; Zhang, Q.; Gao, L.; Zheng, H. Comparison of headspace SPME with hydrodistillation and SFE for analysis of the volatile components of the roots of Valerianaofficinalis var. latifolia. Chromatographia 2009, 69, 489–496.