
Abstract
Principal component analysis and hierarchical cluster analysis were applied to investigate physicochemical and instrumental textural properties of fresh kashar cheese. Four different principal components sufficiently explained the variability in the cheese samples. In addition, hierarchical cluster analysis was performed to group the kashar cheese samples regarding physicochemical and instrumental textural properties. Instrumental textural properties indicated greater variability than chemical composition of cheese samples. Principal component analysis revealed that color parameters were positively correlated with textural and chemical parameters. The results of this study revealed that other parameters rather than chemical composition would be effective on the instrumental textural properties. It was proved that principal component analysis was a very effective statistical tool to determine quality of cheese samples. According to the principal component analysis and hierarchical cluster analysis results, the attributes defining the kashar cheese samples were determined to be primarily the texture profile analysis parameters.
INTRODUCTION
Cheese is an indispensable dairy product in breakfast throughout the world. More than 1000 cheese varieties are produced and consumed in the world.[Citation1] Kashar cheese is one of the traditional cheese types widely consumed in Turkey and other bordering countries. In Balkan countries, similar cheeses (pasta-filata type cheeses) are extensively manufactured and known as “Kashkaval.”[Citation2,Citation3] Kashar cheese is classified as fresh and old based on ripening periods. Old or matured kashar cheese is ripened at least 90 days while fresh kashar cheese is sold without ripening.[Citation4] The production and consumption of fresh kashar cheese has increased in recent years due to economical factors.[Citation5] They can also be used in toasted sandwiches and baked foods like pizza.[Citation6] Many different fresh kashar cheeses are available in the market. Its physicochemical and instrumental textural characteristics determine quality or consumer preference; therefore, determination and labeling of these properties are important. Chemical composition and instrumental textural properties of kashar cheese samples depend mainly on milk type, milk composition, and production methods as well as many other factors involving cheese, biochemical changes occurred throughout ripening,[Citation7] pH, moisture and salt content,[Citation8] and proteolysis causing to form peptides having different molecular weights by breaking down casein.[Citation9]
Texture is the quality attribute important for evaluation of product quality and acceptability.[Citation10] Textural characteristics of the foods are determined by sensory and instrumental analysis. In recent years, instrumental analysis has been performed to assess textural properties since it provides objective results and repeatability. Instrumental textural properties of the product are important for quality control and product development.[Citation11] In addition, sensory response to a mechanical stimulus of food is nonlinear and is affected by several factors involving adaptation and fatigue,[Citation12] training level of the participants.[Citation13] There are several methods used in the food industry to determine textural properties. Texture profile analysis is one of the methods widely performed to determine hardness, adhesiveness, springiness, cohesiveness, gumminess, chewiness, and resilience values of the food products.
Principal component analysis (PCA) works based on transformation of the original variables into new axes or principal components (PCs). Thanks to its orthogonality, data presented in the axes are not correlated with each other. By applying PCA, it is possible to express maximum total variation in data set in only a few PCs and represent the decrease of the variation.[Citation14] Hierarchical cluster analysis (HCA) is also very useful to cluster food samples regarding dissimilarities without considering information about the class membership.[Citation15] In the literature there are a great number of studies focusing on the textural properties of different cheese samples. However, no study has appeared so far on the classification of kashar cheese samples and identification of the most important principal components with respect to textural parameters. Therefore, the aim of the present study was to determine physicochemical and textural properties of the 30 brands of kashar cheese samples manufactured in Turkey. PCA was conducted based on the correlation parameters to reduce the number of parameters, which might explain most of the variability. In addition, HCA was used to classify cheese samples based on physicochemical and textural properties.
MATERIALS AND METHODS
Materials
Thirty different fresh kashar cheese samples were collected from local markets in Kayseri, Turkey. The collected samples were kept in a dry and dark place and stored at 0−4°C in order to minimize any deteriorative changes in the proximate composition of the samples until their analysis.
Physicochemical Properties
Before chemical analysis, the cheese samples were ground and homogenized to achieve homogeneity. Dry matter and protein contents of the samples were determined as outlined.[Citation16] Dry matter contents were determined by drying in an oven (Nüve FN 120, Ankara, Turkey) at 105°C for 3 h. Protein contents were determined based on the Dumas method using an automatic nitrogen analyzer (FP 528 LECO, ABD). The Gerber method was used for detection of fat contents. Color measurements were performed at 20°C using a chroma meter (Lovibond RT Series Reflectance Tintometer, England). The L, a (±red–green), and b (±yellow–blue) color coordinates were determined according to the CIELab color space system. Measurements were made directly on the cheese samples and carried out three times, one on the middle and two on different parts of the samples. Each analysis was conducted in duplicate with three replications.
Instrumental Texture Profile Analysis (TPA)
Instrumental texture profile analysis (TPA) of the samples was conducted at 25°C using a TA-XT2 texture analyzer (Stable Micro Systems, Surrey, UK) equipped with a 25-kg load cell, cylindrical aluminum probe (aluminum cylinder probe P/50, 50 mm diameter; Stable Micro Systems LTD, Godalming, UK). Prior to the textural analysis, samples were cut into a cube (2 × 2 × 2 cm3). A cylindrical aluminum probe (P/50, 50 mm diameter; Stable Micro Systems LTD, Godalming, UK) was used. Pre-test, test, and post-test speeds were adjusted to be 5, 1, and 5 mm/s, respectively. Deformation type applied to samples during analysis was selected as strain and set to be 50%. Five replicates were conducted to determine the TPA profile of each kashar cheese sample. The following parameters were quantified:[Citation17] Hardness (g) defined as maximum force required to compress the sample in texture profile analysis; adhesiveness [g (force) × s (second)] under the baseline after the first compression in texture profile analysis; springiness (mm), ability of the sample to recover its original form after deforming force is removed in texture profile analysis; resilience, the calculation is the area during the withdrawal of the first compression, divided by the area of the first compression; cohesiveness, extent to which the sample could be deformed prior to rupture in texture profile analysis (Area 2/Area 1, Area 1 was the total energy required for the first compression and Area 2 the total energy required for the second compression); gumminess (g), hardness × cohesiveness; chewiness (g × mm), work required to masticate the sample before swallowing (calculated parameter was hardness × cohesiveness × springiness).
Statistical Analyses
The average values of each parameter were calculated by using SPSS statistical software (Version 16.0, SPSS Inc., Chicago, IL, USA) and reported as mean ± standard deviation. Principal component analysis (PCA) and hierarchical clustering analysis (HCA) were performed using XLSTAT Software (XLSTAT, 2008, Addinsoft, New York, NY, USA) to categorize the kashar cheese samples based on their physicochemical (chemical and color) and textural characteristics. In addition, correlations among the physicochemical and textural characteristics were determined using the Pearson correlation method using the XLSTAT software.
RESULTS AND DISCUSSION
Physicochemical Properties
In the classification of cheese samples, physicochemical properties are one of the most important descriptive properties. Dry matter, fat, and protein contents as well as color properties (L, a, and b values) for characterizing the variability in cheese samples are demonstrated in . Significant differences were found in dry matter, fat, and protein contents and L, a, and b values among 30 cheese samples.
TABLE 1 Chemical composition, color values, and TPA parameters of kashar cheese samples
Dry matter contents ranged between 51.47 and 61.58 g/100 g sample (). It was clear that dry matter content varied remarkably among the kashar cheese samples, which was thought to result from composition of milk used in kashar production, ripening period, and processing conditions like cooking and molding. In addition, porous structure of the kashar is also an important factor,[Citation18] which affects transfer of water from sample to environment. Fat (in dry matter) contents of the kashar cheese samples ranged between 25.78 and 51.57 g/100 g sample (). As can be seen from , there were remarkable differences among the fat contents of the samples. Consistent results were reported in the literature.[Citation19,Citation20] Kashar cheese samples are classified as full fat or low fat regarding fat content. According to the kashar regulations released by Turkish Standard Institute (1995), a full fat kashar cheese should include at least 45% fat in dry matter content.[Citation4] Therefore, in this study, approximately 82.22% of the kashar samples were classified as full fat kashar cheese. Protein contents varied between 19.90–28.40 g/100 g sample. The differences among protein contents could be attributed to the differences in compositions of the milk processed to kashar and ripening conditions. Total protein and fat content in dry matter changed between 78.06 g/100 g sample and 96.47 g/100 g sample. The remaining part might be composed of salt and mineral content. Salt content of different kashar cheese samples were found to be 2.8 g/100 g sample[Citation21] and 1.1–6.0 g/100 g sample[Citation22] in different studies. Regarding color values, L, a, and b values were measured between 63.90 and 79.03, –1.19 and 1.18, 7.04 and 21.44, respectively. Differences in the composition of the cheese samples, especially fat content, could be kept responsible for the differences among the color values.
Instrumental Textural Properties of the Kashar Cheese Sample
Instrumental texture profile analysis (TPA) parameters (e.g., hardness, adhesiveness, springiness, cohesiveness, gumminess, chewiness, and resilience) of the kashar cheese samples are shown in . Hardness, adhesiveness, gumminess, and chewiness values were determined to range from 34.76 to 112.6 N, -0.310 to -1.176 N × s, 20.50 to 66.28 N, and 0.0127 to 0.0530 N × m, respectively, indicating that there were remarkable differences among the values of the cheese samples. On the other hand, springiness, cohesiveness, and resilience values varied from 0.54 to 0.86 mm, 0.37 to 0.74, and 0.11 to 0.32, respectively, showing that there were also differences among these values of cheese samples; however, these differences were not as remarkable as those among the hardness, adhesiveness, gumminess, or chewiness values of the cheese samples.
Chewiness value is an important quality parameter affecting acceptability of the consumer for the product. As is known, generally old people want to exert a lower effort to chew; therefore, they would prefer cheese samples having less chewiness values. In other words, chewiness is a parameter that simulates the quantity of the energy required for masticating the sample until swallowing.[Citation23] Gumminess and chewiness depend on hardness, cohesiveness, and springiness;[Citation17,Citation24,Citation25] therefore, the factors affecting the hardness should be expected to affect these parameters. Based on these reports, it can be said that the great variations among the hardness, adhesiveness, gumminess, and chewiness values of the cheese samples in this study () should also mean that there were great variations among the compression forces and other forces required to remove cheese from the contact surface of the mouth as well as efforts to exert to chew.
Springiness value is important for determination of the elastic or plastic characteristic of the cheese samples.[Citation26] Cohesiveness value of the cheese is related with the strength of the internal bonds of the protein mycelium.[Citation26] Therefore, relatively smaller variations among these mechanical variables of the cheese samples indicate that there might be also differences among abilities of the cheese samples to recover and strengths of the internal bonds of the protein mycelium of each cheese sample.
Correlation Analysis
showed the correlation coefficients among the 13 variables. There were several significant correlative parameters among the variables. For example, there were positive and negative correlations among brightness (L values) and textural properties, redness and yellowness, and chemical properties. Brightness was positively correlated with four mechanical variables (hardness, springiness, gumminess, and chewiness), but negatively correlated with adhesiveness. Brightness was also correlated with dry matter and protein contents; but these were negative correlations (). In addition, there were negative correlations among redness-yellowness and protein contents. The results of correlation analysis revealed that brightness of the kashar cheese samples may be an indicator parameter, reflecting instrumental textural properties and chemical composition of cheese samples.
TABLE 2 Correlations between the parameters
Regarding correlations among the TPA parameters, significant correlations were found. For example, hardness was found to be negatively correlated with adhesiveness and positively correlated with springiness, chewiness, and gumminess. To summarize, each TPA parameter was positively with the other; however, adhesiveness was the only parameter that was negatively correlated with the others (). These results can be expected because each parameter should be inherently related with the other.
On the other hand, it was also interesting that no significant correlations were found among chemical composition (moisture, fat, and protein content) and instrumental textural parameters of the cheese samples. These results were found to be interesting because proximate compositions, like protein and moisture contents, are known to have some effects on, at least, hardness values. In other words, it was thought at the first sight that chemical composition should necessarily play a role on the textural parameters. As a matter of fact, in the literature, some correlations were reported among the chemical composition and TPA parameters. But these reports were somewhat controversial. For example, a positive correlation was reported between dry matter content and cohesiveness value,[Citation27] while a negative correlation was reported by Delgado et al.[Citation28] Also, a negative correlation between fat content and cohesiveness value was reported.[Citation29] However, our results did not reveal such correlations among the chemical composition and instrumental textural parameters. Therefore, the correlation analysis in this study led us to think that some factors other than chemical composition must have had an effect on the instrumental textural parameters. Accordingly, Upreti et al.[Citation30] reported that fat type, proteolysis degree during ripening, moisture content, and pH value of the kashar cheese samples are also other important factors, which might affect hardness values. In the literature, concrete results of interest were reported by Karaman and Akalın[Citation27] who determined that an increase in the degree of proteolysis during ripening caused a decrease in hardness values of the cheese sample. Furthermore, the level of proteolysis was reported to vary depending on the cheese type; therefore, each type of cheese has a specific pattern of proteolysis, leading to classification of cheeses using proteolytic data.[Citation31] In addition, positive correlations between salt contents and hardness values were reported.[Citation32] The amount and structure of protein network (cross-linkages in the protein matrix) as well as polar characteristics of the fat are the other factors affecting instrumental textural properties of the kashar cheese samples.[Citation26,Citation33,Citation34]
Further factors influencing the TPA parameters were reported in the literature. Dinkçi et al.[Citation24] reported that cohesiveness value of the cheese samples might be influenced from several factors, such as intermolecular associations of casein, hydrophobic characteristics of the fat types found in the formulation, and production techniques. In addition, ripening period of the cheese sample was also thought to be one of the factors affecting the cohesiveness values. However, controversial information was reported in the literature. Awad et al.[Citation7] reported that cohesiveness value of the cheese samples decreased during ripening, while Özer et al.[Citation35] and Tamime et al.[Citation36] reported opposite results, revealing that cohesiveness value of cheese samples increased during a prolonged storage period.
PCA Analysis
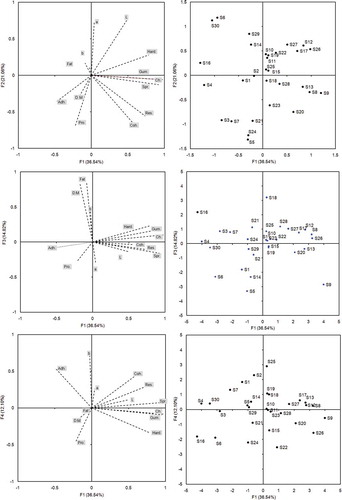
In the literature, PCA and cluster analysis were successfully used to relate instrumental textural properties of some food materials with different quality levels to physicochemical properties.[Citation11] In this study, it was aimed to classify the cheese samples based on their instrumental textural properties related to physicochemical properties. For this purpose, PCA was applied to classify the kashar cheese samples using physicochemical and instrumental textural data listed in . Using the cross-validation technique, four PCs were established to be significant for explanation of total variability of physicochemical and instrumental textural properties. shows the eigen values and variance values of each PC. As can be seen, eigen values of the PC1–PC4 were found to be higher than 1, indicating that they were adequate for description of the variance in the data set given the Kaiser’s rule. PC1, PC2, PC3, and PC4 accounted for 36.54, 21.06, 14.82, and 12.10% of total 100% variability, respectively, in the data set. In other words, 84.52% of the total variance in the 13 tested variables can be condensed into four new variables (PCs). This percentage can be considered to be sufficient for explanation of the variability since it was higher than 70%.[Citation37] PC coefficients (loadings) of the significant principal components and their contributions are shown in . According to , the parameters explained the variation of the PCs, as follows:
TABLE 3 Results of PCA analysis using data of physicochemical and textural properties of the kashar cheese samples
TABLE 4 Principal component coefficients (loadings) and their contributions
| PC1: | = | Hardness, springiness, gumminess, chewiness, and resilience; |
| PC2: | = | Protein, L and a values, and cohesiveness; |
| PC3: | = | Dry matter and fat; |
| PC4: | = | b value and adhesiveness. |
These results showed that the most important variables for the first PC were the textural parameters (except for adhesiveness and cohesiveness). Therefore, the first PC was defined as the textural quality. The PC2 and PC3 were mainly characterized by physicochemical properties except for b values. Finally, b values and adhesiveness are important for the PC4.
Score plots and loading PCs are shown in , where F1-F2, F1-F3, and F1-F4 plots are also presented. From the F1-F2 score plot, it appears that L value was positively related to hardness, gumminess, and a value because they were located on the same quadrant. Except for adhesiveness, all of the instrumental texture parameters fell in the right-hand area of PC1. Among the six textural parameters, cohesiveness, resilience, springiness, and chewiness were inherently opposite from the others because they are located in the opposite side as compared to the other two textural parameters (hardness and gumminess) on the score plot. Regarding sample clustering results, loading PCs revealed that the samples coded with S10, S11, S15, S19, S22, and S25 clustered on the upper right quadrant of the F1-F2 plot, resulting from their L values ranging between 73.78 and 77.66. S5, S21, and S24 were located on the lower left quadrant on the F1-F2 plot due to their high protein contents. The clustering on the upper right quadrant of the F1-F3 plot resulted from the significant correlations among hardness, gumminess, and cohesiveness. The observed relations from these score plots were previously explained by the correlation analysis ().
FIGURE 1 Plot of the PCs loading and score vectors.
Hierarchical Cluster Analysis (HCA)
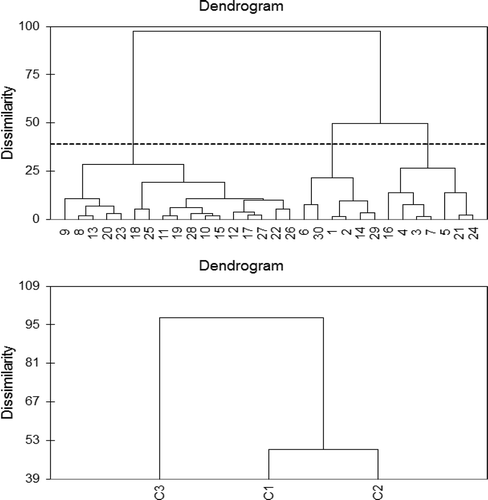
HCA was performed to classify the kashar cheese samples regarding dissimilarities without considering information about the class membership.[Citation15] shows the dendrogram obtained from HCA. As can be seen from the figure, three different clusters were observed. Protein and adhesiveness of the kashar cheese samples were important parameters for formation of the cluster 1. Cluster 2 was formed regarding fat and dry matter. The other cluster (C3) was formed based on the instrumental textural parameters except for adhesiveness value. The PCA and HCA results were similar regarding classification of the kashar cheese samples based on their textural and physicochemical properties.
FIGURE 2 Dendrogram for the hierarchical cluster analysis (HCA) results using Ward’s clustering algorithm with Euclidian distance.
CONCLUSIONS
The attributes defining the kashar cheese samples were determined to be primarily the TPA parameters. There were remarkable correlations among color parameters and instrumental textural properties. However, no clear correlations among chemical composition and instrumental textural parameters were found due to many aforementioned factors affecting the instrumental textural parameters, simultaneously. PCA proved to be very successful to determine the most effective variables and to reveal relationships among the variables. By the first four PCs, 84.52% of the total variance in the 13 considered variables could be explained. The differences among the brands could be well distinguished by the PCA score plots. These results were also proved by the HCA, confirming the PCA correlations. The results in this study might be useful to understand which physicochemical properties would contribute to the texture of cheese samples, helping to choose cheeses with desired textural attributes and should facilitate local and international trade of cheeses by providing a basis for the development of a clear classification of cheeses.
FUNDING
The authors would like to thank the Scientific Research Projects (Project no: 2012-07-05-KAP01 İstanbul, Turkey) of Yıldız Technical University Coordinating Office for financial support.
REFERENCES
- Hayaloglu, A.A.; Guven, M.; Fox, P.F. Microbiological, biochemical and technological properties of Turkish white cheese ‘Beyaz Peynir’. International Dairy Journal 2002, 12, 635–648.
- Öksüz, Ö.; Kurultay, S.; Simsek, O. The effect of Brevibacterium linens on some physico-chemical properties and colour intensity of Kashar cheese. Milchwissenschaft 2001, 56, 82–85.
- Hayaloğlu, A.A.; Karabulut, İ. Characterization and comparison of free fatty acid profiles of eleven varieties of Turkish cheeses. International Journal of Food Properties 2013, 16, 1407–1416.
- Institute of Turkish Standards. Kashar cheese, TS 3272. Turk Standartlari Enstitusu, Ankara, Turkey, 1995.
- Koca, N.; Metin, M. Textural, melting and sensory properties of low-fat fresh kashar cheeses produced by using fat replacers. International Dairy Journal 2004, 14, 365–373.
- Çetinkaya, A.; Yaman, H.; Elmali, M.; Karadagoglu, G. A preliminary study of Kashar cheese and its organoleptic qualities matured in bee wax. International Journal of Food Safety 2003, 6, 1–4.
- Awad, R.A.; Abdel-Hamid, L.B.; El-Shabrawy, S.A.; Sing, R.K. Texture and microstructure of block type processed cheese with formulated emulsifying salt mixture. Food Science and Technology 2002, 35, 54–61.
- Lane, C.N.; Fox, F.P.; Johnston, D.E.; Mcsweeney, P.L.H. Contribution of coagulant to proteolysis and textural changes in cheddar cheese during ripening. International Dairy Journal 1997, 7, 453–464.
- Gunasekaran, S.; Ak, M.M. Cheese Rheology and Texture; CRC Press LLC, Washington, 2003.
- Chen, L.; Opara, U.L. Texture measurement approaches in fresh and processed foods—A review. Food Research International 2013, 51, 823–835.
- Singh, V.; Guizani, N.; Al-Alawi, A.; Claereboudt, M.; Rahman, M.S. Instrumental texture profile analysis (TPA) of date fruits as a function of its physico-chemical properties. Industrial Crops and Products 2013, 50, 866–873.
- Peleg, M. On fundamental issues in texture evaluation and texturization—A review. Food Hydrocolloids 2006, 20, 405–414.
- Bárcenas, P.; Elortondo, Fr., J.P.; Albisu, M.; Mége, J.; Roseiro, L.B.; Scintu, M.F.; Paloma, T.; Susana, L.; Pierre, L. An international ring trial for the sensory evaluation of raw ewes’ milk cheese texture. International Dairy Journal 2007, 17, 1139–1147.
- Destefanis, G.; Barge, M.T.; Brugiapaglia, A.; Tassone, S. The use of principal component analysis (PCA) to characterize beef. Meat Science 2000, 56, 255–259.
- Patras, A.; Brunton, N.P.; Downey, G.; Rawson, A.; Warriner, K.; Gernigon, G. Application of principal component and hierarchical analysis to classify fruits and vegetables commonly consumed in Ireland based on in vitro antioxidant activity. Journal of Food Composition and Analysis 2011, 24, 250–256.
- AOAC. Official Methods of Analysis of the Association of Official Analytical Chemist; AOAC: Washington, DC, 2000.
- Bourne, M.C. Food Texture and Viscosity: Concept and Measurement, 2nd Ed.; Academic: San Diego, 2002.
- Hayaloglu, A.A.; Cakmakci, S.; Brechany, E.Y.; Deegan, K.C.; Mcsweeney, P.L.H. Microbiology, biochemistry, and volatile composition of tulum cheese ripened in goat’s skin or plastic bags. International Dairy Journal 2007, 90, 1102–1121.
- Gülmez, M.; Oral, N.; Güven, A.; Baz, E.; Sezer, Ç.; Duman, B. Some microbiological and chemical properties of kashar cheeses consumed in Kars. Journal of Kafkas University Veterenary Faculty 2004, 10, 183–188.
- Hayaloglu, A.A. Volatile composition and proteolysis in traditionally produced mature kashar cheese. International Journal of Food Science and Technology 2009, 44, 1388–1394.
- Demirci, M.; Diraman, H. Trakya Bölgesinde Üretilen Vakum Paketlenmiş Taze Kaşar Peynirlerinin Yapım Tekniği Fiziksel, Kimyasal ve Mikrobiolojik Nitelikleri ve Enerji Değerleri Üzerinde Bir Çalışma. Trakya University Tekirdag Agriculture Faculty Agricultural Products Technology Department: Tekirdağ, 1990; 83–88.
- Koçak, C. Peynirde Tekstür Oluşumu. Food 1988, 1, 13–16.
- Huang, M.; Kennedy, J.F.; Li, B.; Xu, X.; Xie, B.J. Characters of rice starch gel modified by gellan, carrageenan, and gluco-mannan: A texture profile analysis study. Carbohydrate Polymers 2007, 69 (3), 411–418.
- Dinkçi, N.; Kesenkaş, H.; Seçkin, A.K.; Kinik, Ö.; Gönç, S. Influence of vegetable blend on the texture, microstructure and sensory properties of kashar cheese. Grasas Aceites 2011, 62 (3), 275–283.
- Goksel, M.; Doğan, M.; Toker, O.S.; Ozgen, S.; Sarioglu, K.; Oral, R.A. The effect of starch concentration and temperature on grape molasses: Rheological and textural properties. Food and Bioprocess Technology 2012, 6, 259–271.
- Chevanan, N.; Muthukumarappan, K.; Upreti, P.; Metzger, L.E. Effect of calcium and phosphorus, residual lactose and salt-to-moisture ratio on textural properties of cheddar cheese during ripening. Journal of Texture Studies 2006, 37, 711–730.
- Karaman, A.D.; Akalin, A.S. Improving quality characteristics of reduced and low fat Turkish white cheeses using homogenized cream. Food Science and Technology 2013, 50, 503–510.
- Delgado, J.F.; González-Crespo, J.; Cava, R.; Ramírez, R. Proteolysis, texture and colour of a raw goat milk cheese throughout the maturation. European Journal of Food Research and Technology 2011, 233, 483–488.
- Bryant, A.; Ustunol, Z.; Steffe, J. Texture of cheddar cheese as influenced by fat reduction. Journal of Food Science 1995, 60, 1216–1220.
- Upreti, P.; Mckay, L.L.; Metzger, L.E. Influence of calcium and phosphorus, lactose and salt-to-moisture ratio on cheddar cheese quality: Changes in residual sugars and water soluble organic acids during ripening. Journal of Dairy Science 2006, 89, 429–443.
- Hayaloğlu, A.A.; Karabulut, İ. Primary and secondary proteolysis in eleven Turkish cheese varieties. International Journal of Food Properties 2013, 16, 1663–1675.
- Kaya, S. Effect of salt on hardness and whiteness of Gaziantep cheese during short-term brining. Journal of Food Engineering 2002, 52, 155–159.
- Gwartney, E.A.; Foegeding, E.A.; Larick, D.K. The texture of commercial full-fat and reduced-fat cheese. Journal of Food Science 2002, 67, 812–816.
- Lobato-Calleros, C.; Vernon-Carter, E.J. Microstructure and texture of cheese analogs containing different types of fat. Journal of Texture Studies 1998, 29, 569–586.
- Özer, B.H.; Robinson, R.K.; Gradison, S.A. Textural and microstructural properties of Urfa cheese (a white brined Turkish cheese). International Journal of Dairy Technology 2003, 56, 171–176.
- Tamime, A.Y.; Muir, D.D.; Shenana, M.E.; Kalab, M.; Dawood, A.H. Processed cheese analogues incorporating fat substitutes rheology, sensory perception of texture and microstructure. Food Science and Technology 1999, 32, 50–59.
- Larrigaudiere, C.; Lentheric, I.; Puy, J.; Pinto, E. Biochemical characterisation of core browning and brown heart disorder in pear by multivariate analysis. Postharvest Biology and Technology 2004, 31, 29–39.