
Abstract
Fourier transform infrared spectroscopy in combination with multivariate calibration of partial least square is intended for quantitative analysis of black seed oil in binary mixture with sunflower oil and walnut oil, as well as in ternary mixture with sunflower oil and walnut oil. The spectra of black seed oil, sunflower oil, walnut oil, and their mixture with certain concentration were scanned using attenuated total reflectance at mid infrared region of 4000–650 cm−1. For quantitatve analysis, Fourier transform infrared spectral treatment (normal or derivatives) with the highest values of coefficient of determination (R2) and the lowest values of root mean square error of calibration was selected as optimal calibration model. Partial least square at whole mid infrared region of 4000–650 cm−1 is well suited for quantitative analysis of black seed oil either in binary mixture or ternary mixture with walnut oil and sunflower oil. Furthermore, using absorbancies at frequency region of 3009–721 cm−1, principal component analysis is succesfully used for classification of black seed oil and that mixed with sunflower oil and walnut oil. The developed method is rapid, no sample preparation needed, and is not involving the use of chemical reagents and solvents.
Color versions of one or more of the figures in the article can be found online at www.tandfonline.com/ljfp.
INTRODUCTION
Black seed (Nigella sativa) has been used for centuries in some countries such as India, Greece, and Middle East Asia for some biological activities. The black seed has been known to have analgesic and anti-inflammatory, antibacterial, antiasthmatic, anticarcinogenic, antiviral effects,[Citation1,Citation2] antifungal,[Citation3] as well as antioxidant activities.[Citation4] Clinical evaluation about the black seed and its active constituents has been reviewed by El-Tahir and Bakeet.[Citation5] The health enhancing potential of black seed has been attributed to the active ingredients that are mainly concentrated in fixed and essential oil.
Black seed oil (BSO) has diverse of chemical composition. It contains proteins, carbohydrates, fixed, and volatile oil.[Citation6,Citation7] BSO which is evaluated for its active ingredients through gas chromatography-mass spectrometry (GC-MS) indicated that it contains thymoquionone (23.25%), dihydrothymoquionone (3.84%), p-cymene (32.02%), and t-anethole (3.84%).[Citation8] Besides, BSO also contains some sterols like cholesterol, campesterol, stigmasterol, β-sitosterol, and α-spinosterol,[Citation9] as well as saponins, nigelline, nigellimine, and nigellicine[Citation10] which are believed to have carminative, stimulatory, and diaphoretic properties. Some other studies revealed that BSO constitutes some valuable essential oils and fatty acids (FAs).[Citation11] For this reason, BSO commands high price value in the market.
BSO is more expensive (10–15 times) than other edible oils such as palm oil, sunflower oil (SFO), and other vegetable oils.[Citation12] As a consequence, BSO can be easily adulterated with these vegetable oils. Authentication of oils is important issue for consumers, producers, and policy makers to assure its quality and safety.[Citation13] Therefore, some analytical methods have been continuously developed and applied for authentication study. Some of the developed methods like chromatography are impractical and too laborious. Therefore, it is highly needed to develop a method capable of detecting any adulteration of BSO quickly and reliably. Due to its capability to serve as “fingerprint technique,” Fourier transform infrared (FTIR) spectroscopy can be used as potential analytical method for BSO authentication, especially if it is combined with chemometrics of multivariate analysis, like multivariate calibration and principal component analysis (PCA).
FTIR spectroscopy is a fast and non-destructive technique, sensitive, and simple in sample preparation. Its application to analysis of edible oils can be considered as “green analytical chemistry” because this technique reduces or eliminates solvents and chemical reagents that may be hazardous to human health and environment. The application of FTIR spectroscopy has predominantly become a useful analytical tool in the study of edible fats and oils, including for authentication studies.[Citation14] FTIR spectroscopy in combination with multivariate calibration has been successfully used to analyze grape oil as adulterant in BSO,[Citation12] lard in some vegetable oils,[Citation15] authentication of edible oils with used frying oils,[Citation16] analysis of chicken fat as adulterant in butter,[Citation17] analysis of corn, sunflower, and pumpkin seed oils as adulterants in olive oil,[Citation18,Citation19] and for analysis of corn as adulterant in sesame oil.[Citation20] However, using literature searching, the analysis of BSO in combination with other vegetable oils is limited. In this study, we developed and optimized FTIR spectroscopy for monitoring BSO adulteration with SFO and walnut oil (WO) using chemometrics of partial least square (PLS) for quantification, as well as PCA for classification of BSO and BSO’s adulterant.
MATERIALS AND METHODS
BSO (the mixture from four different brands) and SFO were purchased from the super market in Yogyakarta, Indonesia. WO was purchased from Malaysia. In order to assure the purity criteria of these oils, the FA composition was determined using GC as derivate of fatty acid methyl ester (FAME). The standard of FAMEs of 37 compounds (C4 to C24) was bought from Sigma-Aldrich, St. Louis, MO, USA. All chemical and reagents used were of analytical grade.
FA Composition
FA composition of BSO, sunflower, and WO were qualitatively and quantitatively analyzed using GC coupled with universal detector of flame ionization detector. Before being injected into GC, the samples are hidrolyzed and derivatized using sodium methoxyde and BF3. The complete procedure and GC condition for analysis of FA composition can be seen in our previous article.[Citation21]
Preparation of Oil Samples
For FTIR spectroscopy analysis, the calibration and prediction samples composed of binary and ternary mixture of BSO, SFO, and WO were prepared in the concentration range of 0–100.0% (v/v). All of oil samples (either pure BSO or in the mixture with adulterants) were scanned using FTIR spectrophotometer.
Measurement of FTIR Spectra
FTIR spectra of oil samples (either pure or mixtures) were measured using a MBB FTIR spectrophotometer (ABB, Canada) equipped with deuteratedtriglycinesulphate (DTGS) detector and Germanium as beam splitter. The instrument was connected to the Horizon MB300 software. FTIR spectra were collected at mid-infrared region (4000–650 cm−1), using 32 scans, and at a resolution of 8 cm−1. These spectra were subtracted against the background of air spectrum. After every scan, a background of new reference air spectrum was taken. These spectra were recorded as absorbance values at each data point in duplicate.
Statistical Analysis
PCA of BSO and other oils using absorbance as variable matrix was performed with the aid of Minitab software version 16. The multivariate calibration of PLS for FTIR spectral data was done by Horizon MB300 software included in FTIR spectrophotometer.
RESULT AND DISCUSSION
The FA composition of BSO, SFO, and WO were shown in . The results of FA composition of BSO, SFO, and WO are comparable to the data previously reported in some literature.[Citation22,Citation23] The used SFO has FA compositions which are in accordance with those ranged in Codex Allimentarius.[Citation24] From these results, it can be concluded that all used oils are authentic, meaning that these oils are not previously adulterated.
TABLE 1 Fatty acid composition of black seed oil (BSO), sunflower oil (SO), and walnut oil (WO; %)
Spectral Analysis
reveals FTIR spectra of BSO, SFO, and WO at mid-infrared region (MIR; 4000–650 cm−1). Three spectra show very similar and difficult to be distinguished using the naked eye. Because approximately of 95% of the edible oil is triglyceride (TG), FTIR spectra of edible fats and oils could be representative of those of TG.[Citation25] Due to its capability as fingerprint technique, FTIR spectroscopy can be used as a differentiation tools, especially in combination with chemometrics of multivariate analysis.
TABLE 2 The optimization procedure for selecting the best frequency regions and FTIR spectral treatment during the quantification of black seed oil in binary mixture with sunflower oil
FIGURE 1 FTIR spectra of black seed oil, sunflower oil, and walnut oil at mid-infrared region of 4000–650 cm−1.
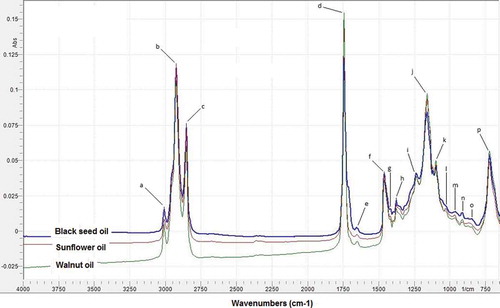
The functional groups responsible for IR absorption in BSO, SO, and WO are as follows: (a) 3009 cm−1 (trans =C-H stretch); (b) 2924 cm−1 (-CH2symmetrical stretching); (c) 2854 cm−1(-CH2asymmetrical stretching); (d) 1743 cm−1 (-C=O stretch); (e) 1655 cm−1 (-C=C asymmetrical stretching); (f) 1458 cm−1 (-CH2 bending); (g) 1419 cm−1 (cis =C-H bending); (h) 1272 cm−1 (-CH3 bending); (i) 1234 cm−1 (-C-O stretch); (j) 1161 cm−1 (-C-O stretch; -CH2 bending); (k) 1099 and (l) 1034 cm−1 (-C-O stretch); (m) 964 cm−1 (trans –CH=CH- bending out of plane); (n) 910 cm−1 (-C-H bending out of plane); (o) 851 cm−1 (=CH2 wagging); and (p) 722 cm−1(–CH=CH- bending out of plane).[Citation26]
Quantitative Analysis
Quantitative analysis of BSO in binary and ternary mixture with SFO and WO as adulterants is carried out using multivariate calibration of PLS, either using normal spectra or its derivatives (first and second). Some frequency regions have been optimized to be chosen as frequencies used for quantification using PLS calibration model. The selected frequencies and FTIR spectral treatment were based on its capability to provide the highest values of coefficient of determination (R2) and the lowest values of errors, either error in root mean square error of calibration (RMSEC) or error in prediction/validation (RMSEP) for the agreement between the actual or reference value of BSO and predicted value of BSO obtained during PLS modeling.
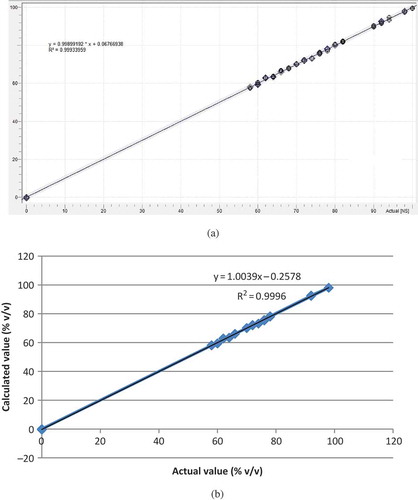
Some frequency regions, namely at whole MIR of 4000–650 cm−1, 1724–1488 cm−1, 1176–991 cm−1, and the combined frequency regions of 1724–1488 and 1176–991 cm−1 have been optimized. showed the optimization processes for selecting the best frequency regions and FTIR spectral treatment during the quantification of BSO in binary mixture with SFO. Finally, the frequency region of 4000–650 cm−1 in combination with FTIR normal spectra was selected, because these provide the highest R2 (0.9993) and the lowest errors in calibration model (RMSEC of 0.68% v/v) and in validation model (RMSEP of 0.46% v/v). exhibited the scatter plot for the agreement between actual value of BSO and predicted value of BSO using the optimized parameters.
FIGURE 2 PLS calibration model for the relationship between actual value (x-axis) of black seed oil (BSO) in binary mixture with sunflower oil and calculated value of BSO using FTIR normal spectra at frequency region of 4,000–650 cm−1.
Similarly, some frequency regions and FTIR spectral treatment were also optimized for determination of BSO in binary mixture with WO and BSO in ternary mixture with SFO and WO. and 4 summarize the optimization results for analysis of BSO adulterated with SFO and WO. As shown in , the FTIR normal spectra in combination with PLS model at frequency region of 4000–650 cm−1 was selected for quantification of BSO in the mixture with WO based on the highest value of R2 (0.9997) and the lowest values of RMSEC (0.67% v/v) and RMSEP (0.43% v/v). Furthermore, the frequency region of 1724–1203 was preferred for quantification of BSO in the ternary mixture with SFO and WO with R2, RMSEC, and RMSEP values of 0.999, 0.58% (v/v), and 0.34% (v/v), respectively ().
TABLE 3 The optimization procedure for selecting the best frequency regions and FTIR spectral treatment during the quantification of black seed oil in binary mixture with walnut oil
TABLE 4 The optimization procedure for selecting the best frequency regions and FTIR spectral treatment during the quantification of black seed oil in ternary mixture with sunflower oil and walnut oil
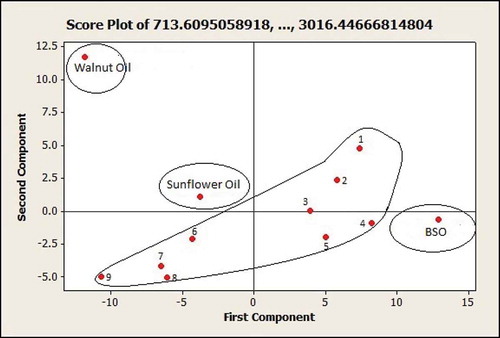
For making the classification between BSO, SFO, WO, and BSO adulterated with SFO and WO, the PCA was used. PCA is one of the unsupervised pattern recognition techniques commonly used for classification of samples. As a matrix variables, absorbancies at frequency region of 3009–722 cm−1 were used. exhibited PCA score plot for the first principle component (PC1) and the second principle component (PC2). Based on score plot of PC1 and PC2, pure BSO located on the right quadrant of PC1, while pure SFO and WO located on the left quadrant of PC1. Besides, pure BSO and that adulterated can be clearly separated, indicating that PCA can successfully classify between pure BSO and that which has been adulterated with SFO and WO.
FIGURE 3 Principal component analysis for classification of black seed oil (BSO), sunflower oil (SFO), walnut oil (WO), and the mixtures of (1) BSO 60% + SFO 40%; (2) BSO 60% + WO 40%; (3) BSO 60% + SFO 20% + WO 20%; (4) BSO 80% + SFO 20%; (5) BSO 80% + WO 20%; (6) BSO 80% + SO 8% + WO 12%; (7) BSO 90% + SFO 10%; (8) BSO 90% + WO 10%; and (9) BSO 90% + SO 4% + WO 6%.
CONCLUSION
It can be concluded that FTIR spectroscopy combined with multivariate calibration of PLS at frequency regions of 4000–650 cm−1 can be used to quantitatively analyze BSO contents in binary mixture with SFO and with WO providing the highest R2 and the lowest values of error during calibration and validation modeling. Meanwhile, the FTIR normal spectra at frequency region of 1724–1203 cm−1 are selected for quantitative analysis of BSO contents in ternary mixture with SFO and WO.
FUNDING
The authors would like to thank the Ministry of Education and culture, Republic of Indonesia for financial support during this study via scheme of excellent research of higher education (Penelitian Unggulan perguruan Tinggi) 2014.
Notes
Color versions of one or more of the figures in the article can be found online at www.tandfonline.com/ljfp.
REFERENCES
- Benkaci-Ali, F.; Baaliouamer, A.; Wathelet, J.P.; Marlier, M. Chemical composition and physicochemical characteristics of fixed oils from Algerian Nigella sativa seeds. Chemistry of Natural Compounds 2012, 47, 925–931.
- Arici, M.; Sagdic, O.; Gecgel, U.; Arici, M.; Sagdic, O.; Gecgel, U. Antibacterial effect of Turkish black cumin (Nigella sativa L.) oils. Grasas y Aceites 2005, 56 (4), 259–262.
- Khan, M.A.U.; Ashfaq, M.K.; Zuberi, H.S.; Mahmood, M.S.; Gilani, A.H. The in vivo antifungal activity of the aqueous extract from Nigella sativa seeds. Phytotheraphy Research 2003, 17, 183–186.
- Burits, M.; Bucar, F. Antioxidant activity of Nigella sativa essential oil. Phytotheraphy Research 2000, 14, 323–328.
- El-Tahir, K.E.D.H.; Bakeet, D.M. The black seed Nigella sativa Linnaeus-amine for multi cures: A plea for urgent clinical evaluation of its volatile oil. Journal of Taibah University Medical Sciences 2006, 1 (1), 1–19.
- Khan, M.A. Chemical composition and medical properties of Nigella sativa Linn. Inflammo Pharmacology 1999, 7 (1), 15–35.
- Nickavar, B.; Mojab, F.; Javdnia, K.; Amoli, M.A.R. Chemical composition of the fixed and volatile oils of Nigella sativa L. from Iran. Z. Naturforsch 2003, 58, 629–631.
- Sultan, M.T.; Butt, M.S.; Anjum, F.M.; Jamil, A.; Akhtar, S.; Nasir, M. Nutritional profile of indigenous cultivar of black cumin seeds and antioxidant potential of its fixed and essential oil. Pakistan Journal of Botany 2009, 41 (3), 1321–1330.
- Salama, R.B. Sterols in the seed oil of Nigella sativa. Plant Medica 1973, 24, 375–377.
- Ansari, A.A.; Hassan, S.; Kanne, L.; Atta-Ur-Rehman; Wehler, T. Structural studies on a saponin isolated from Nigella sativa. Phytochemistry 1988, 27, 3977–3979.
- Singh, N.; Pandit, V.; Verma, M.; Mehta, B.K. GC-MS study of Nigella sativa (seeds) fatty oil. Grasas y Aceites 2002, 53 (2), 173–174.
- Nurrulhidayah, A.F.; Che Man, Y.B.; Al-Kahtani, H.A.; Rohman, A. Application of FTIR spectroscopy coupled with chemometrics for authentication of Nigella sativa seed oil. Spectroscopy 2011, 25, 243–250.
- Rohman, A.; Che Man, Y.B. Authentication of extra virgin olive oil from sesame oil using FTIR spectroscopy and gas chromatography. International Journal Food Properties 2012, 15, 1309–1318.
- Guillen, M.D.; Cabo, N. Characterization of edible oils and lard by Fourier transform infrared spectroscopy, relationships between composition, and frequency of concrete bands in the fingerprint region. Journal of the American Oil Chemists’ Society 1997, 74, 1281–1286.
- Rohman, A.; Che Man, Y.B.; Ismail, A.; Hashim, P. FTIR spectroscopy combined with chemometrics for analysis of lard adulteration in some vegetable oils. CYTA-Journal of Food 2011, 9 (2), 96–101.
- Zhang, Q.; Liu, C.; Sun, Z.; Hu, X.; Shen, Q.; Wu, J. Authentication of edible vegetable oils adulterated with used frying oil by Fourier transform infrared spectroscopy. Food Chemistry 2012, 132, 1607–1613.
- Nurrulhidayah, A.F.; Rohman, A.; Amin, I.; Shuhaimi, M.; Khatib, A. Analysis of chicken fat as adulterant in butter using Fourier transform infrared spectroscopy and chemometrics. Grasas y Aceites 2013, 64 (4), 349–355.
- Rohman, A.; Che Man, Y.B. Quantification and classification of corn and sunflower oils as adulterants in olive oil using chemometrics and FTIR spectra. The Scientific world Journal 2012, 12, 1–6. DOI:10.1100/2011/250795
- Rohman, A.; Che Man, Y.B.; Nurrulhidayah, A.F. First derivative FTIR spectra combined with chemometrics and fatty acid composition for analysis of pumpkin seed oil blended into olive oil. International Journal Food Properties 2014, DOI:10.1080/10942912.2012.654564
- Nurrulhidayah, A.F.; Che Man, Y.B.; Rohman, A. FTIR spectroscopy combined with chemometric for analysis of sesame oil adulterated with corn oil. International Journal of Food properties 2014, 17 (6), 1275–1282.
- Che Man, Y.B.; Marina, A.M.; Rohman, A.; Al-Kahtani, H.A.; Norazura, O. A Fourier transform infrared spectroscopy method for analysis of palm oil adulterated with lard in pre-fried french fries. International Journal of Food Properties 2014, 17, 354–362.
- Tulukcu, E. A comparative study on fatty acid composition of black cumin obtained from different regions of Turkey, Iran, and Syria. African Journal of Agricultural Research 2001, 6 (4), 892–895.
- Ustun, G.; Kent, L.; Cekin, N.; Civelekoglu, H. Investigation of technological properties of Nigella sativa (black cumin) seed oil. Journal of the American Oil Chemists’ Society 1990, 67, 958–960.
- Codex Alimentarius Commision. Amended. Codex Standard for Named vegetable Oils. Codex Stan 210 (2003).
- Guillén, M.D.; Cabo, N. Some of the most significant changes in the Fourier transform infrared spectra of edible oils under oxidative conditions. Journal of Science of Food and Agriculture 2000, 80, 2028–2036.
- Pavia, D.L.; Lampman, G.M.; Kriz-jr, G.S. Introduction to Spectroscopy: A Guide for Students of Organic Chemistry, 4th Ed; Thomson Learning Inc.: London, UK, 2001.