
Abstract
Soluble solids content is an important internal quality attribute in determining fruit maturity and harvesting time. In this study, an electronic nose was used to monitor the soluble solids content based on the change of volatile compounds of persimmon fruit during different picking-dates. Principal component analysis was applied to investigate whether the sensors’ response of the electronic nose was able to distinguish persimmons among different picking dates corresponding to different maturity levels. The loading analysis was used to identify those sensors that contribute most for flavor modeling. The results indicated that the electronic nose could distinguish the different picking dates using principal component analysis. The model testing showed that a support vector machine could achieve better prediction accuracy and generalization than multiple linear regression and back-propagation neural network and the average prediction accuracy, root mean square error, and mean relative error of the soluble solids content. By using support vector machine models were 91.36, 0.71, and 0.58%, respectively, which implied that the electronic nose was effective for soluble solids content prediction of persimmons on the basis of the support vector machine model.
INTRODUCTION
The persimmon is one of the most frequently consumed fruits in southern China as well as in other countries in Asia such as India, Thailand, and the Philippines. Soluble solids content (SSC) is an important internal quality attributes that directly influence the consumer purchasing decision on fresh persimmon fruit. They are also important parameters in assessing persimmon maturity to determine optimal harvest dates. Standard methods for SSC measurements are mostly destructive and sometimes inefficient or prone to operational error. Hence, non-destructive sensing of fruit SSC and maturity stage is of great value for determining optimal harvest time and ensuring high quality fruit for consumers.
Fruit aroma, as an indicator of the physiological conditions of fruit, can be analyzed to develop consistent and reproducible non-destructive method to evaluate fruit quality. The existing research results show the fact that, in many cases, a clear relationship can be found between fruit ageing and the quantity of the emission of some volatiles such as linalool or benzaldehyde. Electronic nose (E-nose) offers a fast and non-destructive alternative to sense aroma, and may be advantageously used to predict the optimal harvest date and quality attribute (especially SSC) of fruits. There have been several reports on electronic sensing evaluation in fruits internal quality, such as: mandarin,[Citation1] tomato,[Citation2] apple,[Citation3,Citation4] and peach.[Citation5,Citation6] However, every fruit has its unique aroma profile. To our knowledge, no research has been reported yet for assessing SSC of persimmons using the E-nose technique.
In non-destructive modeling of agricultural produces, neural networks can simulate non-linear systems and have been widely used. There are different architectures of neural networks and can get good performance in a given architecture in a particular problem, which does not bring about similar results faced with a different situation. A support vector machine (SVM) is powerful for solving problems in non-linear classification, function estimation, and density estimation. The formulation of SVM embodies the structural risk minimization (SRM) principle, which has been shown to be superior to traditional empirical risk principle (ERM) included in conventional neural networks.[Citation7]
The main objective of the present study was to evaluate the feasibility of using E-nose for the SSC and picking dates evaluation of persimmons. Therefore, the research was conducted through (1) employing an E-nose device to acquire aroma of a “Jiro” persimmon; (2) using principal component analysis (PCA) to determine whether the E-nose was able to classify persimmons in terms of the different picking dates; (3) selecting optimal sensors responsible for a discrimination using loading analysis; (4) providing a robust model for the determination of SSC in the “Jiro” persimmon.
MATERIALS AND METHODS
Persimmon Samples
The test persimmons of “Jiro” were obtained from an orchard (Shilin Sweet Persimmon Product Company, Shilin, Yunnan Province, China). The persimmons were harvested on August 20th (day 0), 25th (day 5), 30th (day 10), and September 4th (day 15), 9th (day 20), and 14th (day 25), in the year of 2012. Harvesting the persimmons on these dates enabled us to test persimmons from different ripening stages. Upon arrival at the laboratory, the peaches were inspected to ensure that they were uniform, non-damaged, not attacked by worms, and keeping sepals. Two hundred forty persimmons were used for this experiment (40 persimmons for each picked date). All persimmons were evaluated at the picked day. The persimmon samples were kept at room temperature at least 16 h before the experiment to reach environment equilibrium. All samples were divided into two sets. One called the calibration set with 160 samples was used to build the model, and the other called the prediction set with 80 samples was used to test the robustness of model.
Data Acquisition of E-nose
The smell characteristics of persimmons were analyzed with a portable E-nose (PEN 3). The system is supplied by the Win Muster Air-sense (WMA) Analytics Inc. (Germany), which consists of a sampling apparatus, a detector unit containing an array of ten different metal oxide sensors, and pattern recognition software (Win Muster v.1.6) for data recording and analysis. The serial number, main applications, and references of the ten sensors are listed in . Each fruit was placed in an airtight glass jar with a volume of 0.5 L (concentration chamber). The glass jar was then closed and the headspace inside it was equilibrated for 45 min. During the measurement phase, the headspace gas was pumped through the sensors array with a flow rate of 400 mL/min, which induced the change of sensors’ conductance. The sensor response was defined as the ratio of conductance G/G0 (G0 and G stand for the conductance of the sensor before and after exposing to the gas samples, respectively). The measurement phase lasted for 60 s, a period of time sufficient for sensors to reach a stable responsive value. When the measurement was completed, the acquired data were properly stored for later use. Then, a stand-by phase was activated (80 s), during this phase, clear air desorbed remaining volatiles out from sensors and circuit, and then the signals return to the baseline before the next test. In order to decrease experiment error, the environmental temperature was kept at 25°C during all the experiments.
TABLE 1 Sensors used and their main applications in PEN 3
SSC Measurement
SSC of the juice for each fruit was measured with a temperature compensating refract meter (Digital refract meter TD-45, Zhejiang, China) at temperature of 25°C. The fruit juice drops were measured by refract meter to get the values in °Brix, and the mean value of three measurements was recorded.
E-nose Analysis
Pattern recognition algorithms and data processing methods are critical components in the implementation and successful commercialization of the E-nose system. PCA is a chemometric linear, unsupervised, and pattern recognition technique used for analyzing, classifying, and reducing the dimensionality of numerical datasets in a multivariate problem.[Citation8,Citation9] The main features of PCA are the coordinates of data in a new base (scores plot) and its contribution to each component of the sensors (loads plot). The score plot is generally used for studying the character location of persimmon, while the loads plot can be used to generate information on the contribution of array sensors to each principal component.[Citation10] In this study, PCA was used to distinguish persimmons of different storage periods based on the signals of the E-nose.
The loadings analysis is well correlated to the PCA. Using this analysis, the sensors can be investigated for their responsibility for the discrimination given by the trained patterns. Sensors, located near the center of the diagram (0, 0) have a minor responsibility for the distribution of pattern in the PCA plot.[Citation11] Loadings analysis will help to identify the sensors responsible for discrimination and the results of the analysis served as evidence for input parameters for the modeling optimization process.
Pattern Recognition
In this study, linear model (multiple linear regression; MLR) and non-linear model (SVM, back propagation neural network [BPNN]) were compared to see which could predict SSC better. MLR is widely used to resolve food authentication problems, while BPNN is a powerful study system which can actualize highly non-linearity mapping between input and output, and it was confirmed that this model could come to any continuous non-linear curve.[Citation12] SVM is another powerful tool in pattern recognition, which offers excellent generalization ability.[Citation13] The SVM model construction procedures in this research were as follows:
Step 1: Determine the input and output of the SVM prediction model.
Step 2: Determine the Kernel function of the SVM prediction model.
Step 3: Determine the key parameters of the SVM prediction model as the penalty parameter C and the radius ϵ. Then determine the width parameter δ2 according to C and ϵ.
Step 4: Train the SVM prediction model with the data in calibration set.
Step 5: Use the prediction set to verify the performance of the SVM model.
There are a number of ways to validate multivariate regression models. In this study, the performance of the regression models were evaluated using the average predicting accuracy (APA), the root mean square error (RMSE), and the mean relative error (MRE).[Citation14] A good model should have a low RMSE, MRE, and a high APA. The APA, RMSE, and MRE were defined as Eq. (1) to Eq. (3). Here, the SSC content was expressed as y:
where, yip represents the predicted value of yi. The three models were conducted using SPSS 18.0, Matlab 7.5, and LIBSVM software,[Citation15] respectively.
RESULTS AND DISCUSSION
Changes of SSC
The SSC changes of the persimmon in different picking dates are shown in . It increased from 10.42 to 14.73° brix and increased by 41.36% after 25 days along with the persimmons ripeness. These data were analyzed by frequency statistics method, and they obeyed normal distribution.
FIGURE 1 Soluble solid content (SSC) of persimmon at different picking dates for the daily means of 40 samples and their standard deviations.
E-nose Response to Fruit Aroma
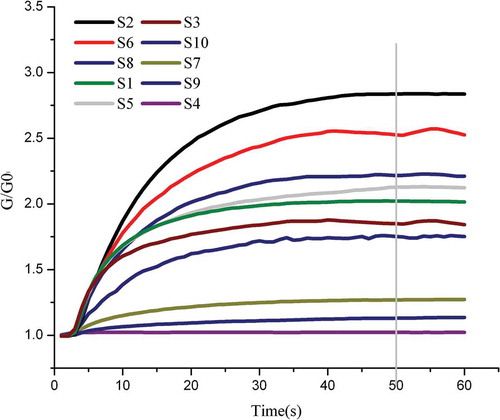
In order to obtain reliable data, the optimum time should be determined.[Citation16] displays a typical response of ten sensors during measurement of persimmon fruit in which each curve represents a different sensor response with time. The ordinate represents the changing ratio between G and G0. It was apparent that, for most sensors, after an initial period of low conductivity, the conductivity increased sharply and then stabilized. In this research, the responsive values of each sensor at 50 s point were used in analysis.
FIGURE 2 Ten sensors responses of electronic nose to persimmon fruit aroma.
Classification Using PCA
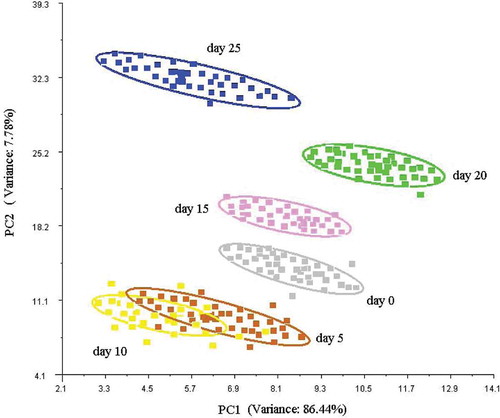
In order to investigate whether the E-nose was able to distinguish different picking-dates, PCA analysis was applied in this research. The PCA result is shown in . Results of two axis analysis were PC1 of 86.44% and PC2 of 7.78%, respectively. The persimmons from different picking dates were clearly distinguishable from the other groups by using PCA analysis, except two groups of samples partially overlapped each other (day 5 and 10), which implies that the PCA method was efficient in distinguishing different picking dates of persimmon except on day 5 and 10.
FIGURE 3 PCA analysis for persimmons at different picking date.
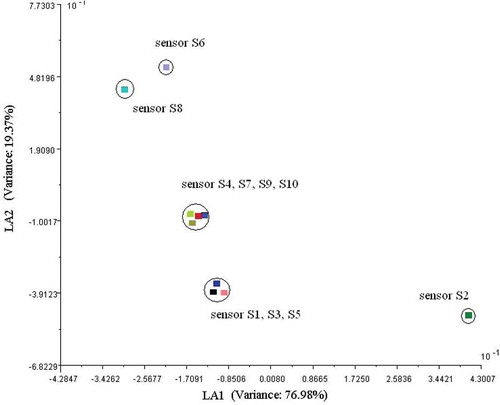
The loading analysis was performed, and a loading plot of the loading factors associated with persimmons is shown in . The plot showed the relative importance of the sensors in the array. The loading factor associated with the first and second principal components for each sensor is represented. showed that the sensors S2, S6, and S8 had higher influence in the current pattern file, and the sensors S1, S3, S4, S5, S7, S9, and S10 had lower influence, which indicated sensors S2, S6, and S8 were highly sensitive to persimmon ripeness. Therefore, the sensors S2, S6, and S8 were selected as optimum sensors for the prediction of SSC content in persimmon, which means these three sensors responded to the main persimmon aroma. Due to the non-specific compound sensitive nature of the sensors, it is difficult to tell specific aroma components.
FIGURE 4 Loading analysis related to PC1 and PC2 for persimmons.
SVM Modeling Method
Selection of input and output parameters: Based on above results, the responsive values of three sensors (S2, S6, and S8) in the E-nose were chosen as the SVM model’s input parameters. The SSC of persimmons was chosen as the model’s output parameter. In order to improve the calculation efficiency and to prevent individual data from overflowing during calculation, the input and output parameters were normalized.
Choice of the kernel function: The typical kernel functions of SVM include linear function, polynomial function, Gaussian function, and sigmoid function, etc. Among these functions, the Gaussian function can map the sample set from the input space into a high-dimensional feature space effectively, which is good for representing the complex non-linear relationship between the output and input. Because of the above advantages, the Gaussian function is widely used.[Citation17] Moreover, there was only one output (SSC) in the system to be determined, so that the high-calculation efficiency was ensured. In this study, Gaussian function was selected as the kernel function and was expressed as follows:
where, Xi and Xj were training vectors, δ2 was the width parameter of Gaussian kernel.
Determination of Parameters for SVM Model
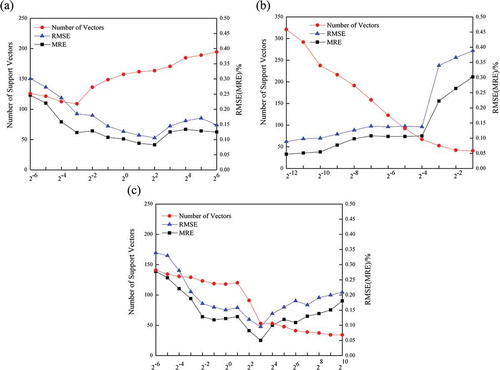
Model parameter search plays a crucial role in the performance of SVM. However, there is no general guidance for selection of SVM kernel function and parameters so far. The radius ϵ parameter, the penalty C and the width parameter δ2 of Gaussian kernel are three important parameters. The parameter C and ϵ should be determined, and then the value of δ2 was selected according to the best C and ϵ. In this research, in order to determine the proper values of parameters, the simulation processes of SVM model with various parameter settings were studied. The SVM models were built with the samples in calibration data set, and ten-fold cross-validation method was used for validation of the SVM models, which could prevent the model form over fitting.[Citation18] First, ϵ was fixed at 0.1, and the value of C was varied from 2−6 to 26 to train the SVM model, and the prediction errors of RMSE, MRE and the number of support vectors[Citation19] for cross-validation were recorded. The results are shown in . As C increased, the number of support vectors increased slowly. The MRE and RMSE first decreased slightly, and then increased after their optimum points. These results suggested that the best parameter of C should be 22 = 4. Then, C was fixed at 4; ϵ was varied between 2−12 and 2−1 to train the SVM model in order to find the best value of ϵ. The results are shown in from which the MRE and RMSE increased slowly, and then increased sharply when ϵ was between 2−4 and 2−1. The number of support vectors decreased fast when the ϵ increased. Considering both the prediction errors and the number of support vectors, 2−4 should be chosen as the best parameter of ϵ. Finally, when the best values of C and ϵ were set at 22 and 2−4, respectively, the simulation of SVM prediction model with various values of δ2 between 2−6 and 210 was carried out. The prediction errors of RMSE and MRE and the number of support vectors were recorded and shown in where δ2 = 23 is the best value for this SSC prediction problem by considering RMSE, MRE, and the number of support vectors.
FIGURE 5 Results of (a) various C, where ϵ = 0.1 for ten-fold cross-validation (unit: %); (b) various ϵ, where C = 4 for ten-fold cross-validation (unit: %); and various δ2, where C = 22, ϵ = 2−4 for ten-fold cross-validation (unit: %).
BPNN
A three-layer BPNN was applied, consisting of an input layer, a hidden layer, and an output layer. In BPNN, the number of its hidden nodes was varied from one to ten using stepwise searching method by considering the input neurons’ number of three (three sensors responsive values),[Citation20] and found the number of the hidden nodes was eight. The learning rate was set at 0.15 and the momentum term was 0.8. Tansig transfer function and logsig transfer function were used for the hidden nodes and the output nodes, respectively.
Prediction Results and Analysis
After model parameters were selected, SVM, BPNN, as well as MLR were established on the basis of three sensors responsive values (S2, S6, S8) in E-nose to predict SSC of persimmon. The calibration and prediction results of three models are summarized in . The accuracy of MLR was 63.36% for the prediction set, which was much lower than non-linear SVM and BPNN models. Meanwhile, the prediction errors were high (RMSE of 2.32%, MRE of 1.88%), indicating that the MLR was not suitable for SSC prediction by responses of sensor array in E-nose. shows that the SSC prediction accuracy of the prediction set by the SVM and BPNN models were 91.36 and 76.49%, respectively. The SVM model possessed the best average SSC prediction accuracy in the three models, and the prediction errors of the SVM model (RMSE of 0.71%, MRE of 0.58%) were less than those of the BPNN and MLR. This finding is in agreement with a previous report.[Citation21] Besides, the SVM model displayed the smallest SSC prediction accuracy decrease (4.56%) which showed a good generalization ability of the model. The above results indicated that the SVM was an appropriate algorithm demonstrating excellent predictive and generalization ability in this research.
TABLE 2 Comparison of the prediction performance of three models (unit: %)
CONCLUSIONS
The results obtained in this study proved that the different picking dates of persimmons could be distinguished by using the E-nose by PCA. The loading analysis indicated that the sensors S2, S6, and S8 had a higher influence in the current pattern file, which indicated the potential in developing a specificity E-nose with optimal sensors to predict SSC of persimmons in practice. The optimum parameters of SVM for the SSC prediction were determined that the kernel function was Gaussian function, and parameters such as penalty C, radius ϵ, and width δ2 were set at 22, 2−4, and 23. The model test results showed that SVM could achieve better prediction accuracy and generalization than the traditional MLR and BPNN.
FUNDING
This work was supported by Special Fund for Agro-scientific Research in the Public Interest (201303088) and PAPD.
Additional information
Funding
Related Research Data
REFERENCES
- Gomez, A.H.; Wang, J.; Hu, G.X.; Pereira, A.G. Electronic nose technique potential monitoring mandarin maturity. Sensor and Actuators B-Chemical 2006, 113, 347–353.
- Gomez, A.H.; Wang, J.; Hu, G.X.; Pereira, A.G. Monitoring storage shelf life of tomato using electronic nose technique. Journal of Food Engineering 2008, 85, 625–631.
- Li, C.Y.; Heinemann, P.; Sherry, R. Neural network and Bayesian network fusion models to fuse electronic nose and surface acoustic wave sensor data for apple defect detection. Sensor and Actuators B-Chemical 2007, 125, 301–310.
- Pathange, L.P.; Mallikarjunan, P.; Marini, R.P.; O’Keefe, S.; Vaughan, D. Non-destructive evaluation of apple maturity using an electronic nose system. Journal of Food Engineering 2006, 77, 1018–1023.
- Hui, G.H.; Wu, Y.L.; Ye, D.D.; Ding, W.W.; Zhu, L.S.; Wang, L.Y. Study of peach freshness predictive method based on electronic nose. Food Control 2012, 28, 25–32.
- Zhang, H.M.; Chang, M.X.; Wang, J.; Ye, S. Evaluation of peach quality indices using an electronic nose by MLR, QPST, and BP network. Sensor and Actuators B-Chemical 2008, 134, 332–338.
- Ciosek, P.; Brudzewski, K.; Wroblewski, W. Milk classification by means of an electronic tongue and Support Vector Machine neural network. Measurement Science & Technology 2006, 17, 1379–1384.
- Ren, R.E.; Wang, H.W. Multivariate Statistical Data Analysis—Theory, Method, Example. National Defense Industry Press: Beijing, China, 1997.
- Ravi, R.; Prakash, M.; Bhat, K.K. Characterization of aroma active compounds of cumin (Cuminum cyminum L.) by GC-MS, E-nose, and sensory techniques. International Journal of Food Properties 2013, 16, 1048–1058,
- Liu, M.; Han, X.M.; Tu, K.; Pan, L.Q.; Tu, J.; Tang, L.; … Xiong, Z.H. Application of electronic nose in Chinese spirits quality control and flavour assessment. Food Control 2012, 26, 564–570.
- Gomez, A.H.; Hu, G.X.; Wang, J.; Pereira, A.G. Evaluation of tomato maturity by electronic nose. Computers and Electronics in Agriculture 2006, 54, 44–52.
- Ciosek, P.; Brzozka, Z.; Wroblewski, W. Classification of beverages using a reduced sensor array. Sensor and Actuators B-Chemical 2004, 103, 76–83.
- Pardo, M.; Sberveglieri, G. Classification of electronic nose data with support vector machines. Sensor and Actuators B-Chemical 2005, 107, 730–737.
- Vapnik, V.N. The Nature of Statistical Learning Theory. Springer: New York, NY, 1995.
- Chang, K.W.; Hsieh, C.J.; Lin, C.J. Coordinate descent method for large-scale L2-loss linear support vector machines. Journal of Machine Learning Research 2008, 9, 1369–1398.
- Roussel, S.; Forsberg, G.; Steinmetz, V.; Grenier, P.; Bellon-Maurel, V. Optimisation of electronic nose measurements. Part I: Methodology of output feature selection. Journal of Food Engineering 1998, 37, 207–222.
- Burges, C. A tutorial on support vector machines for pattern recognition. Data Mining and Knowledge Discovery 1998, 2, 121–167.
- Trebar, M.; Steele, N. Application of distributed SVM architectures in classifying forest data cover types. Computers and Electronics in Agriculture 2008, 63, 119–130.
- Li, Q.; Meng, Q.L.; Cai, J.J.; Yoshino, H.; Mochida, A. Applying support vector machine to predict hourly cooling load in the building. Applied Energy 2009, 86, 2249–2256.
- Liu, F.; Yusuf, B.L.; Zhong, J.L.; Feng, L.; He, Y.; Wang, L. Variety identification of rice vinegars using visible and near infrared spectroscopy and multivariate calibrations. International Journal of Food Properties 2011, 14, 1264–1276.
- Wang, X.D.; Ye, M.Y. Hysteresis and non-linearity compensation of relative humidity sensor using support vector machines. Sensor and Actuators B-Chemical 2008, 129, 274–284.