
Abstract
Peanut contains protein, oil, oleic acid, and linoleic acid its flavor is largely determined by pyrazine and aldehyde compounds. Both nutritional value and flavor are standards for measuring peanut quality. In this report, the contents of protein, oil, oleic acid, and linoleic acid were determined using near-infrared reflectance spectroscopy, and flavor compounds were identified using headspace solid-phase microextraction combined with gas chromatography–mass spectrometry in 12 different peanut cultivars. Our results showed that the content of oleic acid in raw peanut ranged from 35.69 to 82.79 g/100 g oil and the linoleic acid content ranged from 2.92 to 44.19 g/100 g oil, with high coefficients of variation. The coefficients of variation of protein and oil were lower, with content of 26.97–33.07 g/100 g raw materials and 45.53–55.53 g/100 g raw materials, respectively. Overall, 14 volatile components were isolated and identified, among which pyrazine and aldehyde compounds were the major aroma components in 12 different peanut cultivars.. Based on these results, peanuts with high protein content have high linoleic oil levels but low oleic oil levels, and roasted peanuts have a high content of pyrazines but low content of aldehydes. The results of this study will enable manufacturers to develop simple tests that predict the flavor of roasted peanuts based on their composition.
INTRODUCTION
Peanut seeds (Arachis hypogaea) have high nutritional and commercial value due to their abundant protein and oil levels.[Citation1] Peanut seeds are approximately 16–34% protein and 50% oil by dry weight.[Citation2] High unsaturated fatty acid concentrations in peanuts account for 80% of peanut oil.[Citation3,Citation4] The nutrition and flavor of peanuts are important factors that determine their product quality and consumer acceptability. In 1966, Mason and others examined the flavor compounds of roasted peanuts and identified isobutyl aldehyde, formaldehyde, and benzene acetaldehyde, as well as other compounds.[Citation5,Citation6] With the development of separation and analysis techniques, hundreds of flavor compounds have been identified from peanuts. Among hundreds of flavor compounds, 2-methylpyrazine, 5-dimethylpyrazine, 2,6-dimethylpyrazine, ethylpyrazine, and 2,3,5-trimethylpyrazine are the main pyrazine derivatives that have been identified.[Citation7–Citation9] Previous studies have shown that pyrazines are the main volatile compounds responsible for the pleasant “peanutty” flavor.[Citation10,Citation11] Formaldehyde, benzene acetaldehyde, aldehyde, and other aldehydes contribute to the typical green, bean-like aroma.[Citation12] Brown and others[Citation13] suggested that hexanal and octanal are responsible for the legume-like aroma of raw peanuts, whereas Braddock and Sims[Citation14] concluded that hexanal is associated with the intense green, grassy off-aroma, and that nonanal contributes a powerful floral scent. The hexanal content of peanuts is lower in high-oleic acid peanuts, and the “peanutty” flavor in high-oleic acid peanuts is more stable. In addition, the shelf life is longer for high-oleic acid peanuts than normal peanuts.[Citation15]
Previous studies have indicated that the aroma flavor quality of roasted peanuts could be predicted by determining the content of pyrazine and aldehyde.[Citation16–Citation19] Pyrazines and aldehydes are formed in peanuts via Maillard reaction. Koehler[Citation20] established that sugars, proteins, and free amino acids are the main precursors of pyrazines and aldehydes. In a subsequent study, Basha and others[Citation21,Citation22] separated peanut seed proteins into 10 fractions using gel filtration, and found that one of the fractions responsible for off-flavors in roasted peanuts is a lipoprotein rich in oleic acid. However, the relationships between the protein, oil, oleic acid, and linoleic acid contents of raw peanuts and the aroma flavor compounds of roasted peanuts remain unclear.
Peanut nutrient content of oil, protein, oleic acid, and linoleic acid can be easy to detect through chemical analysis or near-infrared reflectance spectroscopy (NIRS). NIRS is a rapid and convenient analytical method that has been widely employed in seed moisture, as well as oil and protein content analysis, in raw peanuts.[Citation23–Citation25] It has also been used to measure the concentrations of fatty acids, fractions, isoflavones, lecithin, oligosaccharides, or amino acids in soybean.[Citation26] NIRS is non-destructive and has high reproducibility. Thus, it was used to determine protein, oil, oleic oil, and linoleic acid contents of 12 different peanut cultivars in this study. Flavor components can be determined using solid-phase microextraction–gas chromatography–mass spectrometry (SPME-GC-MS),[Citation27] However, the flavor components of peanuts are affected by factors such as moisture content and storage time, and they are formed after roasting. Thus, peanut flavor components are unstable and difficult to measure. In this study, we examined the relationship between nutrients of raw peanuts and flavor components of roasted peanuts and observed a variable pattern. We then laid the foundation for a method to determine the flavor components. We analyzed the nutrients of 12 peanut cultivars using NIR and determined the flavor components using SPME-GC-MS to evaluate the correlations between chemical components and aroma flavor compounds in peanuts. This information may enable us to improve the flavor of peanut products, thereby benefiting consumers and the peanut industry.
MATERIALS AND METHODS
Peanuts
Twelve peanut cultivars were supplied by the Guizhou Institute of Crop Germplasm Resources in Guizhou Province, China. They were grown under the same field-management regime in 2013. Raw peanuts were dried under the sun until the moisture content was less than 10%, after which they were subsequently stored at 4°C in a ventilated glass bottle. The samples were numbered from GZ01 to GZ12.
Near-Infrared Reflectance Spectrum Analysis
Twelve shelled cultivar peanuts were scanned on a Matrix-I Fourier Transform NIRS (Bruker, Ettlingen, Germany) with a PbS-RT detector. The equipment used a gold-plated large diffused volume integral ball for spectral acquisition, a sampling window with a diameter of 2 cm–1, a high-sensitivity PbS (lead sulfide) detector, and a scanning spectrum from 4000 to 12,000 cm. The peanut samples (at least half a cup, about 30–50 g) were placed in a spinning ring cup of 5 cm diameter. To minimize the effects of particle size, scanning was performed twice on each sample by rotating the ring cup to an angle of 90° before the second scan. Highly reproducible spectral reads were obtained using an integrating sphere with a 10 cm diameter. An integral ball with a large volume can diffuse the reflection spectra over an average of samples with larger particles. Data processing was performed using the OPUS version 5.0 spectroscopic software package and calibration software model QUANT (Bruker).
Separate NIRS calibration models were developed using all of these reference parameters. From the force-deformation profile of each test, the parameters were measured manually and calculated using Microsoft Office Excel.[Citation28]
HS-SPME Analysis
The volatile compounds from 12 peanut cultivars were extracted using headspace solid-phase micro-extraction (HS-SPME).[Citation29,Citation30] The solid-phase silica fiber and the manual SPME holder were purchased from Supelco (Bellefonte, PA, USA). The 100-µm polydimethylsiloxane (PDMS) and 50/30 µm divinylbenzene–carboxen–polydimethylsiloxane (DVB-CAR-PDMS) were maintained in the GC–MS injection port for 30 min at 250 °C to prevent subsequent contamination. The fibers were conditioned prior to use according to the manufacturer’s instructions.
Peanuts were roasted for 3 min using a conventional microwave oven (Midea Inc., Parsippany, NJ, USA); the power of the microwave oven was 750 W with a frequency of 50 HZ. All 12 peanut samples were ground to pass through a 30–60 mesh. Two grams of each sample was placed in a 20-mL headspace vial. In addition, 1 μL of decanoic acid ethyl ester (0.816 µg/mL in methanol) was added to each vial as an internal standard, and the temperature of the headspace bottle was maintained at 80°C with a hot plate. All samples were analyzed in triplicate. Then, a 50/30-µm DVB-CAR-PDMS fiber was exposed to the headspace of the sample, whereas the peanut powder was continuously stirred (250 rpm) for 60 min. All volatile compounds absorbed on the SPME fiber were absorbed at the GC-MS injection port (250°C for 3.5 min) and analyzed using GC–MS, separately.
GC–MS
We used a 7890 gas chromatograph and a 5975 mass spectrometer for isolation and identification of volatile components of 12 peanut cultivars. An HP-5MS capillary column (60 m × 0.25 mm i.d. × 0.25 mm film thickness from Agilent Technologies, Santa Clara, CA, USA) was equipped and high-purity helium (>99.999%) was used as carrier gas at a constant flow of 1.0 mL/min in splitless injection mode. The initial oven temperature was maintained at 60°C for 2 min and then programmed to increase by 5°C/min to a final temperature of 250°C, after which it was held for 10 min at the final temperature. The temperature of the interface, ion source, and quadrupole of the mass spectrometer were set at 250, 230, and 150°C, respectively. The ionization energy was 70 eV and the mass spectrometer was scanned from m/z 45 to 400 atomic mass units (amu) with 1 scan per second. The solvent delay time was 5 min.
Compound Identification
Identification of volatile flavor compounds was based on the National Institute of Standards and Technology (NIST 08) mass spectra library search. The relative percentage content of each volatile compound was calculated based on the peak area of identified compounds and internal standard.[Citation31] The formula was expressed as follows:
where, C is the concentration of the internal standard and M is the weight of the peanut sample.
Data Statistics
The data were analyzed using SPSS 16.0 statistical software (SPSS, Inc., Chicago, IL, USA).
RESULTS AND DISCUSSION
NIRS of the Peanut Samples
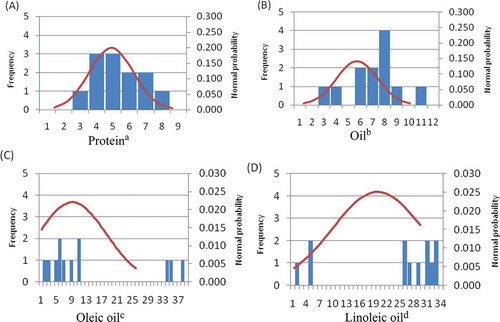
NIRS is a simple and rapid analysis method that can be used in a variety of food technology applications.[Citation32,Citation33] It is self-calibrating with a He–Ne laser and wavelengths, so it does not need calibration by the user. Reliable evaluation of the calibration models of NIRS show that it is capable of rapid prediction of the internal quality of intact food.[Citation34] The results show that the content of oleic acid in GZ03, GZ04, and GZ05 samples was higher than those in the other nine varieties, among which the content of oleic acid in GZ05 was the highest, reaching 82.78%. GZ03 and GZ04 had oleic acid contents of 78.97 and 77.83%, respectively. The oleic acid content in other cultivars ranged from 35 to 48%, which was lower than those in GZ03–GZ05. When the content of the oleic acid increased, the content of linoleic acid decreased. The contents of linoleic acid in GZ05, ZG03, and GZ04 were 2.92, 6.02, and 7.07%, respectively, whereas other varieties ranged from 34 to 45%. In total, the content of oleic acid and linoleic acid in the 12 peanut varieties ranged from 79 to 85%. The change curve of quality in the 12 peanut varieties is presented in , which shows that oleic acid and linoleic acid have a significant negative correlation. A correlation analysis () demonstrated that the coefficients of variation of oleic acid and linoleic acid were higher than those in protein and oil; oleic acid was 34.32% and linoleic acid was 48.89%. The frequency distribution of the forage quality of peanuts is shown in . Based on and , oleic acid and linoleic acid did not follow a normal distribution. As shown in , the content variability of protein in the 12 peanut varieties was the smallest, among which the average content of protein was 30.18%, the variability was 26.97–33.07%, and the coefficient of variation was 6.35. Among the 12 peanut varieties, GZ08 had the highest protein content (33.07%), whereas GZ05 had the lowest (26.97%). shows that the protein contents followed a normal curve. The average content of oil in peanut was 50.36% and the variability was 45.30–55.53%, which also followed a normal distribution (). The protein content in peanut was reported to be approximately 16–34%, oil was about 50% by dry weight,[Citation3] and the concentration of unsaturated fatty acids accounted for 80% of peanut oil.[Citation4,Citation5] Our results were consistent with previous studies. GZ03, ZG04, and GZ05 were unique peanut varieties with high content of oleic acid; among them, the content of oleic acid was higher, whereas the contents of linoleic acid and protein were relatively low. The ratio of oleic/linoleic acid (O/L) has been used to predict the stability and shelf life of oil.[Citation35,Citation36] Bolton and Sanders[Citation37] found that the O/L ratio in normal peanuts was 1.5. Some new high-oleic peanut cultivars[Citation38] have been grown in the southwestern United States. Our results demonstrated that the peanut varieties GZ03, GZ04, and GZ05 grown in China exceeded 77% oleic acid content.
TABLE 1 The content and range of four nutritional components in 12 peanut varieties
FIGURE 1 Change curve of four different nutritional components in 12 peanut varieties.
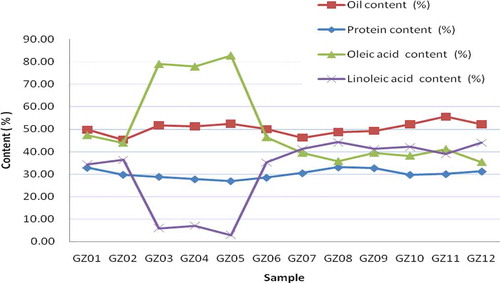
FIGURE 2 Frequency distribution of four different nutritional components in 12 peanut varieties. (A) variable amplitude of protein content was 26.97–33.07%, the class interval was 1.33, and the interval was 6; (B) variable amplitude of oil content was 45.30–55.53%, the class interval was 1.33, and the interval was 10; (C) variable amplitude of oleic oil content was 35.32–82.78%, the class interval was 1.33, and the interval was 47; (D) variable amplitude of linoleic acid content was 2.99–44.19%, the class interval was 1.33, and the interval was 41.
We analyzed the correlations of protein, oil, oleic oil, and linoleic oil in 12 peanut cultivars () and observed a highly negative significant correlation between protein and oleic oil (correlation coefficient was –0.725, p ≤ 0.01). However, a highly positive correlation between protein and linoleic acid (correlation coefficient: 0.728, p ≤ 0.01) was observed. The correlation between protein and oil did not show a negative significant correlation. In addition, we observed a highly negative correlation between oleic oil and linoleic oil (correlation coefficient: –1.00). Based on these results, peanuts with a high content of protein have higher linoleic oil but lower oleic oil contents. Peanuts with high nutrient levels and high protein and oleic oil contents were not observed.
Optimization of HS-SPME Parameters
The extraction efficiency of SPME mainly depended on three key experimental parameters: selection of the fiber coating, extraction temperature, and extraction time. The different fiber types allowed us to analyze a wide range of volatile components. Among different SPME fibers available, those containing components were highly sensitive.[Citation39] First, two fibers (PDMS and PDMS-CAR-DVB) were tested for their extraction efficiency of volatile compounds. The performance of each fiber was determined based on the number and peak area of the identified volatile compounds. Results for the extraction efficacy of the two fibers are presented in and . Based on , the PDMS-CAR-DVB coating showed higher extraction of volatile compounds relative to the PDMS fiber. Second, extraction temperature and time can directly influence the diffusion of volatile through fiber coating. The extraction temperature (50, 60, 70, 80, and 100°C) and time (40, 50, 60, 70, 80, and 90 min) was investigated using the 50/30-μm PDMS-CAR-DVB fiber coating. presents the total peak area of identified volatile compounds using different extraction temperatures and times. As shown in , the total peak area of GZ01 sample gradually increased from 50 to 80°C, but slightly decreased above 80°C. shows that 60 min is sufficient to reach the extraction equilibrium and obtain maximum peak area. By comparing the sum of the peaks and the peak area of the volatile compounds obtained by GZ01, the optimal extraction conditions of SPME were established as follows: extraction fiber, 50/30-μm PDMS-CAR-DVB; extraction temperature, 80°C; extraction time, 60 min.
FIGURE 3 Chromatogram and mass spectra of the GZ01 sample using different extraction fibers ((A): PDMS; (B): [PDMS–CAR–DVB]).
![FIGURE 3 Chromatogram and mass spectra of the GZ01 sample using different extraction fibers ((A): PDMS; (B): [PDMS–CAR–DVB]).](/cms/asset/47bf451d-a1f2-43da-8ee4-793ca5359b4f/ljfp_a_1016575_f0003_b.gif)
FIGURE 4 Effect of (A) extraction temperature; and (B) time on the extraction of volatile compounds from the GZ01 sample according to the sum of total peak area.
Identification of Flavor Compounds
HS-SPME/GC-MS was used for detection and identification of the volatile compounds in 12 peanut samples. Fourteen flavor compounds were identified, including 6 pyrazines, 4 aldehydes, 2 methyl pyrroles, maltphenol, 2,3-dihydro coumarone, and 4-vinyl-2-methoxy phenol (). The content of 2,5-dimethyl pyrazine (2.17–7.64%) was highest among the 12 peanut samples, with an average content of 4.09% and coefficient of variation of 39.55%, followed by 2-acetylpyrazine (0.59–2.14%) and 2-ethyl-6-methyl pyrazine (0.59–1.51%). The average content of 2-acetylpyrazine was 1.27%, with a coefficient of variation of 41.81%. The average content of 2-ethyl-6-methyl pyrazine was 0.99%, with a coefficient of variation of 34.15%. The average contents of 3-ethyl-2,5-dimethyl-pyrazine and 2,3,5-trimethyl-6-ethyl pyrazine were lower than those of other pyrazine compounds, with average contents of 0.41% and 0.03%, respectively. Among the aldehydes, the content of phenylacetaldehyde (0.08–1.35%) was the highest, with an average content of 0.69% and coefficient of variation of 55.74%. Nonanal (0.01–0.08%) was lowest in aldehydes and all volatile compounds, with an average content of 0.03% and coefficient of variation of 56.45%. Benzaldehyde had the highest coefficient of variation, suggesting that it had a large fluctuation, with an average content of 0.32% and coefficient of variation of 88.20%. The average content of 2,3-dihydro coumarone was 0.54%, with a coefficient of variation of 90.30%. The average content of 2-methyl pyrrole was 0.28%, with a coefficient of variation of 39.33%. The average content of maltphenol was 0.2%, with a coefficient of variation of 52.40%. The average content of 4-vinyl-2-methoxy phenol was 0.12%, with a coefficient of variation of 66.67%.
TABLE 2 Percentage content and mutation analysis of volatile compounds in 12 peanut varieties*
TABLE 3 Pearson correlation coefficient analysis between four nutritional components and 14 volatile compounds
Correlation Analyses
In our study, six pyrazines and four aldehydes were identified, which accounted for the main aroma components in peanut. Similar to our study, previous studies have reported that pyrazines and aldehydes are the main flavor compounds in roasted peanuts.[Citation40–Citation42] Meanwhile, we found that the content of 2,5-dimethyl pyrazine was the most highly correlated with the aroma of roasted peanut, which is consistent with Baker and others.[Citation18] We observed a close association between various compounds based on the correlation analysis (). Pyrazines were the main aroma components in peanut, and correlation analysis showed that these pyrazine compounds were positively correlated. The correlation coefficients between 2-methyl pyrazine and 2,5-dimethyl pyrazine, 2-ethyl-6-methyl pyrazine, 2-acetyl pyrazine, 3-ethyl-2,5-dimethyl-pyrazine, and 2,3,5-trimethyl-6-ethyl pyrazine were 0.903, 0.963, 0.987, 0.862, and 0.909, respectively. The significant positive correlation between these compounds suggested that these pyrazines exist stably in peanut. In addition, with increasing 5-dimethyl pyrazine and 2-acetyl pyrazine content, the content of other pyrazines will also increase, thus increasing peanut flavor. As shown in , -methyl pyrrole, malt phenol, 2,3-dihydro coumarone, and 4-vinyl-2-methoxy phenol are strongly positively correlated with six types of pyrazine compounds. In addition, protein content showed a negative correlation with 2-methyl pyrazine, 2-ethyl-6-methyl pyrazine, 2-acetylpyrazine, and 2,3,5-trimethyl-6-ethyl pyrazine, but did not reach significant levels. Oleic showed a positive correlation with six kinds of pyrazine compounds and positive significant correlation with 2,3,5-trimethyl-6-ethyl pyrazine (correlation coefficient is 0.552). This finding suggested that higher content of oleic acid in peanuts will produce more pyrazine compounds after roasting, ensuring that the peanuts have a strong roasted aroma and a longer period of storage.
Four aldehydes were incompletely positively correlated with six pyrazines. Nonanal showed a positive correlation with 2-methyl pyrazine (0.511), 2-ethyl-6-methyl pyrazine (0.521), and 2-acetyl pyrazine (0.540), and a significant positive correlation with 2,5-dimethyl pyrazine (0.688) and 3-ethyl-5-dimethyl-pyrazine (0.762). Phenylacetaldehyde showed a significant positive correlation with 3-ethyl-5-dimethyl-pyrazine (0.866) and 2,3,5-trimethyl-6-ethyl pyrazine (0.925). Benzaldehyde had a positive correlation with 2,5-dimethyl pyrazine (0.521) and a significant positive correlation with 3-ethyl-5-dimethyl-pyrazine (0.661). Hexanal showed a significant positive correlation with 2,5-dimethyl pyrazine and 3-ethyl-5-dimethyl-pyrazine, but did not reach significant levels. In addition, hexanal showed a negative correlation with four other pyrazine compounds. Therefore, when the content of hexanal in peanut was relatively high, the contents of 2-methyl pyrazine, 2-ethyl-6-methyl pyrazine, 2-acetyl pyrazine, and 2,3,5-trimethyl-6-ethyl pyrazine were relatively low and the content of characteristic flavor compounds decreased, which affected the peanut aroma. Based on the analysis of the relationship of nutrition and aldehyde compounds, we found that protein had a significant positive correlation with hexanal and benzaldehyde, with correlation coefficients of 0.702 and 0.662, respectively. Oleic acid showed a negative correlation with hexanal and benzaldehyde, with correlation coefficients of –0.753 and –0.531, respectively. Based on the above results, at relatively high oleic acid contents, the levels of protein in peanut were lower. In addition, with a high content of characteristic pyrazine compounds, the content of hexanal and benzaldehyde in peanut was lower. The content of pyrazine and aldehyde compounds can be used to determine the quality of peanut flavor, and a high content of pyrazine compounds will increase the roasted peanut fragrance. Aldehydes provided the off-flavor compounds in peanuts.[Citation12] Singleon and others[Citation43] observed a relationship among ethanol, acetaldehyde, and ethyl acetate, which provided the off-flavor compounds in peanuts. Previous studies[Citation15] have found that the aroma of hexanal and nonanal in roasted peanuts provides “green” and “beany” scents. Furthermore, phenylacetaldehyde and guaiacol have been determined as major off-flavor compounds of roasting peanuts in the microwave using gas chromatography–olfactometry, GC–MS, and aroma extract dilution analysis [Citation11,Citation38] The results of this study will enable manufacturers to develop simple tests to predict the flavor of roasted peanuts based on their composition. In future studies, more peanut varieties should be used to analyze the relationship between nutrients and flavor, combined with a chemometric method to establish a quality control model for peanuts.
CONCLUSION
In this report, the contents of protein, oil, oleic acid, and linoleic acid were determined using NIRS, and volatile compounds were identified using HS-SPME combined with GC-MS in 12 peanut varieties. The results were then statistically analyzed by employing Pearson correlation coefficients. Our results demonstrated that the content of oleic acid and linoleic acid varieties was 79–85%, and that the average contents of protein and oil were 30.18 and 50.36% among the 12 peanut cultivars. The PDMS-CAR-DVB fiber performed best during the optimization process with an extraction temperature of 80°C and extraction time of 60 min. Fourteen volatile compounds were identified, among which pyrazine and aldehyde compounds were the major aroma components in 12 peanut cultivars. Pearson correlation coefficients revealed close association between various compounds: Pyrazine compounds showed a positive correlation with oleic acid and oleic acid had a positive correlation with pyrazine compounds. Aldehydes were incompletely positively correlated with six pyrazines. Based on these results, the content of pyrazine and aldehyde compounds could be used to determine the quality of peanut flavor. A high content of pyrazine compounds will lead to a stronger fragrance. We believe that the combination of NIRS and GC-MS with variable correlation coefficient analysis will enable manufacturers to develop simple tests to predict the flavor of roasted peanuts based on the composition of raw peanuts.
FUNDING
This work was supported by NSF31460415. Additional funding was provided by the Science and Technology Department of Guizhou [Qian K.H.Y.S.C.N. (2012) 4002 and Qian K.H.T.X (2014) 4001].
Additional information
Funding
REFERENCES
- Wang, M.L.; Raymer, P.; Chinnan, M.; Pittman, R.N. Screening of the USDA Peanut Germplasm for Oil Content and Fatty Acid Composition. Biomass Bioenerg 2012, 39, 336–343.
- Isleib, T.G.; Pattee, H.E.; Giesbrecht, F.G. Oil, Sugar, and Starch Characteristics in Peanut Breeding Lines Selected for Low and High Oil Content and Their Combining Ability. J Am Chem Soc 2004, 52(10), 3165–3168.
- Grosso, N.R.; Nepote, V.; Guzman, C.A. Chemical Composition of Some Wild Peanut Species (Arachis L.) Seeds. J Agric Food Chem 2000, 48(3), 806–809.
- Rodrigues, A.C.; Stroher, G.L.; Freitas, A.R.; Visentainer, J.V.; Oliveira, C.C.; De Souza, N.E. The Effect of Genotype and Roasting on the Fatty Acid Composition of Peanuts. Food Res Int 2011, 44(1), 187–192.
- Mason, M.E.; Johnson, B.; Hammng, M. Volatile Components of Roasted Peanuts. The Major Monocarbonyls and Some Noncarbonyl Components. J Agric Food Chem 1967, 15(1), 66–73.
- Mason, M.E.; Johnson, B.; Hamming, M. Flavor Components of Roasted Peanuts. Some Low Molecular Weight Pyrazines and a Pyrrole. J Agric Food Chem 1966, 14(15), 454–460.
- Young, C.T.; Hovis, A.R. A Method for the Rapid Analysis of Headspace Volatiles of Raw and Roasted Peanuts. J Food Sci 1990, 55(1), 279–280.
- Bett, K.L.; Vercellotti, J.R.; Lovegren, N.V. A Comparison of the Flavor and Compositional Quality of Peanuts from Several Origins. Food Chem 1994, 51(1), 21–27.
- Schirack, A.V.; Drake, M.A.; Sanders, T.H.; Sandeep, K. Characterization of Aroma-Active Compounds in Microwave Blanched Peanuts. J Food Sci 2006, 71(9), 513–520.
- Pattee, H.E.; Beasley, E.O.; Singleton, J.A. Isolation and Identification of Volatile Components from High-Temperature-Cured Off-Flavor Peanuts. J Food Sci 1965, 30(3), 388–392.
- Ho, C.T.; Lee, M.H.; Chang, S.S. Isolation and Identification of Volatile Compounds from Roasted Peanuts. J Food Sci 1982, 47(1), 127–133.
- Warner, K.J.H.; Dimick, P.S.; Ziegler, G.R.; Mumma, R.O.; Hollender, R. Flavor-Fade and Off-Flavors in Ground Roasted Peanuts as Related to Selected Pyrazines and Alde Hydes. J Food Sci 1996, 61(2), 469–472.
- Brown, D.F.; Senn, V.J.; Dollear, F.G. Comparison of Carbonyl-Compounds in Roasted and Nonroasted Spanish and Runner Peanuts. J Agric Food Chem 1973, 21(3), 463–467.
- Braddock, J.C.; Sims, C.A.; O’Keefe, S.F. Flavor and Oxidative Stability of Roasted High Oleic Acid Peanuts. J Food Sci 1995, 60(3), 489–493.
- Reed, K.A.; Sims, C.A.; Gorbet, D.W.; O’Keefe, S.F. Storage Water Activity Affects Flavor Fade in High and Normal Oleic Peanuts. Food Res Int 2002, 35(8), 769–774.
- Ho, C.T.; Jin, Q.Z.; Lee, M.H.; Chang, S.S. Positive Identification of New Alkyloxazoles, Alkylthiazoles, and Piperidine in Roasted Peanut Flavor. J Agric Food Chem 1983, 31(6), 1384–1386.
- Baker, G.L.; Cornell, J.A.; Gorbet, D.W.; O’Keefe, S.F.; Sims, C.A.; Talcott, S.T. Determination of Pyrazine and Flavor Variations in Peanut Genotypes During Roasting. J Food Sci 2003, 68(1), 394–400.
- Greene, J.L.; Sanders, T.H.; Drake, M.A. Characterization of Volatile Compounds Contributing to Naturally Occurring Fruity Fermented Flavor in Peanuts. J Agric Food Chem 2008, 56(17), 8096–8102.
- Chetschik, I.; Granvog, M.; Scheberle, P.E. Quantitation of Key Peanut Aroma Compounds in Raw Peanuts and Pan-Roasted Peanut Meal. Aroma Reconstitution and Comparison with Commercial Peanut Products. J Agric Food Chem 2010, 58(20), 11018–11026.
- Koehler, P.E.; Mason, M.E.; Newell, J.A. Formation of Pyrazine Compounds in Sugar Amino Acid Model Systems. J Agric Food Chem 1969, 17(2), 393–396.
- Basha, S.M.; Young, C.T. Protein Fraction Producing Off-Flavor Headspace Volatiles in Peanut Seed. J Agric Food Chem 1996, 44(1), 3070–3074.
- Sheikh, M.; Basha, S.M.; Ying, M.; Vives, M.R. Young CT. Fractionation and Characterization of a Protein Fraction Producing Off-Flavor Volatiles in Peanut Seed. J Agric Food Chem 1998, 46(6), 2130–2135.
- Kandala, C.V.K.; Sundaram, J. Determination of Moisture Content Using NIR Reflectance Spectroscopy with Single Calibration for Both Valencia and Virginia In-Shell Peanuts. Trans ASABE 2012, 55(2), 609–612.
- Fox, G.; Cruickshank, A. Near Infrared Reflectance as a Rapid and Inexpensive Surrogate Measure for Fatty Acid Composition and Oil Content of Peanuts (Arachis hypogaea L). J Near Infrared Spec 2005, 13(5), 287–291.
- Sundaram, J.; Kandala, C.V.K.; Butts, C.L. Classification of In-Shell Peanut Kernels Nondestructively Using VIS/NIR Reflectance Spectroscopy. Sensing and Instrumentation for Food Quality and Safety 2010, 4(2), 82–94.
- Sang-Ik, H.; Jong-Hyun, C.; Byilyeu, K.; Grover, S.J.; Jeong-Dong, L. Non-Destructive Determination of High Oleic Acid Content in Single Soybean Seeds by Near Infrared Reflectance Spectroscopy. J Amer Oil Chem Soc 2014, 91(2), 229–234.
- Ravi, R.; Prakash, M.; Bhat, K.K. Characterization of Aroma Active Compounds of Cumin (Cuminum cyminum L.) by GC-MS, E-Nose, and Sensory Techniques. International Journal of Food Properties 2013, 16(5), 1048–1058.
- Panmanas, S.; Munehiro, T.; Takayuki, K.; Phil, W. Nondestructive Estimation of Maturity and Textural Properties on Tomato “Momotaro” by Near Infrared Spectroscopy. International Journal of Food Properties 2012, 112(3), 218–226.
- Ho, C.W.; Wan Aida W.M.; Maskat, M.Y.; Osman, H. Optimization of Headspace Solid Phase Microextraction (HS-SPME) for Gas Chromatography Mass Spectrometry (GC-MS) Analysis of Aroma Compound In Palm Sugar (Arengapinnata). J Food Compos Anal 2006, 19(8),822–830..
- Yi, Z.; Bei, G.; Mingwei, Z.; John, S.; Yujuan, S. Headspace Solid-Phase Microextraction–Gas-Chromatography–Mass Spectrometry Analysis of the Volatile Components of Longan (Dimocarpus longan Lour). Eur Food Res Technol 2009, 229(3), 457–465.
- Saison, D.; De Schutter, D.P.; Delvaux, F.; Delvaux, F.R. Optimisation of a Complete Method for the Analysis of Volatiles Involved in the Flavour Stability of Beer by Solid-Phase Microextraction in Combination with Gas Chromatography and Mass Spectrometry. J Chromatogr A 2008, 1190(1–2), 342–349.
- Mohammad, A.; Tooraj, A.N. Prediction of Poultry Egg Freshness Using Vis-NIR Spectroscopy with Maximum Likelihood Method. International Journal of Food Properties 2014, 17(10), 2166–2176.
- Singh, C.B.; Jayas, D.S.; Paliwal, J.; White, N.D.G. Fungal Damage Detection in Wheat Using Short-Wave Near-Infrared Hyperspectral and Digital Colour Imaging. International Journal of Food Properties 2012, 15(1), 11–24.
- Liu, Y.; Yibin, Y. Noninvasive Method for Internal Quality Evaluation of Pear Fruit Using Fiber-Optic FT-NIR Spectrometry. International Journal of Food Properties 2007, 10(4), 877–886.
- Sang-Ik, H.; Jong-Hyun, C.; Byilyeu, K.; Grover, S.J.; Jeong-Dong, L. Non-Destructive Determination of High Oleic Acid Content in Single Soybean Seeds by Near Infrared Reflectance Spectroscopy. J Amer Oil Chem Soc 2014, 91(2), 229–234.
- Casini, C.; Dardanelli, J.L.; Martinez, M.J.; Balzarini, M.; Borgogno, C.S.; Nassetta, M. Oil Quality and Sugar Contents of Peanuts (Arachis Hypogaea) Grown Inargentina: Their Relationship with Climatic Variables and Seed Yield. J Agric Food Chem 2003, 51(21):6309–6313.
- Bolton, G.E.; Sanders, T.H. Effect of Roasting Oil Composition on the Stability of Roasted High-Oleic Peanuts. J Am Oil Chem Soc 2002, 79(2), 129–132.
- Jonnala, R.S.; Dunford, N.T.; Dashiell, K.E. New High-Oleic Peanut Cultivars Grown in the Southwestern United States. J Am Oil Chem Soc 2005, 82(2), 125–128.
- Lv, S.; Wu, Y.; Li, C.; Xu, Y.; Liu, L.; Meng, Q. Comparative Analysis of Pu-erh and Fuzhuan Teas by Fully Automatic Headspace Solid-Phase Microextraction Coupled with Gas Chromatography–Mass Spectrometry and Chemometric Methods. J Agric Food Chem 2014, 62(8), 1810–1818.
- Shu, C.K.; Waller, G.R. Volatile Components of Roasted Peanuts: Comparative Analyses of the Basic Fraction. J Food Sci 1971, 36(4), 579–583.
- Leunissen, M.; Davidson, V.J.; Kakuda, Y. Analysis of Volatile Flavor Components in Roasted Peanuts Using Supercritical Fluid Extraction and Gas Chromatography–Mass Spectrometry. J Agric Food Chem 1996, 44(9), 264–269.
- Chetschik, I.; Granvogl, M.; Schieberle, P. Comparison of the Key Aroma Compounds in Organically Grown, Raw West-African Peanuts (Arachis hypogaea) and in Ground, Pan-Roasted Meal Produced Thereof. J Agric Food Chem 2008, 56, 10237–10243.
- Singleon, J.A.; Pattee, H.E.; Johns, E.B. Influence of Curing Temperature on the Volatile Components of Peanuts. J Agric Food Chem 1971, 19(1), 130–133.