
Abstract
Protein fractions were extracted from pumpkin (Cucurbita maxima) seeds with deionized water, salt solution, and alkali solution, and characterized under alkaline (pH 8) and ionic strength conditions for protein solubility, interfacial pressure, and functional properties. The supernatants obtained from the protein fractions after hydration and centrifugation were designed deionized water supernatant, salt solution supernatant, and alkali solution supernatant. All protein fractions showed poor foamability and very low stability. The designed deionized water supernatant presented the highest emulsifying properties. In terms of stability, designed deionized water supernatant emulsions flocculate during storage but with low rates of coalescence compared to the two other fractions.
INTRODUCTION
Pumpkin (Cucurbita sp.) seeds are rich source of proteins (24 to 36.5 %) and oil (31.5 to 51%).[Citation1–Citation4] In Austria, Hungary, Slovenia, and Serbia, fresh pumpkin seeds are mainly used for pumpkin oil production.[Citation5] In Tunisia, the individual annual average of pumpkin consumption in food dishes is about 5.1 kg.[Citation6] Pumpkin seeds are also used directly as snacks after salting and roasting. To develop their food uses, pumpkin seed proteins need to be produced as protein enriched fractions obtained by sequential extraction in water, salt solution, alkali solution, and alcohol (70% ethanol), respectively.[Citation7]
Protein-based ingredients of pumpkin have not yet been introduced at a significant scale in food applications. This is presumably due to limited information on the structural and functional properties of pumpkin proteins. In order for plant proteins to be successfully introduced in food applications, they should ideally possess a number of desirable characteristics, namely functional properties.[Citation8,Citation9] Proteins are generally used as food ingredients for their functional properties and/or to impart certain specific characteristics to the final product. These properties are intrinsic physicochemical characteristics that affect the behavior of proteins in food systems during processing, manufacturing, storage, and preparation.[Citation10] Therefore, the adoption of pumpkin seed proteins into large-scale application in the food industry depends heavily on the range of physicochemical properties they display. In fact, several plant seeds have recently been reported to offer new protein sources with attractive functional properties for food, including black gram,[Citation11] sesame,[Citation12] pea,[Citation13] and lentil[Citation14] protein isolates, kidney bean (albumins and globulins),[Citation15] and Ginkgo biloba (albumins and globulins).[Citation16] The literature indicates that they offer promising alternative ingredients in various food applications.
Furthermore, it is important to characterize the functionalities of proteins before their application in certain food systems. Proteins are used in various food products and formulations as nutritional, gelling, emulsifying or foaming agents.[Citation17,Citation18] Foaming and emulsifying capacities are desirable techno-functional properties that help improve the texture and appearance of foods. Accordingly, proteins with good surface properties and solubility are highly valued food ingredients. Moreover, and since the functionality of food proteins is heavily affected by several extrinsic factors, such as pH, temperature, and ionic strength, it is important to understand their effects and optimal levels on the functional properties of food proteins.
Despite the large flow of data on the functional properties of various plant-derived proteins, little data is currently available on the functional properties of protein fractions from pumpkin (Cucurbita maxima) seeds. To the best of the authors’ knowledge, no study so far has reported on the functionality of protein fractions extracted from the Cucurbitaceae family. Moreover, previous works on the functional properties of Cucurbitaceae seed proteins have generally focused on defatted flour, whole meal, concentrate, or isolate.[Citation2,Citation19–Citation21] Considering the promising opportunities that protein fractions from pumpkin seeds could open for the development of novel, efficient and cost-effective functional proteins, the present study was undertaken to investigate the interfacial tension of pumpkin seed (Cucurbita maxima) protein fractions belonging to the Cucurbitaceae family. The study also aimed to evaluate the effect of ionic strength on the functional properties of the title protein fractions and, hence, their potential use as food ingredients in the food industry.
MATERIAL AND METHODS
Seed Material
The pumpkin seed (Cucurbita maxima) samples used in this work were purchased from the local market of Chebika, South East Tunisia. They were immediately isolated, washed to remove impurities, and air-dried.
Sample Preparation
Prior to analysis, the seeds were milled in a heavy grinder (Brown, Germany), sifted through a mesh sieve (200 μm aperture size) to obtain a fine powder, and kept at 4°C until further use. The seed flour was defatted with pentane. The flour/solvent slurry was stirred at a 1:10 w/v ratio for 24 h, and the solvent was then removed by centrifugation. After that, the mixture was dried at room temperature and stored in airtight sample bottles at 4°C until subsequent use.
Fractionation of Protein Extracts
Pumpkin proteins were fractionated from pentane defatted meal (PDF) according to the Osborne differential extraction procedure described by Horax et al.[Citation22] The meal/water suspensions (20 g of meal into 100 mL of deionized water) were stirred for 2 h at room temperature and centrifuged for 30 min at 20,000 g to separate the supernatant, called deionized water extract (DWE), from the pellet. The same extraction/separation conditions were kept for the next successive protein extraction steps. The water extract pellet was resuspended into 100 mL of 1 mol/L NaCl solution and stirred as mentioned previously. The supernatant obtained after centrifugation, designated as salt extract (SE), was then extracted in 100 mL of deionized water adjusted at pH 11 with 0.5 mol/L sodium hydroxide, leading to the alkali extract (AE). Each extraction was repeated twice. After each extraction, the pellets were washed twice using 20 mL of solvent to collect the residual protein entrapped in the insoluble residues. The washings and first extract were combined for each fraction. The DWE, SE, and AE were precipitated for isolation by adjusting the pH of the obtained supernatant to the pH corresponding to the minimum of solubility (pHms) determined from the turbidity experiment.[Citation7] The pH was adjusted by 1 mol/L HCl or 1 mol/L NaOH in acidic or alkaline pH, respectively. After centrifugation at 15,000 g for 15 min, the isolated protein precipitates were washed twice using deionized water at their respective pHms and recentrifuged. Finally, the resulting protein fractions were resolubilized by adjusting the pH to 7.0, freeze-dried, and stored at 4°C for further analysis.
Protein Solubility (PS)
The DWE, SE, and AE showed a protein content of 31.4, 72.9, and 80.6%, respectively.[Citation7] Aqueous dispersions of the DWE, SE, and AE were prepared using 50 mM Tris buffer, pH 8, and various NaCl concentrations (0, 0.5, 1 M) such that each had a final protein concentration of 5 mg/mL. All dispersions (10 mL) were constantly sonicated for 10 min at a power level of 25%, hydrated under moderated agitation overnight at 4°C, and centrifuged at 10,000 g for 20 min. The protein content in the dispersions and supernatants was then determined by the Bicinchoninic Acid Assay using bovine serum albumin (BSA) as a standard protein.[Citation23]
PS (%) was expressed as follows:
The supernatants obtained after the centrifugation of DWE, SE, and AE dispersions were identified as DWE supernatant (DWES), SE supernatant (SES), and AE supernatant (AES), respectively.
Dynamic Light Scattering (DLS)
The DLS experiments were carried out with a fixed scattering angle of 173° on supernatants (DWES, SES, and AES) at different ionic strength (0, 0.5, and 1 M NaCl) using a Zetasizer Instrument (Malvern Instruments, UK) equipped He-Ne laser operating at a wavelength of 633 nm. The average diffusion coefficients and hence, hydrodynamic diameter distribution of soluble protein aggregates were obtained using a Contin algorithm. Samples were equilibrated at 20°C before measurement by the Zetasizer instrument. Experiments were carried out in duplicates.
Static Surface Tension Measurements
Surface tension measurements were performed to evaluate adsorption at the air-water interface and surface properties of protein fractions. The surface pressures of DWES, SES, and AES for different protein concentrations (10–4 to 1.2 mg/mL), were measured at different ionic strength conditions on micro plate using a Delta-8 microtensiometer (KibronInc, Helsinki, Finland). Surface activity was expressed by the surface pressure, П = γ0- γ, where γ0 and γ refer to interfacial tensions in the absence and presence of adsorbed surfactants, respectively.
Sodium Dodecyl Sulphate Polyacrylamide Gel Electrophoresis (SDS-PAGE) of DWES, SES, and AES
SDS-PAGE was performed according to the Laemmli procedure[Citation24] using a slab gel (4% stacking gel and 15% separating gel) in an SDS-Tris-Glycine discontinuous buffer system. Protein solutions at different ionic strength values (0, 0.5, and 1 M NaCl; 2 µg protein/µL) were prepared in reducing (62.5 mM Tris-HCl pH 6.8, 2% SDS, 10% glycerol, 0.05% bromophenol blue, and 0.05% 2-β-mercaptoethanol) and non-reducing (62.5 mM Tris-HCl pH 6.8, 2% SDS, 10% glycerol, and 0.05% bromophenol blue) buffer solutions. Ten microliters of the solution were loaded onto the gel. Electrophoresis was performed at a constant current of 25 mA per gel for about 90 min. The gel was stained by 0.1% Coomassie Blue in an acetic acid/ethanol/water solution (10/40/50, v/v/v) and then destained in an acetic acid/ethanol/ water solution (10/20/70, v/v/v). The approximate molecular sizes of the proteins were determined using Euromedex molecular size standards (Strasbourg, France).
Foam Formation and Stability
Protein foaming ability and foam stability were investigated using the bubbling technique. In brief, a gas phase was injected through a porous plate using the FOAMSCAN device from Interfacial Technology Concept (Longessaigne, France). FOAMSCAN is a versatile instrument for determining the ability of a liquid phase to generate foams by measuring the volume of the foam formed over time following the injection of a constant gas flow into a controlled quantity of liquid until the desired volume of foam is obtained. The time necessary for foam formation, denoted as sparging time, and the amount of liquid phase in the foam (based on foam conductivity) were used to estimate the foaming properties of protein solutions. The gas feed was then stopped, and foam stability was monitored by following the variation in foam volume and drainage rate over time. The main quantitative parameter used to estimate foam stability was the time necessary to drain half the volume of foam (denoted half-life time). During experiments, foam height was constantly recorded using image processing.
The quantity of the liquid entrapped in the foam and the drainage rate of the liquid phase were regularly monitored using conductivity measurements, which gave access to foam density.
In this work, 12 mL of the aqueous phase (DWES, SES, and AES) at a protein concentration of 1 mg /mL were foamed in a glass column (21 mm in diameter). Nitrogen was fed into the column at 35 mL/min via a porous glass filter (pore size 10–14 μm). Bubbling was stopped when the foam volume reached 35 mL. Foaming experiments were carried out in triplicates for statistical purposes.
Preparation of O/W Emulsions
Emulsification was performed using sunflower oil (Ф = 0.1) as oil volume fractions, protein concentrations of 1.2 mg/mL in the aqueous phase (DWES, SES, and AES), and different ionic strength conditions (0, 0.5, and 1 M NaCl). In all cases, a fixed volume (3 mL) of emulsion was prepared using an ultrasound homogenizer (SONICS Vibra Cell VCX750) with a 3 mm diameter probe and operating at a power level of 25%, making four pulses of 30 s separated by a break of 10 s to avoid the excessive rise of emulsion temperature.
Droplet Size Distribution Measurements
Droplet size distributions (DSD) were measured by a laser granulometer MALVERN MASTERSIZER S (Malvern Instruments, Orsay, France). An amount of 0.5 mL of emulsion was taken and diluted in 1% SDS to facilitate the disruption of flocs prior to each DSD measurement. The values of the volume mean diameter, d4,3, and surface mean diameter, d3,2, which is inversely proportional to the specific surface area of droplets, were calculated as follows:
where, ni is the number of droplets in the class with mean diameter di.
Interfacial Protein Concentration
Protein concentration was referred to as emulsion volume, and interfacial protein concentration, Г (mg/m2) was calculated as follows:
where, Cap is the protein concentration (mg/mL emulsion), and Sv is the specific interfacial area (m2/mL emulsion). This procedure was developed by Martinet et al.[Citation25] The specific interfacial area for each emulsion was calculated using the relationship ×Ф, where Ф is the oil volume fraction and d3,2 is the Sauter diameter.[Citation26]
Microscopic Observation
The emulsions were submitted to microscopic observation at room temperature after 72 h of storage at 4°C. Samples were first diluted ten times in their corresponding aqueous solution to reduce the oil volume fraction of emulsions. A drop was then taken from each sample and carefully placed on a glass slide, covered with a cover slip, and observed at 10X objective using an Axioskop2 microscope (Zeiss, Germany) connected to a DSC-575 digital camera (Sony Corporation, Japan).
Statistical Analysis
Three replicates of each measurement were carried out. The data were analyzed by the “Statistica V5.1” software.[Citation27] Values were expressed as mean ± SD. The means were compared using the one-way analysis of variance (ANOVA) followed by the HSD Turkey’s test. The differences between individual means were considered significant at p < 0.05.
RESULTS AND DISCUSSION
PS of the DWE, SE, and AE
Solubility is an important prerequisite for a protein to be useful as a functional ingredient in foods.[Citation28] It may confer the advantages of ease of addition and uniform distribution of proteins to food products. Solubility is a physicochemical property of a protein that critically affects texture, color, and sensory properties of products,[Citation14] including emulsifying, foaming, and gel forming properties.[Citation29] It is highly valued in several protein-based formulations, such as emulsions, foams, and gels. The PS of DWE, SE, and AE at different ionic strength conditions is illustrated in . The results revealed that the DWE fraction exhibited the highest solubility in the absence of sodium chloride (63.9%) compared to the SE (58.3%) and AE (39.5%) fractions. The higher rate of solubility observed for DWE could presumably be due to its lower content in hydrophobic amino acids.[Citation7] Lawal et al.[Citation30] reported that the solubility rates of albumin and globulin extracted from African locust bean at the same pH were 75 and 70%, respectively. According to Adebiyi and Aluko,[Citation13] a quite complete solubility of water soluble (WS) fraction extracted from pea seed protein isolate at this alkaline pH was also observed. Similar observations were also found for the WS fraction from oat[Citation31] and sunflower.[Citation32] Under alkaline conditions (pH 8), the solubility of the salt-soluble (SS) fraction from pea was similar to that of SE from pumpkin (Cucurbita maxima) seeds, reaching about 58%. Conversely, the solubility of the alkaline-soluble (AS) fraction was rather higher than that of AE.[Citation13] The low solubility of the AE even at alkaline pH could presumably be due to its rather high hydrophobic amino acid composition (40.7 mg/100 mg protein).[Citation7] The high solubility of DWE and SE provide further support for their promising candidacy for future industrial application in products that have basic pH values.
FIGURE 1 Effect of NaCl concentration on solubility of pumpkin protein extracts. Bars with different letters have significantly different mean values (p < 0.05).
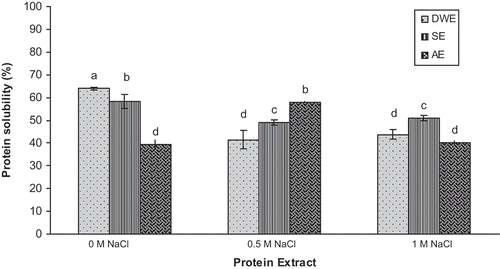
The increase in ionic strength was noted to induce a decrease in the PS of the DWE fraction, which reached 41.4 and 43.7% at 0.5 M NaCl and 1 M NaCl, respectively. A similar trend was observed for the SE fraction (~50% at 0.5 M and 1 M NaCl). The addition of NaCl could have promoted the formation of insoluble complexes, which explained the difference observed with highest PS in the absence of sodium chloride. For the AE fraction, PS reached a maximum at 0.5 M NaCl (58%) but decreased at a concentration of 1 M NaCl (40%). This may be due to the ionic strength, which allowed for the dissociation and consequent interaction with the proteins, thereby increasing solubility (“salting in” effect) with 0.5 M NaCl. At higher concentration, however, NaCl produced a dehydrating effect on the protein, which tended to aggregate, resulting in the decrease of solubility (“salting out” effect).[Citation33]
Characteristics of Soluble Protein Aggregates
The evolution of the population of soluble aggregates at different ionic strength was further investigated through the DLS of the DWES, SES, and AES fractions at a PS rate of 30% (w/v). The average diameter of the DLS size distribution is reported in . The results revealed that, in the absence of sodium chloride, the DWES (control) fraction showed a major population (89.3%) characterized by a mean diameter of about 14.6 nm. The DLS curves of DWES at 0.5 M NaCl and 1 M NaCl showed major peaks at 43 and 135 nm, respectively. The findings also showed the presence of some other peaks at higher sizes, which could be related to the presence of larger aggregates. The soluble proteins were not in monomeric or dimeric form but in different aggregated states regardless of the salt concentration. The increase of ionic strength was noted to reduce the electrostatic repulsion between proteins, which might have favored aggregation by the salting out of protein monomers and dimmers.[Citation10,Citation34] These results are consistent with the ones obtained for the PS of DWE. The decrease in PS could be related to the formation of soluble aggregates with higher particle sizes.
TABLE 1 Effect of ionic strength on the diameter distribution of soluble aggregates by DLS (nm) of the DWES, SES, and the AES of pumpkin protein extracts. When diameter distributions were multimodal, mean size, and proportion of each population were presented
Concerning the SES fraction, the size distribution observed with 0 M NaCl, 0.5 M, and 1 M NaCl was noted to present only one population, with a mean average size of 51.8, 5.9, and 5.6 nm, respectively. Although the results of SES PS were expected to match those of SE (), the findings revealed that, in the absence of salt, the SE fraction showing the maximum rate of PS (58.3%) presented the highest mean average size of aggregates. At 0.5 M NaCl and 1 M NaCl, however, the decrease in the PS of SES was related to a shift from an aggregated to a monomeric or dimeric form of proteins. The same evolution was observed for size distributions of AES which, at 0 M NaCl, showed a bimodal shape with a major peak at 31.3 nm and a minor one at 150.2 nm. At 0.5 M and 1 M NaCl, the DLS experimental data provided a mean average size of 5.0 and 5.6 nm, respectively ().
Electrophoretic Patterns of the Protein Extracts
shows the electrophoretic patterns recorded for the DWES, SES, and AES fractions at different ionic strength values and under non-reducing and reducing conditions. The results revealed that, under non-reducing conditions and regardless of ionic strength, the DWES showed a few minor bands with molecular masses in the range of 11.2–14.7 kDa. The protein component with a molecular weight of around 14.3 kDa corresponded to the pumpkin 2S albumin.[Citation35] After reduction, the components with lower molecular weights remained almost unchanged, showing values in the ranges of 11.9–13.8, 10.8–13.8, and 11.1–12.5 kDa at 0, 0.5, and 1 M NaCl, respectively. Under non-reducing conditions, the DWES fraction was also noted to be devoid of major band at around 63.6 kDa and minor bands in the range 7–10 kDa, which were previously observed in the DWE of pumpkin seed extract described in the work of Rezig et al.[Citation7] The electrophoretic patterns of DWES suggested that the protein structural conformation of this protein fraction was largely affected by the alkaline extraction procedure (pH 8). The rather similar sub-unit composition of DWES at all ionic strength implies that those protein fractions may have closely similar protein compositions but contain protein components with different structural conformations.
FIGURE 2 Electrophoresis of seed protein extracts (DWES, SES, and AES) at different ionic strenght under A: non-reducing; and B: reducing conditions. Molecular sizes of the protein standards range from 14.4 and 116 kDa. Left lane represents standard weight proteins, lane 1 (DWES at 0 M NaCl), lane 2 (DWES at 0.5 M NaCl), lane 3 (DWES at 1 M NaCl), lane 4 (SES at 0 M NaCl), lane 5 (SES at 0.5 M NaCl), lane 6 (SES at 1 M NaCl), lane 7 (AES at 0 M NaCl), lane 8 (AES at 0.5 M NaCl), and lane 9 (AES at 1 M NaCl).
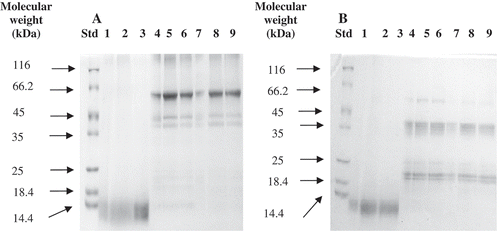
Under non-reducing conditions, and irrespective of ionic strength, the SES and the AES fractions showed major protein bands with molecular masses in the range of 64.8–60.2 kDa, two minor protein bands with molecular sizes of about 45.8 and 41.8 kDa, and a streak of high molecular mass species of about 120 kDa. The results on the electrophoretic patterns of the SES and AES fractions suggested that the alkaline extraction procedure (pH 8) affected the structural conformation of the proteins. This is confirmed by the SDS PAGE analysis of SE and AE which, under non-reducing conditions and in agreement with a previous report by Rezig et al.,[Citation7] revealed a protein with major bands in the range of 63.6–53.5 kDa and minor bands of higher and lower molecular weight components. Based on the results from color intensity, the bands of higher molecular weight were present at a lower proportion compared to those recorded for SE and AE. However, the bands of lower molecular weight were absent in the SDS PAGE of the SES and AES patterns at all ionic strength values.
Under reducing conditions, and according to the results from color intensity analysis, the major bands appeared to be reduced in two polypeptide classes, one migrating between 43.7 and 34.8 kDa and the other between 23.4 and 18.4 kDa. The electrophoretic profile observed under reducing and non-reducing conditions and irrespective of ionic strength corresponded to the typical pattern of the 11S globulin protein. Both polypeptides consisted of six subunits at around 50–60 kDa, one acidic at about 40 kDa and one basic at about 20 kDa, linked by disulfide bridges. A well-defined single band at 59.7 kDa was also detected after reduction, which could correspond to one of the major bands migrating in the same region in non-reducing conditions. After reduction, the higher molecular weight polypeptides (120 kDa) also disappeared. It is worth noting that the similarities observed in the electrophoretic patterns of SES and AES at all ionic strength values suggested the presence of the 11S globulin, the major protein fraction of pumpkin (Cucurbita sp.) seed proteins which are characterized by different structural conformations.
Effect of the Ionic Strength on the Tensioactive Properties of Protein Extracts
The variation of the surface pressure at air-water interface recorded for DWES, SES, and AES at different concentrations and with different ionic strength values is presented in . The surface pressure evolution function of protein concentration presented a sigmoidal shape, which was typical for biopolymers and surfactants.[Citation36,Citation37] At protein concentrations below 1.18 10–4 mg/mL and in the absence of sodium chloride (control), the DWES was noted to exhibit no surface activity. However, beyond this protein concentration, which translates the affinity of the protein at the air/water interface, surface pressure underwent a gradual increase to attain 37.4 mN/m. Such a behavior is consistent with the DLS data presented in . In fact, the DWES (control) showed a major population (89.3%) characterized by a low mean diameter of soluble protein aggregates (14.6 nm). The small size of proteins would favor their penetration and complete recovery at the air-water interface.[Citation38]
FIGURE 3 Evolution of surface pressure with protein concentration for A: DWES, B: SES, and C: AES at different ionic strength. Bars show standard deviation.
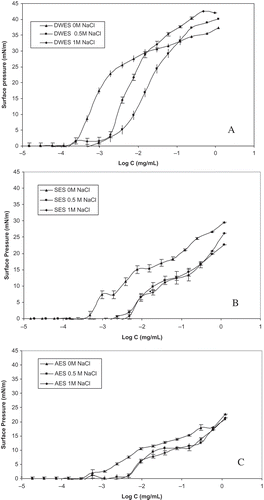
The increase in ionic strength did not increase the surface activity of DWES. At 0.5 M NaCl, and 1 M NaCl, no surface activity was observed below 1.18 10–4 mg/mL. A light increase in surface pressure was observed between 1.18 10–4 and 18.94 10–4 mg/mL. Beyond this value (18.94 10–4 mg/mL), surface pressure underwent a slow increase as compared to the DWES (control). This behavior could presumably be due to the higher size of soluble protein aggregates (43 and 135 nm for DWES at 0.5 M NaCl and 1 M NaCl, respectively). In fact, the higher size of soluble protein aggregates would not favor their adsorption at the air-water interface, thus inducing the increase of surface pressure.
Concerning the SES fraction, and in the absence of sodium chloride, no surface activity was observed below a protein concentration of 5.85 10–4 mg/mL. Surface pressure increased linearly afterward to achieve a maximum value of 29.59 mN/m. At 0.5 M NaCl and 1 M NaCl, SES displayed surface activity over a protein concentration of 23.43 10–4 and 46.87 10–4 mg/mL, respectively. Although the DLS data indicated the monomeric and dimeric states of the soluble protein aggregates for the SES, with a mean size of 5.9 and 5.6 nm at 0.5 M and 1 M NaCl, respectively, the proteins did not show good affinity at the air/water interface when compared to the DWES. This behavior could be attributed to the higher molecular weight of the proteins present in the SES fraction under non-reducing conditions ().
In the absence of sodium chloride and over a protein concentration of 2.92 10–4 mg/mL, the AES fraction showed lower surface pressure compared to SES. In fact, this behavior was not expected since the DLS results showed that the SES fraction displayed soluble protein aggregates whose size distribution was higher (51.8 nm) than that of AES (31.3 nm). The increase in the hydrodynamic diameter of the soluble protein aggregates would disadvantage their adsorption at the air-water interface, leading to the decrease of surface pressure.
At 0.5 and 1 M NaCl, the AES exhibited a surface activity beyond 46.87 10–4 mg/mL. Since the DLS results and electrophoretic patterns of SES and AES at 0.5 and 1 M NaCl showed similarities, the differences observed for the surface pressure of both extracts could be attributed to differences in the structural conformations of their protein components. Finally, and in terms of the efficiency of the proteins to cover the surface air/water, the DWES was noted to exhibit the best properties, followed by SES and AES at all ionic strength values.
Foaming Properties of Protein Extracts
In order to validate the effect of ionic strength on the surface activity properties of the pumpkin protein extracts observed by tensiometry, the foaming properties of DWES, SES, and AES were further investigated by the bubbling technique. In fact, the mechanisms giving rise to foam formation and foam stability in the presence of proteins and protein aggregates are not yet fully understood and well described in the literature. Moreover, the generation of protein aggregates by ionic strength and the relationship between those mechanisms and the shape, size, or proportion of aggregates still remain poorly investigated.
In the absence of sodium chloride and at 0.5 M NaCl, the DWES exhibited statistically identical sparging times (p < 0.05) of about 73.6 and 71.3 s, respectively. When ionic strength increased to 1 M NaCl, the sparging time increased to 90.6 s. No significant differences were observed for the sparging time displayed by SES and AES at all ionic strength conditions, with values being identical to those previously described for DWES at low salt concentrations (data not shown). These results showed that at all ionic strength, the pumpkin protein extracts exhibited poor foam ability, defined as the ability of the proteins to lower the surface tension in a short time when a new surface is created. Half of the gas injected in the liquid was lost and not retained in the foam. The evolution of the foam volume over time for all the protein extracts and at different ionic strength correlated to the images recorded during foam formation and stability, showing that foam destabilization started before the end of foam formation. Moreover, and in the absence of sodium chloride (control), the DWES was noted to exhibit the most important half-life time of about 0.39 h (data not shown). Such value was too short when compared to those displayed by rice bran protein concentrates of Basmati 370, Basmati 386, and HBC 19 whose half-life time values in alkaline conditions (pH 9) were 1.33, 2.5, and 3.67 h, respectively.[Citation39] These results showed that the measurements of static surface tension were not relevant for explaining or predicting protein solution foam ability. It would, therefore, be more adequate to measure the effective in situ surface tension once the bubbles are in contact with the already adsorbed protein.
Wani et al.[Citation40] reported on the good foam ability and foaming stability of albumin, globulin, glutelin, and prolamin from two cultivars (Mateera and Sugar Baby) of watermelon (Citrullus lanatus) belonging to the same botanical family (Cucurbitaceae). Foam stability, measured as the decrease in foam volume over time, was highest for the albumin fraction of both cultivars, followed by the globulin, prolamin, and glutelin fractions. The differences in foam stability were ascribed to differences in the protein structure of the two cultivars. In their work on watermelon (Citrullus vulgaris) defatted flour and protein isolate, Jyothi Laksmi and Kaul[Citation19] reported on a foam capacity of 68 and 87%, respectively, which was defined as the percentage increase in foam volume.[Citation2] Such values were considerably higher than those observed in watermelon (Citrullus vulgaris) seed flour (18.1%) and in pumpkin (Cucurbita pepo) seed flour (18.2%).[Citation2] In term of foam stability, the Citrullus vulgaris protein isolate, with a comparatively higher concentration of protein, was better than defatted flour, for it showed a three times lower decrease in foam volume than defatted flour. Mariod et al.[Citation41] reported that in alkaline conditions (pH 9), kenaf (Hibiscus cannabinus L.) protein concentrates from QP3 variety exhibited a foam capacity of 119%. The increase in ionic strength enhanced foam capacity (106, 109, and 124% at 0.5, 1, and 1.5% (w/w) sodium chloride concentrations, respectively).
In term of foam stability, the QP3 protein concentrate showed a half-life time of 40 min, which was considerably higher than that of DWES (0.39 h). The increase in ionic strength from 0.5 to 1% sodium chloride concentration led to a decrease in the half-life time of the QP3 protein concentrate. At 1.5%, the half-life time was higher, reaching 97.7 min. Foam capacity requires the rapid adsorption of proteins at an air-water interface during whipping or bubbling to undergo a rapid conformational change and rearrangement at the interface. Conversely, foam stability requires a thick, elastic, cohesive, continuous, and air permeable protein film around each gas bubble.[Citation42] The foam collapse observed after foam formation at all ionic strength suggested that the pumpkin seed protein extracts needed modification to enhance their foaming stability and to serve as better functional ingredients in food application.
Emulsifying Properties of Pumpkin Seed Extracts and Stability of Emulsions
The emulsifying properties of the protein extracts were characterized by determining the size of emulsion droplets under well-defined conditions. The effects of ionic strength on the oil droplet size of emulsions stabilized by DWES, SES, and AES are displayed in . The findings revealed that the DWES fraction had the lowest emulsion oil droplet size (d3,2 values) at all ionic strength conditions. This result could be supported by the fact that the DWES showed the highest surface pressure when compared to the other protein fractions (). This protein fraction showed an emulsion oil droplet size that increased from 0 M to 0.5 M NaCl and diminished afterward as the ionic strength of the solution increased. This could be attributed to the presence of a fraction of large protein aggregates for this salt content (). The SES and AES emulsions presented larger size droplets and higher interfacial protein concentrations. As the proteins in those two extracts were rather in monomeric or dimeric forms, the observed results could presumably be related to coalescence mechanisms during the emulsifying process. As for foam, the emulsion droplets produced during the process were presumably not sufficiently covered by proteins to be stable. They, therefore, fused to concentrate protein at the interface, producing large droplets.
TABLE 2 Evolution of mean diameters and surface coverage of emulsions stabilized by pumpkin seed extract at A: zero time (fresh emulsions); and B: after three day storagea
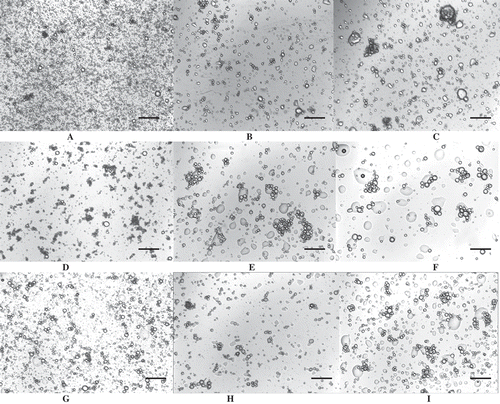
In terms of emulsion stability, which indicates the ability of an emulsion to resist changes in physicochemical properties over time,[Citation43] emulsifying stability was measured in kinetic modes, using volume mean droplets size d4,3 as an indicator of the long-term stability of emulsion and optical microscopic observation as a means to characterize emulsion structure. and show the effect of ionic strength on emulsion stability and the features of diluted emulsions over a period of 72 h storage, respectively. The results showed that all emulsions were not stable, which was evidenced by the increase in oil droplet size at all ionic strength conditions. This increase in size was not always apparent on d43 due to the loss of the larger droplets during granulometric measurement. In fact, a decrease in d32 was observed in some cases during emulsion storage, which was not expected since only energy intake is able to create a new interface. The observation of microscopic slides revealed the better stability of DWES emulsions especially without salt. In this case, emulsion remained fine and dispersed. With higher salt contents, DWES emulsions showed flocculation but low levels of coalescence. Conversely, the SES and AES emulsions were unstable regardless of salt content, with the presence of flocculated and large coalesced droplets. In both cases, the loss of emulsion stability could be attributed to the lack of electrostatic repulsive interactions among particles and disruption of the cohesiveness of the interfacial protein films, which promoted flocculation and higher rates of oil coalescence.
FIGURE 4 Light microscopy images of pumpkin seed extract emulsions after 72 h storage. A: DWES emulsion (0 M NaCl); B: SES emulsion (0 M NaCl); C: AES emulsion (0 M NaCl); D: DWES emulsion (0.5 M NaCl); E: SES emulsion (0.5 M NaCl); F: AES emulsion (0.5 M NaCl); G: DWES emulsion (1 M NaCl); H: SES emulsion (1 M NaCl); I: AES emulsion (1 M NaCl). The black bar represents a size of 150 µm.
CONCLUSION
The present study aimed to investigate the interfacial tension of pumpkin seed (Cucurbita maxima) protein fractions belonging to the Cucurbitaceae family. It also sought to evaluate the effect of ionic strength on the functional properties of the title protein fractions and their potential application as food ingredients in the food industry.
The results showed the intermediate solubility rates of pumpkin (Cucurbita maxima) seed protein fractions and their strong dependence on ionic strength under alkaline conditions. The solubility of DWE was noted to decrease with increase of ionic strength. The DWES also exhibited higher surface pressure at all ionic strength as compared to SES and AES. This behavior could be attributed to lower molecular weight of its protein components, which allowed for the adsorption of more proteins at the air-water interface and the increase of molecular flexibility. Concerning functional properties, all protein extracts showed poor foaming properties irrespective of ionic strength. The DWES exhibited better emulsifying properties and higher stability, which could be ascribed to its higher interfacial properties. Low ionic strength favored emulsion stability due to the electrostatic repulsion between oil droplets. Overall, the results indicated that the pumpkin seed protein extracts need a number of modifications, including partial hydrolysis, to enhance their functional properties and potentially serve as useful ingredients for application as supplements in various food products and formulations in the food industry.
ACKNOWLEDGMENT
The authors would like to express their sincere gratitude to Mr. Anouar Smaoui from the English Language Unit at the Faculty of Science of Sfax, Tunisia for his valuable proofreading and language polishing services.
Related Research Data
REFERENCES
- Al-Khalifa, A.S. Physicochemical Characteristics, Fatty Acid Composition, and Lipoxygenase Activity of Crude Pumpkin and Melon Seed Oils. Journal of Agricultural and Food Chemistry 1996, 44, 964–966.
- El-Adawy, T.A.; Taha, K.M. Characteristics and Composition of Different Seed Oils and Flours. Food Chemistry 2001, 74, 47–54.
- Nyam, K.L.; Tan, C.P.; Lai, O.M.; Long, K.; Che Man, Y.B. Physicochemical Properties and Bioactive Compounds of Selected Seed Oils. Journal of Food Science and Technology 2009, 42, 1396–1403.
- Rezig, L.; Chouaibi, M.; Msaada, K.; Hamdi, S.Chemical Composition and Profile Characterisation of Pumpkin (Cucurbita Maxima) Seed Oil. Industrial Crops and Products 2012, 37, 82–87.
- Murković, M.; Hillebrand, A.; Winkler, H.; Pfannhauser, W. Variability of Vitamin E Content in Pumpkin Seeds (Cucurbitapepo L.). Z LebensmUntersForsch 1996, 202, 275–278.
- National Poll on the Consumption. The Expenditure and Families’ Living Mode. Nutrition Theme; National Institute of Statistics: Tunis, Tunisia, 2005.
- Rezig, L.; Chibani, F.; Chouaibi, M.; Dalgalarrondo, M.; Hessini, K.; Guéguen, J.; Hamdi, S. Pumpkin (Cucurbita maxima) Seed Proteins: Sequential Extraction Processing and Fraction Characterization. Journal of Agricultural and Food Chemistry 2013, 61, 7715–7721.
- Adebiyi, A.P.; Adebiyi, A.O.; Ogawa, T.; Muramoto, K. Preparation and Characterization of High-Quality Rice Bran Proteins. Journal of the Science of Food and Agriculture 2007, 87, 1219–1227.
- Ragab, D.M.; Babiker, E.E.; Eltinay, A.H. Fractionation, Solubility and Functional Properties of Cowpea (Vigna Unguiculata) Proteins As Affected by pH and/or Salt Concentration. Food Chemistry 2004, 84, 207–212.
- Kinsella, J.E. Functional Properties of Soy Proteins. Journal of the American Oil Chemist’s Society 1979, 56, 242–258.
- Wani, I.A.; Sogi, D.S.; Gill, B.S. Physico-Chemical and Functional Properties of Native and Hydrolysed Protein Isolates from Indian Black Gram (Phaseolus mungo L.) Cultivars. Food Science and Technology 2015, 62(2), 848–854.
- Achouri, A.; Nail, V.; Boye, J.I. Sesame Protein Isolate: Fractionation, Secondary Structure, and Functional Properties. Food Research International 2012, 46(1), 360–369.
- Adebiyi, P.A.; Aluko, R.E. Functional Properties of Protein Fractions Obtained from Commercial Yellow Field Pea (Pisum sativum L.) Seed Protein Isolate. Food Chemistry 2011, 128, 902–908.
- Joshi, M.; Adhikari, B.; Aldred, P.;0 Panozzo, J.F.; Kasapis, S.; Barrow, C.J. Interfacial and Emulsifying Properties of Lentil Protein Isolate. Food Chemistry 2012, 134(3), 1343–1353.
- Mundi, S.; Aluko, R.E. Physicochemical and Functional Properties of Kidney Bean Albumin and Globulin Protein Fractions. Food Research International 2012, 48, 299–306.
- Deng, Q.; Wang, L.; Wei, F.; Xie, B.; Huang, F., Huang, W.; Shi, J.; Huang, Q.; Tian, B.; Xue, S. Functional Properties of Protein Isolates, Globulin, and Albumin Extracted From Ginkgo Biloba Seeds. Food Chemistry 2011, 124(4), 1458–1465.
- Aluko, R.E.; Mofolasayo, O.A.; Watts, B.M. Emulsifiying and Foaming Properties of Commercial Yellow Pea (Pisum Sativum L.) Seed Flours. Journal of Agricultural and Food Chemistry 2009, 57, 9793–9800.
- Rangel, A.; Domont, G.B.; Pedrosa, C.; Ferreira, S.T. Functional Properties of Purified Vicillins from Cowpea Protein Isolate. Journal of Agricultural and Food Chemistry 2003, 51, 5792–5797.
- Jyothi Lakshmi, A.; Kaul, P. Nutritional Potential, Bioaccessibility of Minerals and Functionality of Watermelon (Citrullus Vulgaris) Seeds. Journal of Food Science and Technology 2011, 44, 1821–1826.
- Horax, R.; Hettiarachchy, N.; Kannan, A.; Chen, P. Protein Extraction Optimisation, Characterisation, and Functionalities of Protein Isolate from Bitter Melon (Momordica Charantia) Seed. Food Chemistry 2011, 124, 545–550.
- Wani, A.A.; Sogi, D.S.; Singh, P.; Shivhare, U.S. Characterization and Functional Properties of Watermelon (Citrullus lanatus) Seed Protein Isolates and Salt Assisted Protein Concentrates. Food Science Biotechnology 2011, 20(4), 877–887.
- Horax, H.; Hettiarachchy, N.; Over, K.; Chen, P.; Gbur, E. Extraction, Fractionation, and Characterization of Bitter Melon Seed Proteins. Journal of Agricultural and Food Chemistry 2010, 58, 1892–1897.
- Smith, P.K.; Krohn, R.I.; Hermanson, R.I.; Mallia, A.K.; Gartner, F.H.; Provenzano, M.D.; Fujimoto, E.K.; Goeke, N.M.; Olson, B.J.; Kelnk, D.C. Measurement of Protein Using Bicinchoninic Acid. Analytical Biochemistry 1985, 150, 75–85.
- Laemmli, U.K. Cleavage of Structural Proteins during the Assembly of the Head of the Bacteriophage T4. Nature 1970, 227, 680–686.
- Martinet, V.; Saulnier, P.; Beaumal, V.; Courthaudon, J.L; Anton, M. Surface Properties of Hen Egg Yolk Low-Density Lipoproteins Spread at the Air-Water Interface. Colloids and Surfaces B 2003, 31, 185–194.
- Rivas, H.J.; Sherman, P. Soy and Meat Proteins As Emulsion Stabilizers. 4. The stability and Interfacial Rheology of O/W Emulsions Stabilised by Soy and Meat Protein Fractions. Colloids and Surfaces A 1984, 11, 155–171.
- Statsoft. STATISTICA for Windows (Computer Program Electronic Manuel). Statsoft Inc., Tulsa, OK, 1998.
- Kinsela, J.E. Functional Properties of Proteins: Possible Relationships Between Structure and Function in Foams. Food Chemistry 1981, 7, 273–288.
- Shand, P.J.; Ya, H.; Pietrasik, Z.; Wanasundara, P.K.J.P.D. Physicochemical and Textural Properties of Heat-Induced Pea Protein Isolate Gels. Food Chemistry 2007, 102, 1119–1130.
- Lawal, O.S.; Adebowale, K.O.; Ogunsanwo, B.M.; Sosanwo, O.A.; Bankole, S.A. On the Functional Properties of Globulin and Albumin Protein Fractions and Flours of African Locut Bean (Parkia biglobossa). Food Chemistry 2005, 92, 681–691.
- Ma, C.Y.; Harwalkar, V.R. Chemical Characterization and Functionality Assessment of Oat Proteins. Journal of Agricultural and Food Chemistry 1984, 32, 144–149.
- Gonzalez-Perez, S.; Vereijiken, J.M.; Van Koningsveld, G.A.; Gruppen, H.; Voragen, A.G.J. Physicochemical Properties of 2S Albumins and the Corresponding Protein Isolate from Sunflower (Helianthus Annus). Journal of Food Science 2005, 70, C98–C100.
- Padilla, F.C.; Alvarez, M.T.; Alfaro, M.J. Functional Properties of Barinas Nut Flour (Caryodendron Orinocense Karst., Euphorbiaceae) Compared to Those of Soybean. Food Chemistry 1996, 57, 191–196.
- Arogundade, L.A.; Tshay, M.; Shumey, D.; Manazie, S. Effect of Ionic Strength and/or pH on Extractability and Physic-Functional Characterization of Broad Bean (Vicia Faba L.) Protein Concentrate. Food Hydrocolloids 2006, 20(8), 1124–1134.
- Fang, E.F.; Wong, J.H.; Lin, P.; Ng, T.B. Biochemical Characterization of the RNA-Hydrolytic Activity of a Pumpkin 2S Albumin. FEBS Letters 2010, 584, 4089–4096.
- Tomberg, E. The Interfacial Behaviour of Three Food Proteins Studied by the Drop Volume Technique. Journal of the Science of Food and Agriculture 1978, 29, 762–776.
- Graham, D.E.; Phillips, M.C. Proteins at Liquid Interfaces II. Adsorption Isotherms. Journal of Colloid and Interface Science 1979, 70, 415–426.
- Martίnez, K.D.; Sánchez, C.C.; RodrίguezPatino, J.M.; Pilosof, A.M.R. Interfacial and Foaming Properties of Soy Protein and Their Hydrolysates. Food Hydrocolloids 2009, 23(8), 2149–2157.
- Chandi, G.K.; Sogi, D.S. Functional Properties of Rice Bran Protein Concentrates. Journal of Food Engineering 2007, 79, 592–597.
- Wani, A.A.; Sogi, D.S.; Singh, P.; Wani, I.A. Characterisation and Functional Properties of Watermelon (Citrullus Lanatus) Seed Proteins. Journal of the Science of Food and Agriculture 2011, 91, 113–121.
- Mariod, A.A.; Fathy, S.F.; Ismail, M. Preparation and Characterization of Protein Concentrates from Defatted Kenaf Seed. Food Chemistry 2010, 123, 747–752.
- Were, L.; Hettiarachchy, N.S.; Kalapathy, U. Modified Soy Proteins with Improved Foaming and Water Hydration Properties. Journal of Food Science 1997, 62, 821–824.
- McClements, D.J. Critical Review of Techniques and Methodologies for Characterization of Emulsion Stability. Critical Reviews in Food Science and Nutrition 2007, 47, 611–649.