
Abstract
Rheological behavior and microstructural characteristics of composite dough with wheat and mesquite flours (from Prosopis alba) were analyzed by response surface methodology. A central composite design was applied varying proportions of water (50 to 80 g each 100 g wheat flour) and mesquite flour (0 to 70 each 100 g wheat flour). Texture profile analysis showed that increasing the amount of mesquite flour and decreasing the amount of water led to less cohesive and more resilient doughs. Stress relaxation curves were fitted with a Maxwell model and relaxation times were obtained. These parameters resulted higher for those formulations low in mesquite content and high water levels. Composite dough showed a typical viscoelastic behavior with higher elastic moduli (G’) when mesquite flour ratio in the mixture was increased. 1H-RMN T2 relaxation assays revealed higher mobility in samples with high amounts of water and minimum level of mesquite. A farinograph was adequate to obtain optimum water amounts and showed that addition of mesquite led to less stable dough respect to control wheat dough. By using confocal laser scanning microscopy with fluorescent probes rhodamine B and fluoresceine isothiocyanate, a poor gluten network development or protein aggregation was observed when water contents were far from optimum.
INTRODUCTION
Because of their potential ability to compensate the amino acids deficiency of cereal proteins, leguminous flours are an interesting option to enrich wheat bread products. Besides, antioxidant activity has been reported in composite dough from wheat and certain leguminous due to radical scavenging capacity of phenolic compounds.[Citation1,Citation2] Among leguminous, the tree known in Argentina and other countries as “algarrobo” (mesquite) belongs to the genus Prosopis, that includes more than 30 species widespread in South America. These species have relevant function in those semi-arid regions where other crops have survival difficulties due to climate conditions and adverse soil composition. In these semi-arid regions, mesquite represents a natural resource that is profited by the local population as food (mesquite pods) or for other objectives (wood production and vegetable coal).[Citation3] The ripe fruit of mesquite tree is called “algarroba”; it is a yellowish to black pod (depending on the species) composed by exocarp, mesocarp (pulp), both representing 55–58% of the total fruit weight, endocarp (30–35% total fruit weight) and seeds (approximately 12–14% total fruit weight).[Citation4,Citation5] Grados and Cruz[Citation4] have reported the following composition for the fruit pulp from P. pallida: 46% sucrose, 32% total dietary fiber, 8% protein, 2% reducing sugars, 0.8% pectins, 0.8% fats, and 0.8% polyphenols. Endocarp from P. pallida represents 35% of the fruit weight and it is mainly composed by insoluble fiber (more than 70% of total fiber); it also contains 4% proteins, 1.6% soluble sugars, and 1.3% lipids. In the seed, three fractions can be distinguished: peel, where the tannin content is relevant, endosperm, mainly composed by a galactomannan, and germ rich in protein (65%) and oil (7.2%).
The dehydration and grinding of the whole pods lead to a flour type product called “mesquite flour.” Mesquite flour is a food ingredient that provides energy due to its high sugar content; it also has proteins and lipids of high nutritional quality. It provides calcium and iron among other minerals. The amino acidic composition of mesquite proteins reveals the presence of important amounts of essential amino acids, except (upon the species) of methionine, isoleucine, and threonine.[Citation6,Citation7] The relatively high content of lysine makes mesquite flour a potential good complement for other proteins with deficiency in this amino acid, like cereal proteins.[Citation7] In spite of the potential high nutritional benefits of this food ingredient, the consumption of mesquite products is mainly local.
Dough formulation with non-wheat flours implies technological challenges to obtain acceptable products. Unique viscoelastic properties of wheat dough are due to the gluten network formed upon hydration of gliadins and glutenins and the application of mechanical energy during kneading. The incorporation of other ingredients, such as mesquite flour, may interfere with the formation of this network, leading to a structure with a different rheological behavior that can affect final product quality. For example, addition of legume proteins from yellow pea, chickpea, or soybean, affected farinographic properties, bread volume, and crumb quality as reported by Fenn et al.[Citation8] Mohammed et al.[Citation9] have found that replacement of wheat flour with 20 or 30% of chickpea flour (Cicer arietinum L, a leguminous) produced a “sticky” dough surface. The presence of chickpea flour in dough also affected bread quality. Regarding soy (Glycine max) employment, Roccia et al.[Citation10] demonstrated that substitution of wheat protein by soy protein isolate negatively affected the rheological properties due to network weakening. It also diminished availability of water to the build-up of the gluten network. In the same trend, it has been reported that mixing mesquite and wheat flours leads to less resistant dough with a lesser bread volume.[Citation4]
Optimal water quantity is a critical point to be considered when formulating dough with mixtures of wheat and other type of flour. In the case of wheat-lupine (Lupinus albus ssp Graecus) dough, water absorption was increased. Though the water level positively correlated with loaf volume, high water levels could not be considered optimal because dough workability was impaired.[Citation11] Taking into account the nutritional benefits of leguminous-cereal mixtures and the availability and economical interest of the leguminous Prosopis (mesquite), the objectives of the present study have been (1) to study the rheological behavior of composite dough from wheat and mesquite flours, through empirical (farinograph, texture profile analysis [TPA]) and fundamental (oscillatory) assays and (2) to relate the microstructure of mesquite-wheat mixtures with their rheological behavior.
MATERIALS AND METHODS
Materials
Commercial wheat flour (type 000, Molino Campodonico Ltda., La Plata, Argentina)[Citation12] was used. Mesquite flour (from White mesquite species) was provided by local farmers (BAGUALA, Santiago del Estero, Argentina). Margarine (Danica, Argentina) and salt (NaCl, Celusal, Argentina) were obtained from the local market.
Flours Composition
Moisture was determined according to AACC method 44-19.[Citation13] The total dietary fiber was evaluated by enzymatic method AACC 32-07,[Citation13] total protein content by Kjeldahl method AACC 46-12[Citation13] (with slight modifications: CuSO4 as catalyst and Methyl red-bromocresol green as indicator), lipids were extracted with ether by using a Soxhlet device and ash value was obtained by calcination at 550ºC AACC 8-1.[Citation13]
Farinograms of Mixtures Mesquite Flour—Wheat Flour
Farinographic assays were performed in a 300 g—Brabender farinograph (Duigsburg, Germany), using the standard protocol AACC 54-21.[Citation13] Wheat flour and mixtures with 15, 25, and 35% replacement by mesquite flour (17.65, 33.33, and 53.85 g mesquite flour/100 g wheat flour, respectively) were used. As the obtained results are intended for further breadmaking procedures, in the present work NaCl (2% flour basis) was added to samples.
Experimental Design
A factorial design with three replicates for the central point (central composite design [CCD]) with two factors (mesquite flour and water) was applied to mixtures of wheat and mesquite flours. Levels of mesquite flour ranging from 10.25 to 70 g/100 g wheat flour and water between 54.39 to 80 g/100 g wheat flour were analyzed (). Limits for these factors were fixed according to preliminary assays. Response surface methodology (RSM)[Citation14,Citation15] was applied to obtain second order equations (Eq. 1) for the measured parameters as function of the amounts (based on 100 g wheat flour) of mesquite flour (X1) and water (X2). Statgraphics Centurion XV version 2.15.06 (USA) software was used.
TABLE 1 Amounts of mesquite and water (on 100 g wheat flour basis) according to a central composite design. Coded and uncoded values are shown
where, Y is the dough response and β0, β1, β2, β11, β22, β12 are regression coefficients.
Only significant coefficients were used in the final expression for each response surface. Models fitness was checked by the variance analysis (F test) and R2 values. Control dough (without mesquite, not belonging to the CCD) was also analyzed.
Dough Preparation
A basic formulation of bread was used where wheat flour was partially replaced by mesquite flour up to 41.2% (w/w). Amounts were varied according to CCD. In all cases, 4 g margarine and 2 g NaCl salt were added each 100 g of flour blend. Wheat flour dough (without mesquite flour) was used as control sample. Dry ingredients (flours, salt) were previously mixed and the melted margarine was incorporated in the bowl of a Kenwood Major 1200W professional kneader (Kenwood, Italy). The amount of water indicated by the experimental design was added in each case. Each dough total weight was approximately 600 g. Ingredients were kneaded for 23 min at speed of 90 rpm. According to farinographic results, such time proved to be enough for dough development on every case, even with high amounts of mesquite flour. After kneading, dough was left to rest for 10 min covered with a plastic film. Later, it was manually laminated up to 1 cm height and it was left to rest for another 10 min. No yeast was added to these mixtures in order to avoid fermentation changes that could influence on dough rheological measurements. For control dough (wheat flour dough), farinographic water absorption (59.1 mL) and optimal development time (18.0 min) were applied.
Rheological Characterization of Dough
Instrumental TPA
TPA measurements were performed on dough discs (3 cm diameter, 1 cm height). Two consecutive compression cycles were executed up to a 40% of the initial height (compression speed 0.5 mm/s), with a TA-XT2i texturometer (Stable Microsystems, England). From the texture profiles, the following parameters were analyzed: hardness (maximum force at the first cycle), springiness or elasticity (ratio between the distance corresponding to the product height on the second cycle and the original compression distance), resilience (area during the withdrawal of the first compression, divided by the area of the first compression), and cohesiveness (area of the second peak respect to the area of the first peak).
Stress relaxation assays
Relaxations assays were performed by applying compression on dough discs up to 40% in a single pulse of 20 min. A texture analyzer (TA.XT2i, Stable Micro Systems, Surrey, U.K.) with Texture Expert for Windows (v.1.2) software was used. Dough was allowed to rest for 10 min at 20ºC before testing. Three replicates per sample were tested. The decay curves (stress as a function of time) were obtained and fitted to a Maxwell model with two elements in parallel with a spring[Citation16] (Eq. 2). Coefficients were obtained in order to characterize the system behavior.
where, σ = stress (Pa), A1,2 = pre-exponential factors (Pa), t = time (min), λ1,2 = relaxation times (min), and σ0 = equilibrium stress (Pa).
Viscoelasticity through dynamic oscillatory assays
A controlled stress rheometer RS600 (Haake, Germany) with rough surface parallel plates (35 mm diameter) was used. The gap between plates was 1.5 mm. Strain sweeps were performed to obtain the linear viscoelastic range. Then frequency sweeps were obtained (0.01 to 100 Hz) at temperature of 25°C. Measurements of G’, G’’, and G* were obtained at frequency of 1 Hz.
1H-RMN Relaxation Assays (T2)
Molecular mobilities of different composite doughs of the experimental design were analyzed by relaxation assays with RMN Bruker Minispec equipment (Bruker, USA). A portion of fresh dough was put into the glass tube (10 mm diameter) up to 3 cm height, the tube was then closed to avoid dehydration. Measurements were performed at room temperature applying the Carr Purcell Meiboon Gill (CPMG) pulse sequence (interpulse spacing = 200 ms). Signal decay was fitted with an exponential Eq. (3) of one term:
where, I: intensity of the proton signal at time t; t: time; T2: relaxation constant; A: maximum signal intensity.
Confocal Scanning Laser Microscopy (CSLM) of Dough
A portion of dough corresponding to each point of the experimental design described above was spread on a glass slide and imbibed with dye solution, which consists of a mixture of rhodamine B (0.001%) and fluoresceine isothiocyanate (FITC; 0.01%) in distilled water. The sample was left to rest for 1 h within a closed dark recipient, then the specimen was washed with distilled water and covered with a glass cover slip. Dough samples did not show autofluorescence.
An inverted microscope equipped with Ar and HeNe laser was used (LEICA TCS SP5, Mannheim, Germany). The excitation wavelengths were 488 nm (FITC) and 568 nm (rhodamine B) and the emission wavelengths were 518 nm (FITC) and 625 nm (rhodamine B). Images were acquired using the following objectives: HC PL FLUOTAR 10.0X0.30; HCX PL APO CS 20.0X0.70 (water immersion objective) and HC X PL APO CS 63.0X1.4 (oil immersion objective). At least five micrographs from each sample were taken. Softwares LAS AF version 2.2.1. build 4842 and Image J 1.43 u were employed in the image analysis. The fractal dimension (D) of each sample was also calculated on Image J.
Statistical Analysis
RSM was applied as above described. ANOVA was performed to determine significant differences among samples when necessary. Regressions were made with software OriginPro 8 v8.0724 (USA).
RESULTS AND DISCUSSION
Mesquite and Wheat Flour Composition
Wheat flour contained (mean ± SD): protein 12.11 ± 0.00 (% w/w), lipids 1.32 ± 0.04 (% w/w), moisture 13.74 ± 0.11 (% w/w), ash 0.70 ± 0.01 (% w/w). The composition of mesquite flour was (mean ± SD): protein 11.13 ± 0.04 (%w/w), lipid 1.13 ± 0.04 (%w/w), total dietary fiber 26.77 ± 0.95 (%w/w), moisture 6.01 ± 0.03 (%w/w), ash 3.59 ± 0.04 (%w/w), carbohydrates different from fiber (calculated by difference): 52.21%.
Farinographic Profiles
Typical farinograms obtained for wheat flour and mesquite-wheat flour mixtures with different replacement degree are shown in . Though a marked maximum is observed when mesquite flour is added, consistency increases more gradually than in wheat flour samples. This behavior could be compared to the behavior of wheat flour with inulin reported by Salinas et al.[Citation17] These authors used oligofructose-enriched inulin to supplement wheat dough up to a level of 12% (flour basis). The farinographic profile modifications reported by these authors were similar to the ones observed in the current work, suggesting presence of fiber and its particular water retention capacity could be responsible for this behavior.
FIGURE 1 Typical farinograms of mixtures wheat flour-mesquite flour with the following replacements: A: 0% (control); B: 15%; C: 25%; and D: 35%.
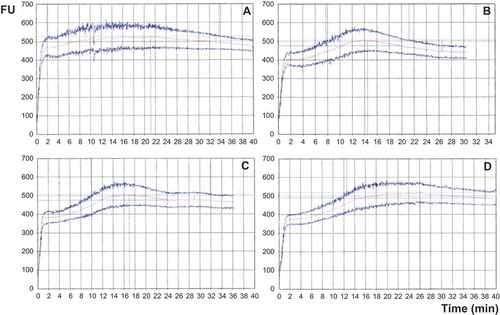
Farinographic parameters for wheat flour and mixtures with 15–35% mesquite flour are shown in . Farinographic water absorption decreased when higher amounts of mesquite flour were incorporated. This trend is opposite to those reported by other authors when replacing wheat flour by certain leguminous like soy, lupin, faba bean, and chickpea.[Citation18–Citation22] The mixtures analyzed by these authors contained higher protein content than wheat flour, and this fact is pointed out as the reason for the increased farinographic water absorption. In this study, substitution of wheat by mesquite flour did not lead to substantial changes in total protein level because both flours have similar protein contents (12.11% wheat flour and 11.13% mesquite flour); however, gluten quantity was diminished, so a decrease in the amount of farinographic water was observed. This decrease, also reported by Salinas et al.[Citation17] when adding inulin to dough, could be related to the different water absorption capacity of mesquite flour components, mainly fiber, compared to wheat proteins and starch.
TABLE 2 Farinographic parameters for mesquite-wheat flour mixtures
No significant differences in development time were observed. Stability was significantly decreased with 15 and 25% levels of mesquite flour. This trend would indicate a weakening effect on gluten network. However, when proportion of mesquite flour increases up to 35% and water is adjusted to an optimum value, stability also increases, approaching it to control dough.
Farinographic stability is an indicator of dough strength; higher values correspond to stronger doughs. The results obtained in the present work indicate that there is a dilution effect on gluten proteins that leads to weaker dough when 15% of replacement is performed. However, it seems that this negative effect is partially compensated when higher levels of mesquite flour are added and water is adjusted according to farinograph results. In accordance with these results, degree of softening shows its maximum value at 15% mesquite flour. At higher levels of replacement, a strengthening effect is observed probably due to the mesquite fiber and proteins. Particularly, Prosopis seeds contain a galactomannan (mesquite gum)[Citation23] that could help to reinforce the protein network and thus, contribute to the formation of a lesser soft and more stable dough.
Other authors have reported negative effects on stability when wheat flour is partially replaced with leguminous flours. Ribotta et al.[Citation20] have studied the effect of active enzyme or heat treated soy flours on wheat dough between 5 to 12% substitution, observing higher stabilities when substitution was performed. For wheat-lupine mixtures with substitution levels from 5 to 15%, lower stabilities were obtained, particularly at higher levels (15% lupine).[Citation8] In our case, the effect found at levels higher than 15% would reflect a partial compensation between gluten dilution and strengthening.
Rheological Characterization of Mixtures Applying RSM
shows RSM for different rheological attributes. Resilience and cohesiveness from TPA were fitted to a second order model. Determination coefficients for both models were 0.94 and 0.74, respectively. No acceptable model could be obtained for hardness and elasticity because of significant lack of fit (p < 0.05). Polynomial factors for resilience and cohesiveness are shown in . Resilience is related to the ability of a sample to instantly recover after deformation. Increasing the amount of mesquite flour in formulations led to doughs with increased resilience, as it is indicated by the positive coefficient in the polynomial model (β1). Increasing the amount of water caused opposite behavior (negative coefficient β2), but in different degree for doughs with high or low mesquite content. In formulations with higher levels of mesquite flour, changes on the amount of water led to drastic variations in the response.
TABLE 3 Regression coefficients of polynomial models for textural attributes (resilience, cohesiveness), elastic modulus (G’), complex modulus (G*), relaxation time T2 (1H-RMN assays) and stress relaxation time 1 (uncoded variables)
FIGURE 2 Response surfaces and contour graphs estimated for resilience (dimensionless), cohesiveness (dimensionless), and relaxation time λ1 (s) of dough (axes show decoded variables expressed as weight (g)/100 g wheat flour).
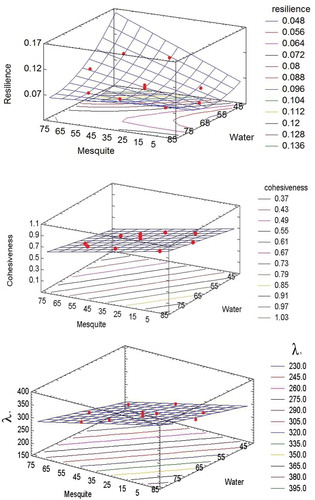
Cohesiveness is related to the ability of structural components to keep together and it is associated to the sample integrity. Variation in this attribute was less pronounced at low mesquite and high water levels where maximum cohesiveness was observed. When higher mesquite and lesser water levels were assayed, dough resulted less cohesive, probably due to the disruption effect of mesquite flour on gluten network; this is in agreement with the lesser stability found in farinographic assays (regarding control), therefore, the role of water on cohesiveness appears relevant. Taking into account that farinograms are obtained at optimal water absorption, the partial compensation observed between gluten dilution and strengthening could only be possible in presence of enough water. Surface response methodology evidences that under conditions of water deficiency, cohesiveness dramatically diminishes when mesquite flour increases.
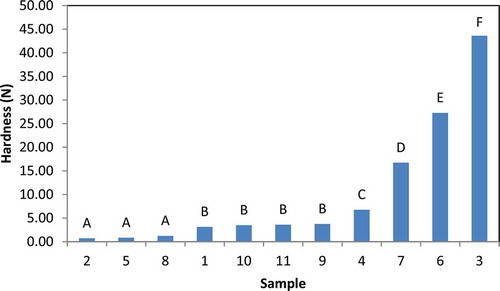
Since lack of fit was observed when modeling hardness values, ANOVA was performed to analyze differences among the experimental points of the design. Results are shown in . For those formulations with the highest levels of mesquite flour and water restriction (samples 3, 4, and 6), highest values of hardness were observed. Results from stress relaxation assays were modeled according to Eq. (2). Coefficient R2 resulted higher than 96% in all cases. Stress relaxation parameter λ1 ranged from 240 s to 372 s while λ2 varied from 6.2 to 8.4 s and σo (equilibrium stress) ranged from 91 to 7615 Pa for the different formulations. When applying RSM, σo exhibited lack of fit and λ2 had a poor adjustment (R2 = 47.60%). The stress relaxation time λ1 was adjusted with a linear model whose coefficients are shown in . A higher λ indicates slower decay during relaxation, which is typical of a viscoelastic matrix with a more solid like behavior;[Citation13] this fact could be related to a better structured matrix formation which is in accord with the trend observed for cohesiveness.
FIGURE 3 Hardness values (N), from TPA, for different samples according to . Different letters indicate significant differences between samples (p < 0.05).
Viscoelastic measurements within the linear viscoelastic range can give additional information about the rheological behavior of samples when no structural rupture is undergone. Composite dough exhibited a viscoelastic behavior in the frequency range assayed, being G’ higher than G’’ in all range (). There was a slight dependency with frequency for both moduli. These results indicate a prevalence of elastic forces above the viscous ones.
FIGURE 4 A: Typical mechanical spectra for two samples of the design (S1 and S4); B: Response surface and contour graph estimated for G* (Pa) of doughs (axes show decoded variables expressed as weight (g)/100 g wheat flour).
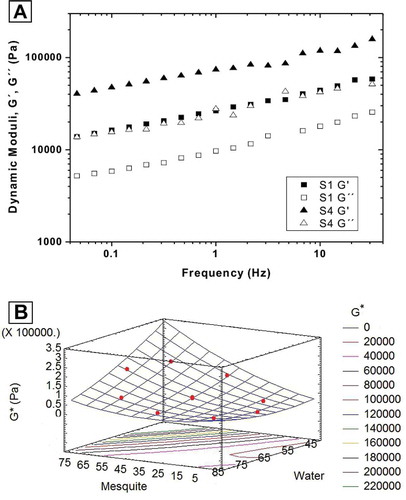
Regression coefficients for the polynomial expressions obtained for the elastic modulus (G’) and complex modulus (G*) measured at 1 Hz are shown in . Adjusted R2 values and the p-values for each coefficient (confidence level = 95%) are also shown. Viscous modulus G’’ ranged from 6350 Pa (for S2) to 64295 Pa (for S6) but modeling evidenced lack of fit (results not shown). As it can be observed from parameters in and response surface in , increasing the proportion of mesquite flour increased G′ and G* values (positive β1), while the opposite effect was observed by increasing the amount of water (negative β2). This trend was more pronounced in formulations with higher levels of mesquite flour. Despite the oscillatory dynamic tests were carried out in different conditions from TPA (without structural breakdown), trends found for dynamic moduli were in agreement with those of resilience.
Control dough of wheat flour (out of the experimental design) exhibited the following mean values (SD) for textural attributes: hardness 1.283 (±0.291); resilience, 0.066 (
0.004); cohesiveness, 0.790 (
0.006). According to values obtained for control dough, mixtures exhibiting low hardness and medium to high levels of cohesiveness and resilience should be chosen for breadmaking. Formulations assayed in the farinograph, with 15, 25, and 35% of wheat flour replacement by mesquite flour corresponded to 17.65, 33.33, and 53.85 g mesquite flour/100 g wheat flour, respectively. Given these values and farinographic water absorption, textural parameters values were calculated by applying each model. In sample with 15% replacement, resilience and cohesiveness values were 0.0572 and 0.7416, respectively; 25% replacement values were 0.0621 and 0.7073, respectively; and 35% replacement values were 0.0649 and 0.6678. These estimated values are relatively close to those from control dough.
Microstructural Analysis
Micrographs obtained by CLSM corresponding to each point of the experimental design are shown in . When gluten network is well developed it can be visualized as a greenish-yellow filamentous crosslinked structure.[Citation24] This color is the consequence of the combined effect of rhodamine B, which is specific for proteins, and FITC, which dyes both proteins and starch. In composite wheat-mesquite doughs, globular mesquite proteins can be well visualized as red round structures adjacent to gluten network. Selectivity of rhodhamine B in complex systems of protein/polysaccharide was previously reported by Tromp et al.,[Citation25] van de Velde et al.,[Citation26] and Kim.[Citation27] Starch granules can be distinguished as round green shapes acting as fillers within the matrix.[Citation28,Citation29]
FIGURE 5 CSLM micrographs for the different formulations of the experimental design () at 10x. Bar = 250 μm. W: water; WF: wheat flour; MF: mesquite flour.
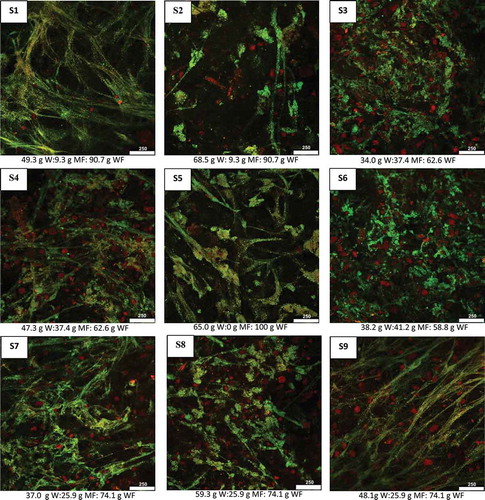
Three types of structures can be identified in : (1) filamentous structures with a certain degree of crosslinking (S1, S4, S9); (2) more or less aggregated structures with a poor network development (S3, S6, S7, S8); and (3) coarse networks with thick threads (S2, S5). For comparison with farinographic results at 25% wheat flour replacement, micrographs S7, S8, and S9 (corresponding to 25.9% replacement and different water amounts) can be used. S7 corresponds to 37 g water each 100 g wheat-mesquite mixture and S9 corresponds to 48 g water each 100 g wheat-mesquite mixture; both samples have water restriction when compared with farinographic water absorption for 25% replacement (54.1%, ). Moreover, S8 corresponds to 59 g water each 100 g mixture, resulting a water excess condition. S9, in spite of its water deficiency, showed a filamentous network, but samples S7 and S8 exhibited a more disrupted and aggregated aspect (absence of network), possibly indicating a poor network development in the first case and a too hydrated network in the second one (water excess). S1 and S4, like S9, exhibited a more filamentous network. Both S1 and S4 hold water contents (47.3 and 49.3 mL/100 g mixture, respectively) not so far from the optimum value, according to farinographic absorption trend. However, the higher amount of mesquite flour in S4 rendered a more disrupted and aggregated network than in S1. S3 and S6, like S7, had more restricted water content (below 40 mL/100 g mixture) and exhibited an aggregated structure.
Condition of water excess was found for S2 and S5. S5 corresponds to dough where no mesquite was incorporated, but it contained much more water (65 g 100 g flour) than control dough prepared with farinographic water level (59/100 g flour). S2 also had an excess of water (69 g/100 g composite flour). In both samples, a coarse, thick threaded and scarcely crosslinked structure was observed.
Fractal dimension values (D) can be related with the complexity of a matrix. In agreement with cualitative appreciation, on filamentous samples with a developed network (S1, S4, and S9), D values were similar: 1.887 (±0.040), 1.898 (±0.017), and 1.872 (±0.035). No significant differences (p < 0.05) were found among these samples when ANOVA was applied. For S7 a D = 1.7751 (±0.058) was obtained. D could not be calculated for the other samples probably due to the coarse or aggregated structure. These results indicated that the amount of mesquite and water are influencing dough structure. In the presence of mesquite, water amount must be adjusted in order to obtain a crosslinked network.
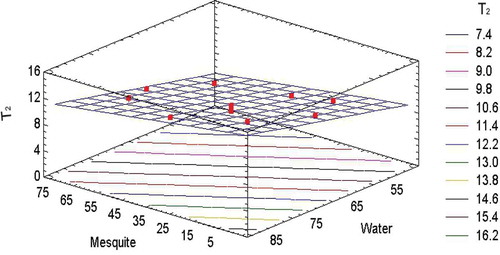
RMN T2 relaxation assays revealed that samples exhibited different mobility (as reflected by the constant T2 calculated from Eq. (3). Response surface obtained with T2 is shown in . Parameters of the linear model representing this surface are reported in . A higher T2 indicates enhanced molecular mobility related with a more flexible network.[Citation30] Samples with higher levels of mesquite had lower mobility, on the other hand samples with the highest water content and the lowest mesquite content (corresponding to S2, S5, S8) exhibited major mobility. Response surface obtained with T2 reveals a similar behavior to cohesiveness and λ1 and an opposite trend to resilience.
FIGURE 6 Response surface and contour graph for parameter T2 (ms) from RMN assays (axes show decoded variables expressed as weight (g)/100 g wheat flour).
CONCLUSIONS
The RSM proved to be a useful tool to analyze the effect on rheological behavior of dough when a partial replacement of wheat by mesquite flour was made. The high level of fiber in mesquite flour leads to changes in textural attributes of dough, probably as a consequence of an inferior development of gluten network. By RSM it could be stated that higher levels of added mesquite flour led to doughs with increased consistency and higher values of dynamic moduli. However, the lesser cohesiveness obtained in these cases also suggested a disruption of gluten matrix. Increasing the amount of water caused the opposite behavior. Amount of water results a critical parameter when obtaining adequate doughs for breadmaking. Farinograph continues to be a useful method for determining optimum water levels for composite doughs. From a microstructural point of view, the dilution of gluten network, the presence of mesquite globular proteins and the high fiber content of mesquite flour can lead to deficient network development. The structure results aggregated and with lesser mobility, which would explain the rheological behavior, particularly when dough water level is not adjusted to the optimum.
ACKNOWLEDGMENTS
The authors want to thank Felipe Forte for his kind help in the language revision of the manuscript.
FUNDING
The authors are grateful to University of La Plata and CONICET (Argentina) for the funds and fellowships received.
Additional information
Funding
Related Research Data
REFERENCES
- Stojanović, J.; Lazić, M.; Stojanović, G.; Nikolić, N. Composition and Radical Scavenging Capacity of Phenolic Compounds in Wheat-Chickpea Dough. International Journal of Food Properties 2014, 17, 1861–1871.
- Rizzello, C.G.; Calasso, M.; Campanella, D.; De Angelis, M.; Gobbetti, M. Use of Sourdough Fermentation and Mixture of Wheat, Chickpea, Lentil, and Bean Flours for Enhancing the Nutritional, Texture, and Sensory Characteristics of White Bread. International Journal of Food Microbiology 2014, 180, 78–87.
- Fagg, C.; Stewart, J. The Value of Acacia and Prosopis in Arid and Semi-Arid Environments. Journal of Arid Environments 1994, 27, 3–25.
- Grados, N.; Cruz, G. La Algarroba: Perspectivas de Utilización Industrial. Serie de Química N°002 (Segunda Edición). Universidad de Piura: Piura, Perú, 1996.
- Proyecto Forestal S.A. 2013. http://www.proyectoforestal.com.ar (accessed July 03, 2013).
- Felker, P.; Bandursky, R.S. Protein and Amino Acid Composition of Tree Legume Seeds. Journal of Science of Food Agriculture 1977, 28, 791–797.
- Marangoni, A.; Alli, I. Composition and Properties of Seed and Pods of the Tree Legume Prosopis Julliflora (DC). Journal of Science of Food Agriculture 1987, 44, 99–110.
- Fenn, D.; Lukow, O.M.; Humphreys, G.; Fields, P.G.; Boye, J.I. Wheat-Legume Composite Flour Quality. International Journal of Food Properties 2010, 13, 381–393.
- Mohammed, I.; Ahmed, A.R.; Senge, B. Dough Rheology and Bread Quality of Wheat-Chickpea Flour Blends. Industrial Crops and Products 2012, 36, 196–202.
- Roccia, P.; Ribotta, P.D.; Pérez, G.T.; León, A.E. Influence of Soy Protein on Rheological Properties and Water Retention Capacity of Wheat Gluten. LWT–Food Science and Technology 2009, 42, 358–362.
- Dervas, G.; Doxastakis, G.; Hadjisavva-Zinoviadi, S.; Triantafillakos, N. Lupin Flour Addition to Wheat Flour Doughs and Effect on Rheological Properties. Food Chemistry 1999, 66, 67–73.
- ACA. 26.1.82. Flours. Tomo I-a. Cap. IX. Art. 661-Res., 167. In Argentinian Codex Alimentarius. De La Canal & Asociados S.R.L. : Buenos Aires, Argentina, 1992; 225 pp.
- AACC International. Approved Methods of the American Association of Cereal Chemists, 10th Ed; American Association of Cereal Chemists: St. Paul, MN, 2000.
- Khuri, A.I.; Cornell, J.A. Response Surfaces: Designs and Analyses. Marcel Dekker: New York, NY, 1996.
- Montgomery, D.C. Design and Analysis of Experiments. John Wiley and Sons: New York, NY, 1997.
- Steffe, J.F. Rheological Methods in Food Process Engineering, 2nd Ed; Freeman Press: East Lansing, MI, 1996.
- Salinas, M.V.; Zuleta, A.; Ronayne, P.; Puppo, M.C. Wheat Flour Enriched with Calcium and Inulin: A Study of Hydration and Rheological Properties of Dough. Food and Bioprocess Technology 2012, 5, 3129–3141.
- Abdel-Aal, E.M.; Sosulski, F.W.; Youssef, M.M.; Adel, A.; Shehata, Y. Selected Nutritional, Physical, and Sensory Characteristics of Pan and Flat Breads Prepared from Composite Flours Containing Faba Bean. Plant Foods for Human Nutrition 1993, 44, 227–239.
- Doxastakisa, G.; Zafiriadisb, I.; Iraklib, M.; Marlanib, H.; Tananakib, C. Lupin, Soya, and Triticale Addition to Wheat Flour Doughs and Their Effect on Rheological Properties. Food Chemistry 2002, 77, 219–227.
- Ribotta, P.D.; Arnulphi, S.A.; León, A.E.; Añón, M.C. Effect of Soybean Addition on the Rheological Properties and Breadmaking Quality of Wheat Flour. Journal of the Science of Food and Agriculture 2005, 85, 1889–1896.
- Rosales-Juárez, M.; González-Mendoza, B.; López-Guel, E.C.; Lozano-Bautista, F.; Chanona-Pérez, J.; Gutiérrez-López, G.; Farrera-Rebollo, R.; Calderón-Domínguez, G. Changes on Doughs Rheological Characteristics and Bread Quality As a Result of the Addition of Germinated and Non-Germinated Soybean Flour. Food and Bioprocess Technology 2008, 1, 152–160.
- Mohammed, I.; Ahmed, A.R.; Senge, B. Effect of Chickpea Flour on Wheat Pasting Properties and Bread Making Quality. Journal of Food Science and Technology 2014, 51, 1902–1910.
- Meyer, D.; Becker, R.; Gumbmann, M.R.; Vohra, P.; Neukom, H.; Saunders, R.M. Processing, Composition, Nutritional Evaluation, and Utilization of Mesquite (Prosopis spp.) Pods as a Raw Material for the Food Industry. Journal of Agricultural and Food Chemistry 1986, 34, 914–919.
- Correa, M.J.; Ferrer, E.; Añón, M.C.; Ferrero, C. Interaction of Modified Celluloses and Pectins with Gluten Proteins. Food Hydrocolloids 2014, 35, 91–99.
- Tromp, R.H.; van de Velde, F.; van Riela, J.; Paquesa, M. Confocal Scanning Light Microscopy (CSLM) on Mixtures of Gelatine and Polysaccharides. Food Research International 2001, 34, 931–938.
- van de Velde, F.; van Riela, J.; Tromp, R.H. Visualisation of Starch Granule Morphologies Using Confocal Scanning Laser Microscopy (CSLM). Journal of the Science of Food and Agriculture 2002, 82, 1528–1536.
- Kim, E.H.-J.; Petrie, J.R.; Motoi, L.; Morgenstern, M.P.; Sutton, K.H.; Mishra, S.; Simmons, L.D. Effect of Structural and Physicochemical Characteristics of the Protein Matrix in Pasta on In Vitro Starch Digestibility. Food Biophysics 2008, 3, 229–234.
- Nagano, T.; Tamaki, E.; Funami, T. Influence of Guar Gum on Granule Morphologies and Rheological Properties of Maize Starch. Carbohydrate Polymers 2008, 72, 95–101.
- Funami, T.; Nakaumaa, M.; Nodaa, S.; Ishiharaa, S.; Asaia, I.; Inouchib, N.; Nishinari, K. Effects of Some Anionic Polysaccharides on the Gelatinization and Retrogradation Behaviors of Wheat Starch: Soybean-Soluble Polysaccharide and Gum Arabic. Food Hydrocolloids 2008, 22, 1528–1540.
- Linlaud, N.; Ferrer, E.; Puppo, M.C.; Ferrero, C. Hydrocolloids: Interaction with Water, Starch, and Protein on Wheat Dough. Journal of Agricultural and Food Chemistry 2011, 59(2), 713–719.