
Abstract
This article evaluated some of the machine vision techniques to classify selected citrus fruits like oranges, sweet-lime, and lemon based on color analysis using single view fruit images. The methods carried out analyze the fruit images to extract the hue and classify using methods like color distance, linear discriminant analysis, and probability distribution function. The performance was evaluated in terms of classification accuracy relative to human classification and computational complexity. Classification accuracy above 90% could be obtained based on color classification. The probability distribution function method was found to be computationally less intensive and providing better accuracy when compared to other two methods. Since surface color is one of the indicators of maturity, color determination was also extended to find the maturity of fruits based on color variations within the same variety of fruits using red/green value ratio. The analysis also showed that the color information found in terms of hue mean and hue median can be utilized to classify the fruits based on maturity. Appropriate algorithms were developed and implemented to classify the fruits based on color and maturity using the above methods.
INTRODUCTION
Fruits can be classified based on their appearance and parameters like color, size, shape, etc. These parameters can be used to determine their quality and classify them. Color is an important property that indicates ripeness, defects, etc. Currently, sizes and color of many food products are inspected by human vision. However, the adaptation of the human eye to slight changes in color and the effect of the background on the perceived color and color intensity are the major drawbacks of visual inspection. To make decisions consistent, machine vision technology based on image analysis using color has proved to be the best technique to determine quality of fruits.[Citation1]
Machine vision-based fruit sorting systems are gaining popularity due to tremendous easiness, clean, and better accuracy compared to the conventional manual inspection which are subjective, very laborious, and time consuming. These systems make use of image processing software for analyzing the fruit quality through images of the fruit taken using a camera. Image processing techniques have accomplished non-destructive analysis of fruits allowing easier determination of size and color of fruits.[Citation2]
Filiberto Pla et al.[Citation3] have developed an embedded system, based on personal computer (PC) architecture without user interface which does size and color sorting of fruits based on values of red–green–blue (RGB) and infrared (IR) using a machine vision unit as part of a distributed control system in which several machine vision modules are integrated with a central control unit and a user interface module. They used commercial progressive scan color and IR cameras which provided non-interlaced video output and asynchronous reset facility. They have computed the size parameters for fruits in terms of their maximum, minimum, or average diameters and color classification using classification rules provided by a binary decision tree.
Aleixos et al.[Citation4] have developed a machine vision system comprising of a parallel hardware and software architecture to classify different species of citrus fruits in real time, attending to external quality features of the fruits such as size, color and, external defects by using a multispectral camera consisting of two charge coupled devices (CCDs) for the color and near infrared (NIR) information. An automated orange maturity sorting system using color grading was developed by Sirisathitkul et al.[Citation5] The system consisted of a color CCD camera for image acquisition and a computer for image processing. The hue saturation intensity (HSI) color model was used and decision rules were derived from the hue color. Raju et al.[Citation6] have conducted studies on non-destructive monitoring of ripeness in different varieties of mangoes by acoustic resonance spectroscopy for online sorting of fruits. According to Vivek Venkatesh et al.,[Citation7] the maturity of fruits for a particular fruit variety can be estimated based on mass and volume, as they are indirectly correlated to the density of the fruits.
Tao[Citation8] has developed a method to sort fruits based on color by obtaining a single hue value from red, green, and blue components measured on the fruits and comparing this hue value to user programmed grading criteria. Lino et al.[Citation9] used electronic systems which consisted of a CCD camera and a personal computer for color analysis of tomatoes based on RGB values. Gaffney[Citation10] determined that a particular variety of oranges could be sorted by color using a single wavelength band of reflected light at 660 nm. This technique was capable of distinguishing normal orange, light orange, and green fruits. Slaughter and Harrel[Citation11] devised a method to identify mature oranges based on color images obtained using a color camera and artificial lighting. The system used the hue and saturation components of each pixel and they were able to classify approximately 75% of the pixels correctly. Because of two-dimensional feature space, two thresholds were employed based on the maximum and minimum values for the saturation and the hue components. Slaughter and Harrel[Citation12] extended their earlier study by using the RGB components of each pixel recorded by a color camera as features and a traditional Bayesian classifier method to segment the fruit pixels from the background pixels. They classified each pixel as belonging to a fruit or to the background without using artificial lighting or optical filters. The tests showed that 75% of the pixels were correctly classified.
Ahmad et al.[Citation13] and Khojastehnazhand et al.[Citation14] have developed citrus fruits sorting system based on color and size, using image processing with CCD cameras. Khojastehnazhand et al.[Citation14] have developed an image processing technique for estimating diameter, volume, mass, and surface area of citrus fruits using two CCD cameras. According to them, though grading systems provide information such as size, color, shape, defect, and internal quality, only color and size are the most important features for accurate classification and sorting of citrus fruits such as oranges, lemons and tangerines. Anna Vidal et al.[Citation15] used the Hunter L, a, b system in their work to determine the citrus color index (CCI).
Image processing can classify the fruits based on different models. The RGB color model represents the model in three separate coordinates and hence, it is not reliable for information on the quality of the fruits. Of the many color models, the HSI model proves the most accurate for evaluation of biological products. Thus, for better image processing and color perception, this HSI model is used. Hue is a color attribute that describes a pure color, whereas saturation gives a measure of the degree to which a pure color is diluted by a white light.[Citation16] As the image captured by the camera is in the RGB format, it is necessary to convert the RGB model into HSI model using a set of equations. Since hue gives the amount of pure color, methods like color distance, linear discriminant analysis (LDA), and Probability Distribution Function (PDF) are used to classify selected citrus fruits into different classes.
MATERIALS AND METHODS
Experimental Setup
Machine vision system used for color imaging of the citrus fruits
Any basic image processing system consists of a personal computer with video graphics array (VGA) color monitor, frame grabber, CCD camera, illumination system, and image analysis software. The system used for our experiments consisted of a CCD camera to capture the images of the fruits. The camera was connected to a personal computer through additional hardware and frame grabber to convert the image obtained in analog form into digital form. This digital image was analyzed by using image processing algorithms to estimate the color of the image.
For our experiments, we used PULNIX 6700 progressive scan camera, which has 2/3” CCD element with resolution of 768 × 494 pixels. It has the capture rate of 60 frames per min. The camera also has other features such as adjustable shutter speeds, remote control through RS232C interface, etc. The image available in the frame buffer is addressed by the CPU at pixel level through software. A NI1428 frame grabber was used in our application. Enough care was taken in the proper design of diffused illumination system for capturing clear images of the fruits which would reduce the pre-processing and enhancing the image before final analysis is carried out.
Methods of Analysis
The proposed image processing techniques estimated the parameters of citrus fruits needed for classification, based on single view fruit images. The images were analyzed using Matlab (Version R2010a) Image Processing toolbox to extract color using various techniques.
Based on Color
Citrus fruits, such as oranges, sweet-limes, and lemons, were used for the study. Oranges may be normally classified into three classes depending on how ripe they are and to suit the consumer’s needs. The three classes have a set of profile images that are used to match as references. These references were used for classifying the samples into each of the classes based on hue and saturation. Methods like color distance, LDA, and PDF were used for analysis.
Color Distance
The algorithm developed, automatically measures the color difference between color distribution of a test fruit image and that of a reference fruit image in a machine vision system. The algorithm developed is based on two parameters, namely hue and saturation. The references for each of the classes were used for comparison. The RGB values of each of the images were converted to HSI values. Hue and saturation values of the reference fruit images, HRef and SRef were calculated from RGB values[Citation16] using equations,
and
The hue and saturation values of the test fruit images, HTest and STest were also obtained from their respective RGB images. The color distance was calculated for each pixel of the test fruit image with the reference fruit image[Citation16] using the formula:
After calculating the distances for every pixel of the test fruit image, the sum of the distance values was calculated. The sum of the “D” value is called city block distance, which is also called as color difference between the test and reference. The color distance is a single parameter whose value varies as a function of color similarity/dissimilarity between the test and the reference. A value of zero indicates the two-color distributions are identical. As dissimilarity increases, the color distance value “D” also increases. In other words, color distance provides an analog scale with which to measure the closeness in color of two images.[Citation16]
It was found that changes in light intensity level during inspection affected the results of classification. Although in theory, hue should be independent of intensity of an image, i.e., lighting level, experiments showed that the hue histogram of a citrus shifted toward the right direction of hue map if the intensity was increased by changing the lens aperture or lighting level, and shifted toward the left direction of the hue map if intensity was decreased. To solve this problem in color inspection, the intensity level should remain the same for both sample training and testing stage. After grouping, the citrus fruits were imaged and their H and S values were stored in memory location.
LDA
LDA easily handles the case where the within-class frequencies are unequal and their performances have been examined on randomly generated test data.[Citation17] This method maximizes the ratio of between-class variance to the within-class variance in any particular data set thereby guaranteeing maximal separability. LDA is used in classifying citrus fruits based on their hues. For applying LDA, the three-dimensional RGB space is reduced to a one-dimensional “H” space. For a digitized color image, the hue histogram represented the color components and the amount of that hue in the image.
The orange fruits were divided into three classes. The sweet-lime and lemon were added as two different classes. The training matrix consisted of the means of the hue matrices of the five classes, respectively. A test sample was taken and its hue matrix was obtained. The mean of the matrix was then taken as the sample matrix and classified into one of the five classes using LDA. The posterior probabilities were obtained after classification using MATLAB functions to determine to which class the sample belonged.
A probability histogram is a histogram with possible values on the x-axis, and probabilities on the y-axis. It is drawn to represent the proportion (fraction) in each category (bin). Bar width represents the range for the category (bin). A histogram is preferred as a graphical way of presenting data which have been collected in categories.[Citation18]
The fruit samples of each class were taken and its hue matrices were obtained by converting it to HSI. Since the HSI model is more accurate for image processing and recognition, it is necessary to convert the images from RGB to HSI. Hue gives the pure color undiluted by white light and is used for comparing colors of different classes of fruits.[Citation16]
The non-zero values in the hue matrices were extracted to obtain the region of the fruit, leaving out the background. A histogram was then plotted by taking a constant number of bins (in this case 100) and stored. The histogram values were then normalized. The values so obtained gave the PDF of the sample. The mean of the samples of each class was taken and the PDF of each class was obtained. The PDF of the sample fruit was obtained similarly from its hue matrix.
Covariance was used as a classifier to sort the sample into one of the classes. The sample was compared with each of the classes by obtaining the covariance/correlation coefficient between the two. The closer the sample was to a class of fruits, the higher the covariance.
Based on Maturity
Surface color is a measure of the quality parameter with respect to maturity of fruits. Many unripe fruits initially show greenish surface color which gradually changes to yellow color when they mature. The change of color patterns is similar within each fruit category. The consumer often judges the ripeness of the fruits by its color.[Citation19] In the experiments, the RGB color space was used to measure the color variation. The percentage of red component was measured as R/(R + G + B) × 100, where R, G, and B denote the red, green, and blue components, respectively, and similarly the percentage of blue and green components were also measured.[Citation19] The R/G ratio is the ratio of the red component to the green component and was used as a parameter to classify fruits based on their ripeness/maturity. The maturity classification was also done using hue mean and hue median values. The values of the ranges and the classifying categories depend upon the needs of the consumers and the graders.
RESULTS AND DISCUSSIONS
Color Analysis
Color distance
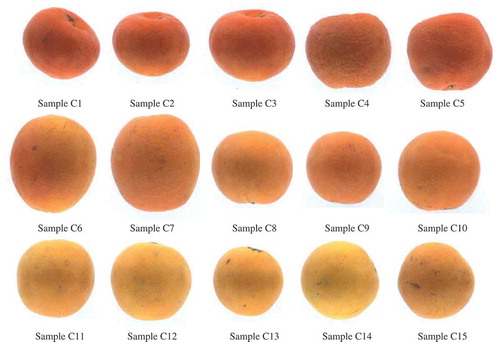
A human expert grader separated roughly about 105 orange fruits into three arbitrary classes, 35 fruits of each class, based on color. Out of these, 20 fruits from each class were taken as references (total 60 reference fruits) for training and 15 fruits of each class were taken as samples (total 45 sample fruits) for validation. Due to space restriction, one fruit of each reference class and five fruits of samples belonging to each class (C1 to C15) are shown in and , respectively. The reference class fruits shown were named as Class 1, Class 2, and Class 3. After capturing the images of all the 105 fruits, using the MATLAB Image Processing toolbox the RGB values and the HSI values of the fruits were determined and the color distances of the 45 samples were computed using Eq. (3). They were then classified based on the least distance indicating its closeness to that class. The values of color distances for a few samples are given in . The overall classification accuracy using color distance method was found to be 93%.
TABLE 1 Color distances of oranges of different classes
FIGURE 1 Class references for color distance analysis.
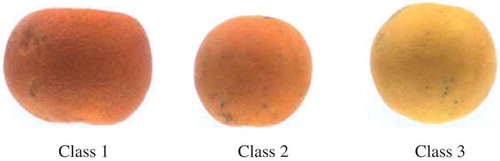
FIGURE 2 Fruit samples for color distance analysis.
LDA
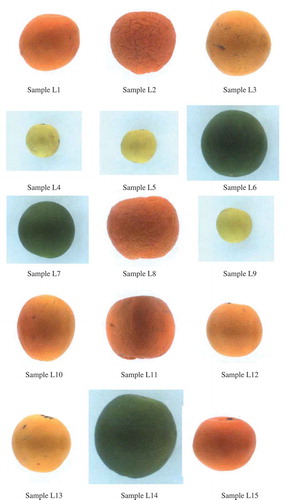
Out of 20 reference orange fruits belonging to each of the three classes used for training in color distance analysis method, three orange fruits of each class were selected and shown as references in this method. They were named as Class A, Class B, and Class C. Also the human expert selected 35 sweet-lime fruits and 35 lemons of good quality. Out of these, 20 sweet-lime fruits and 20 lemons were selected as references and were used for training. They were classified as Class D and Class E, respectively. (The remaining 15 sweet-lime fruits and 15 lemon fruits along with 45 orange fruits belonging to three different classes were used for validation). Examples of these five reference class fruits are shown in . Some of the sample fruits of mixed classes (L1 to L15) used for testing and validation are shown in .
FIGURE 3 Class references for LDA and PDF analysis.
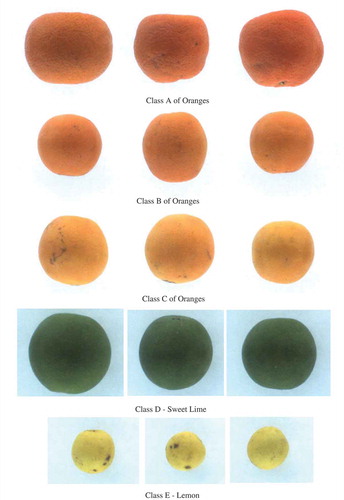
FIGURE 4 Fruit samples for LDA and PDF analysis.
LDA is a classifier in itself, and hence the posterior probabilities of the samples belonging to each of the classes were obtained. Some of the values of posterior probabilities are compiled in . From , it is seen that the sample fruit matching with the reference class fruit has the maximum probability, which agrees with the visual inspection. However, the overall classification accuracy using LDA method was found to be 93%.
TABLE 2 Posterier probabilities of various samples using LDA
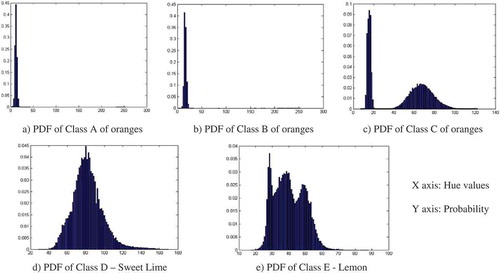
The reference and the sample fruits used for LDA were used for PDF analysis also. The probability distributions of various classes were obtained by normalizing their histograms. The plot of PDFs of all classes compared with the PDF of the sample is shown in . The probability distribution of sample classes is shown in . The correlation coefficients between some of the samples and each reference class were calculated and are given in . The correlation coefficients value closest to 1 indicates maximum correlation or similarity. This PDF method of classification is in good agreement with the visual inspection with 95% classification accuracy.
TABLE 3 Correlation coeffecients of various samples using PDF
FIGURE 5 Plot of probability distributions of a sample and five classes.
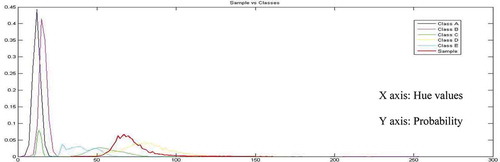
FIGURE 6 Probability distributions of 5 classes—Class A, B, C of oranges, sweet lime, and lemon.
Saturation and Hue
Saturation gives a measure of the degree to which a pure color is diluted by a white light. Hue is invariant to changes in light intensity and hence, it is a better parameter than saturation. The classification of fruits based on LDA and PDF techniques using Hue values is nearly matching with the manual assessment as seen in and hence, high classification accuracy is obtained. If saturation is used instead of hue, the results are not as accurate as before as seen in . Although it separates the sweet-lime, lemon, and oranges from each other, within the orange classes, it does not classify the oranges into each of its appropriate classes and only 11% classification accuracy could be obtained.
TABLE 4 Results using hue as parameter of classification
TABLE 5 Results using saturation as parameter of classification
Maturity Analysis
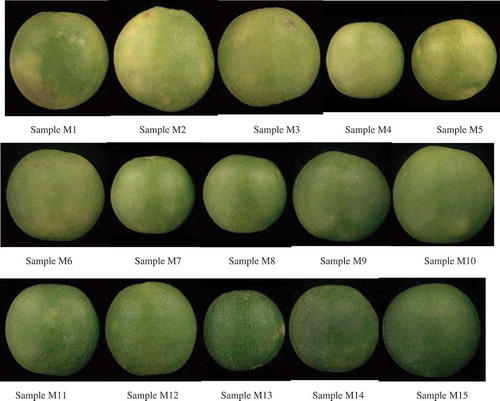
Forty-five sample orange fruits which were used for color distance analysis were used for fruit maturity analysis also and few of them (C1 to C15) are already shown in . Also, 45 sample sweet-lime fruits which were used for LDA and PDF analysis were used for maturity analysis and few of them (M1 to M15) are shown in . In both the cases of oranges and sweet-limes, sample fruits of each category were classified as ripe fruits, moderately ripe fruits, and unripe fruits, respectively, by the human expert. From the color images already captured for the 45 orange fruits and 45 sweet-lime fruits, the Red (R), Blue (B), and Green (G) color space in matrix form were got from the RGB images, using the MATLAB Image Processing toolbox. The R/G ratios for all the sample fruits were obtained. Also, hue mean and hue median values were obtained for all the orange fruit samples and sweet-lime fruit samples.
FIGURE 7 Sweet-lime samples for maturity analysis.
Oranges with R/G values above 1.05 were classified as ripe, values below 1.03 as unripe, and values between the 1.03 and 1.05 as moderately ripe. For these oranges, it was also observed that the hue mean value for ripe fruits were less than 0.22, unripe above 0.24, and moderately ripe between 0.22 and 0.24. The hue median value for ripe fruits were less than 0.06, unripe above 0.09, and moderately ripe between 0.06 and 0.09.
Similarly, sweet-limes with R/G values above 0.95 were classified as ripe, ones with values below 0.85 unripe, while the ones with values between 0.85 and 0.95 were classified as moderately ripe. It was observed that the hue mean value for ripe fruits were less than 0.22, unripe above 0.24, and moderately ripe between 0.22 and 0.24. The hue median value for ripe fruits were less than 0.19, unripe above 0.22, and moderately ripe between 0.19 and 0.22.
Few samples of each category of orange fruits and sweet-lime fruits classified based on maturity is given in and . The classification seems to agree perfectly with the visual judgment as seen in and . Based on the above results, the criteria for the maturity class of orange fruits samples and the sweet-lime fruits samples were set and are tabulated in .
TABLE 6 Orange fruits classification based on maturity
TABLE 7 Sweet-lime fruits classification based on maturity
TABLE 8 Criteria for the matutity class
The algorithms used in the proposed methods of color analysis and maturity analysis are summarized and shown in . However, in , algorithms are given only for the classification based on R/G ratio and not for the classification based on hue mean and hue median.
FIGURE 8 Algorithms used in the proposed methods of color analysis and maturity analysis.
CONCLUSION
Algorithms were developed to classify the selected citrus fruits, such as orange, sweet-lime, and lemon, based on single view fruit images and the fruits were categorized into different classes based on external parameters like color and maturity. The single view fruit images were analyzed to extract the hue and classify using methods like color distance, LDA, and PDF. The results clearly indicate that either hue or hue and saturation are sufficient for color classification, whereas the use of saturation alone doesn’t give satisfactory results. For the color distance method, both hue and saturation were used for color classification. For classification based on LDA and PDF, hue alone was used. Same accuracies were obtained while using hue or combination of hue and saturation. LDA method is mathematically intensive compared to PDF. The PDF method uses hue alone and it is very less intense in computation. However, in all these methods, above 90% classification accuracy could be obtained based on color classification. Considering accuracy of classification and less intense in computation, it is suggested that for this kind of selected citrus fruits, the PDF method of color classification is preferred compared to color distance method and the LDA method. Maturity of fruits is derived from the color of the fruits. As color is one of the prime parameter for maturity evaluation, color classification was also extended to find the maturity of fruits based on the color variations within the same variety of fruits. Maturity classification was done based on R/G ratio. Further, the analysis of color has shown that the hue parameter also provided good classification of maturity. The classifications were in good agreement with the human visual inspection. Hence, using color analysis of fruits, one can be able to sort the fruits based on color and maturity which is important for value addition of fruits. By slightly modifying the algorithms, the methods can be extended for color classification of other fruits like apples, mangoes, and other varieties of citrus fruits.
ACKNOWLEDGMENTS
The authors sincerely thank the Director at CSIR-CEERI and the Scientist-in-Charge at CSIR-CEERI Chennai Centre for their valuable support.
Related Research Data
REFERENCES
- Sudhakara Rao, P.; Gopal, A.; Revathy, R.; Meenakshi, K. Colour Analysis of Fruits Using Machine Vision System gor Automatic Sorting snd Grading. Journal of Instrument Society of India 2004, 34(4), 284–291.
- Narendra, V.G.; Hareesh, K.S. Quality Inspection and Grading of Agricultural and Food Products by Computer Vision. International Journal of Computer Applications (0975–8887) 2010, 2(1), 43–65.
- Pla, F.; Sanchiz, J.M.; Sanchez, J.S.; Ugolini, N.; Diaz, M. A Machine Vision System for On-Line Fruit Colour Classification. Proceedings of the IX Spanish Symposium on Pattern Recognition and Image Analysis, Benicasim (Castellon), Spain, 2001, 323–330 pp.
- Aleixos, N.; Blasco, J.; Molto, E.; Navarron, F. Assessment of Citrus Fruit Quality Using a Real-Time Machine Vision System, In Pattern Recognition, 2000. Proceedings of the 15th International Conference on 2000, Vol. 1, IEEE, 482–485.
- Sirisathitkul, Y.; Thumpen, N.; Puangtong, W. Automated Chokun Orange Maturity Sorting by Colour Grading. Walailak Journal of Science and Technology (WJST) 2011, 3(2), 195–205.
- Raju, P.H.; Jagannath, J.H.; Ashok, N.; Das Gupta, D.K.; Bawa, A.S. Nondestructive Monitoring of Ripeness in Mango Cultivars by Acoustic Resonance Spectroscopy. International Journal of Food Properties 2006, 9, 487–501.
- Vivek Venkatesh, G.; Md.Iqbal, S.; Gopal, A.; Ganesan, D. Estimation of Volume and Mass of Axi-Symmetric Fruits Using Image Processing Technique. International Journal of Food Properties 2015, 18, 608–626.
- Tao, Y. 1996. Method and Apparatus for Sorting Objects by Colour Including Stable Colour Transformation. U.S. Patent 5,533,628 filed August 19, 1994 and published July 9, 1996.
- Lino, A.C.L.; Sanches, J.; Dal Fabbro, I.M. Image Processing Techniques for Lemons and Tomatoes Classification. Bragantia 2008, 67(3), 785–789.
- Gaffney, J.J. Reflectance Properties of Citrus Fruit. Transactions of the ASAE 1969, 16(2), 310–314.
- Slaughter, D.; Harrel, R.C. Colour Vision in Robotic Fruit Harvesting. Transactions of the ASAE 1987, 30(4), 1144–1148.
- Slaughter, D.; Harrel, R.C. Discriminating Fruit for Robotic Harvest Using Colour in Natural Outdoor Scenes. Transactions of the ASAE 1989, 32(2), 757–763.
- Ahmad, U.; Mardison, S.; Tjahjohutomo, R.; Nurhasanah, A. Development of Automatic Grading Machine Prototype for Citrus Using Image Processing. Australian Journal of Agricultural Engineering 2010, 1(5), 165–169.
- Khojastehnazhand, M.; Omid, M.; Tabatabaeefar, A. Development of a Lemon Sorting System Based on Colour and Size. African Journal of Plant Science 2010, 4(4), 122–127.
- Zaragoza, A.V. Measurement of colour of citrus fruits using an automatic computer vision system. PhD dissertation, Polytechnic University of Valencia 2013.
- Gopal, A.; Revathy, R.; Meenakshi, K.; Sudhakara Rao, P. Colour Classification of Fruits Using Colour Distance Method, In Proceedings of 4th International Conference on Trends in Industrial Measurements and Automation (TIMA 2004), Chennai, India, December 16–18, Chennai, 2004, 355–362 pp.
- Balakrishnama, S.; Ganapathiraju, A. Linear Discriminant Analysis—A Brief Tutorial. Institute for Signal and Information Processing; Mississippi State University: Starkville, MS, 1998; 9 pp.
- Histogram and Probability Density Function—MEE 288 Data Analysis Lab, Ohio University.
- Amarasinghe, D.I.; Sonnadara, D.U.J. Surface Colour Variation of Papaya Fruits with Maturity, In Proceedings of the 25th Technical Sessions, Institute of Physics, Sri Lanka, March 2009, Vol. 25, 21–28 pp.