
Abstract
Stenocereus stellatus fruits from Puebla, Mexico, with red, purple, yellow, and white pulp were characterized regarding their total betalain content, and physicochemical properties. The total betalain content was 856.07–2968 µg per gram of pulp dry weight. Using principal component analysis, the levels of pigments in S. stellatus fruits were compared with 32 samples from other cactus fruits. As a result, three confidence intervals for total betalain content (μg g−1) were calculated: low (<1208), medium (2935–3288), and high (4488–9248). Thus, the cactus fruits can be categorized as a poor, good, and excellent source of betalain pigments.
INTRODUCTION
In the food industry, pigments are used to standardize the appearance foods when there are natural variations in raw products, to correct the color loss that occurs during processing, or to make some foods more attractive (e.g., beverage and confectionery) in order to encourage their consumption.[Citation1] The most used synthetic pigments are those that impart a yellow and red tinge to foods, but only two yellow pigments (FD and C Yellow 5 and FD and C Yellow 6) and 2 red pigments (FD and C 3 and FD and C 40) were approved by the U.S. Food and Drug Administration (FDA) for use in foods.[Citation2] There is an increasing concern about the use of synthetic dyes because some of them have shown carcinogenic effects on laboratory animals.[Citation3] Hence, consumers are looking for more natural food products. Anthocyanins and betalains are natural pigments present in some fruits or vegetables and have been proposed as substitutes of red synthetic colorants; thus, intensive research has been recently done on the potential sources of these pigments.[Citation4–Citation7] In addition to their tinctorial properties, the natural pigments possess antioxidant, anticancer, and antimicrobial properties.[Citation8] Research into cactus fruits has been growing because they are a promising source of phytochemicals and pigments (such as betalains) for the food industry.[Citation9] The fruits of Opuntia[Citation10,Citation11] and Hylocereus[Citation12,Citation13] are the most studied sources of bioactive compounds from cacti. The fruits of the Stenocereus genus, commonly named pitayas, are another source of pigments. Pitayas are cherished by the local people due to the delicious taste and a variety of attractive colors. Geographical distribution of the Stenocereus genus is limited to the American continent, with a great diversity of species; some of them are endemic to Central Mexico.[Citation14] Recently, a few studies on the fruits of S. griseus and S. pruinosus regarding their antioxidant capacity (AC), total phenolic compounds (TPC), betalains, and minerals[Citation4,Citation15] have been published, but the research into the functional properties of S. stellatus has been scarce.
To our knowledge, the nutrient composition, AC, TPC, pigment content, and color properties of white-, yellow-, purple-, and red-pulp types of fruits of S. stellatus from the State of Puebla, Mexico, have not been reported. Therefore, in this work, we evaluated those parameters. Furthermore, using principal component analysis (PCA), the pigment content values of S. stellatus fruits were compared with that reported in the literature for fruits of other cacti.
PCA is a statistical tool that allows a researcher to group variables into subsets that are relatively independent from one another. Accumulated variables, called principal components (PCs), represent underlying processes responsible for a relationship among variables in the original dataset.[Citation16] This methodology has been used for differentiation of food products on the basis of geographical distribution[Citation17] and levels of bioactive compounds[Citation18] and for identification of food adulteration.[Citation19] In the present work, PCA was used to differentiate 4 types of S. stellatus fruits by color parameters and by the level of ascorbic acid (AA), AC, TPC, and pigments.
PCA was also used in this work to analyze the concentration of total betalains (TB), betaxanthin (Bx), and betacyanin (Bc) in the S. stellatus fruits and to compare these data with those reported for fruits of other genera—Stenocereus, Opuntia, and Hylocereus—to distinguish different groups based on those characteristics and thereby, to find confidence intervals (CI) for cactus fruits with high, medium, and low pigment content. This way, we evaluated the potential of S. stellatus fruits as a source of food colorants.
MATERIALS
Chemicals
All the reagents used here were of analytical grade. Gallic acid, ABTS [2,2-azinobis-(3-ethylbenzothiazoline 6-sulphonic acid)], Trolox (6-hydroxy-2,5,7,8-tetramethylchromane-2-carboxylic acid), AA, and 2,6-dichloroindophenol sodium salt were obtained from Sigma-Aldrich (Mexico).
Plant Material
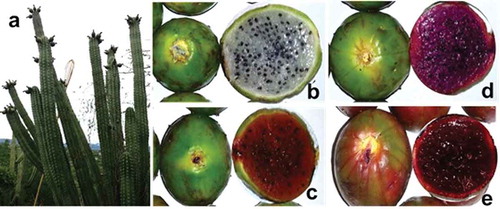
The S. stellatus fruits were collected in Santiago Tonahuiztla Puebla (18° 12′ 5.35′′ N latitude, 97° 53′ 50.75′′ W longitude) during the harvest season from August to September 2013. shows the plant of pitaya (S. stellatus) and the four types of fruits analyzed in this work. The collected fruits weighed between 76.22 and 100.58 g and were 5.05 to 6.08 cm long, with a diameter 5.04 to 5.77 cm. Samples of yellow- and red-pulp fruits of S. pruinosus were collected for betalain analysis, in the same area of production in May 2014.
FIGURE 1 (a) The S. stellatus cactus and its fruits: white (b), yellow (c), purple (d), and (e) red pitayas.
METHODS
Sample Selection and Preparation
Healthy fruits without blemishes or bumps were selected, and their spines were removed. After that, the fruits were packaged in polyethylene bags under vacuum and stored at –20°C until analysis. Prior to the analysis the samples was thawed at 4°C for 24 h; the skin of the fruit was removed, and the pulp was sieved through 710-μm mesh (No. 25) to homogenize the pulp and to eliminate the seeds.
Proximate Analysis
The Kjeldahl method was used to quantify total nitrogen (AOAC method 920.152); the protein concentration was estimated using the nitrogen factor of 6.25. Fat was measured by means of extraction with petroleum ether using a Soxhlet apparatus (AOAC method 920.39). Water content was determined according to the loss of weight of the sample after drying in an oven at 110°C (AOAC method 934.06); ash content was calculated by heating the sample at 550°C to constant weight (AOAC method 942.05). Crude fiber was determined based on acidic and alkaline digestion (AOAC method 962.09). Reducing sugars (RS), and total RS (carbohydrates) were quantified using the Lane-Eynon volumetric method (AOAC method 923.09). All assays were performed in triplicate, and the results were expressed as a percentage of fresh weight (FW).
Physicochemical Analysis
All assays of fruit pulp were performed according to the official methods of the AOAC.[Citation20] The soluble solids (SS) were quantified using an ABBE refractometer (AOAC method 932.12) and expressed as °Brix. Acidity was measured by titration (AOAC method 942.15) and expressed as malic-acid content. The pH levels were measured using a pH-meter (Denver Instrument UB-10 Colorado, USA; AOAC method 981.12).
Color Measurements
Twenty-five grams of homogenized fruit pulp without seeds was placed in the colorimeter sample container. The color parameters L*, a*, and b* were measured using the colorimeter (Hunter Lab CFEZ1005, Virginia, USA) with a measuring area of 8 mm, D65 illuminant, and a 10° observer angle against a white background. The hue angle (Hº) and Chroma (C*) values were calculated using Eqs. 1 and 2:[Citation21]
Preparation of the Extracts of the S. stellatus Fruits
A portion (2.5 g) of the homogenized fruit pulp was added to 5 mL of a methanol:water mixture (80:20), and the suspension was placed in 50-mL test tubes with screw caps. These suspensions were vortexed for 1 min at the maximum speed and then centrifuged at 1010 × g for 20 min. The supernatant was kept, and extraction of the remaining solid was repeated one more time under the same conditions to extract most of the bioactive compounds from the fruit pulp. The resulting extracts were placed in a 10-mL volumetric flask, and the full volume of the tubes was filled with the methanol:water mixture (80:20) to obtain methanolic extracts (ME). These extracts were used for measurement of TPC and AC and for acquisition of absorption spectra. Aqueous extracts (WE) were prepared as described above using distilled water as a solvent to quantify TB, Bx, and Bc.
Absorption Spectra of the ME Extracts
An absorbance scan of ME extracts was performed between 190 and 700 nm on a UV-Vis spectrophotometer (HACH DR 5000, Mexico, Mexico).
Quantification of TPC
Four hundred microliters of ME extracts was mixed with 3 mL of distillated water, 200 µL of the Folin-Ciocalteu reagent solution, and 400 µL of a 20% sodium carbonate solution.[Citation22] The mixture was vortexed for 30 s and kept in the dark for 30 min at 20 ± 2°C; the absorbance was measured at 765 nm. TPC values were presented as a milligram of a gallic acid equivalent (GAE) per gram of dry weight (DW) of pulp.
AC by the ABTS Antioxidant Assay
The radical ABTS●+ was generated by incubating an ABTS solution (7 mM) with potassium persulfate (2.45 mM):[Citation23] the mixture was allowed to stand in the dark for 16 h before use. One milliliter of the ABTS●+ radical solution was diluted with 100 mL of 0.01 M potassium phosphate buffered saline (PBS), pH 7.4, to attain absorbance of approximately 0.7 ± 0.02 (mean ± SD) at 734 nm. A 200-µL aliquot of ME was taken and added to 3.8 mL of the ABTS radical solution; the mixture was vortexed for 10 s and was allowed for stand in the dark for 7 min at 20 ± 2°C. Its absorbance was measured at 734 nm (Af). A blank for each sample was 200 µL of methanol (its absorbance, A0, at 734 nm was measured). The percentage of radical inhibition was calculated and interpolated using a calibration curve of 3–20 μM Trolox. The results were expressed as µmoles of Trolox equivalent (TE) per gram of pulp DW.
Pigment Quantification
Bx and Bc content of the WE extracts was quantified by measuring their absorbance[Citation24] at 538 and 483 nm, respectively, on a spectrophotometer UV-Vis (Hach DR5000, Mexico, Mexico). Bx and Bc concentrations were calculated using Eq. 3. TB was calculated by adding up Bx and Bc.
AA
The xylene extraction method was used.[Citation25] One gram of a sample was added to 10 mL of 3% H3PO3, and the suspension was vortexed for 1 min and centrifuged at 1010 × g for 20 min. A 400 µL aliquot of the supernatant was added to 400 µL of 3.04 M acetate buffer pH 4.0, 600 µL of a 0.0007 M 2,6-dichloroindophenol solution, and 3 mL of xylene. The mixture was stirred for 10–15 s; after that, the xylene phase was separated and its absorbance was measured at 520 nm using xylene as a blank sample. A calibration curve for AA was constructed and tested under similar conditions. The results were expressed in milligrams of AA per gram of pulp DW.
Statistical Analysis
The assays of the S. stellatus samples were performed in triplicate. The data were expressed as mean ± standard deviation (SD), and then analysis of variance (ANOVA) was performed and the least significant difference (p < 0.05) to compare the means. PCA was used to explore the relationships among the 4 types of pitayas with respect to their physicochemical properties (pH, acidity, L*, a*, b*, AC, and concentrations of Bc, Bx, TB, TPC, AA, carbohydrates [CHO], and RS).
In this work, the variables were standardized by units of SD. The standardized data of each sample were then subjected to PCA. This way, the data could be reduced to a set of new latent variables called PCs. The loadings represented the relative contribution of each variable in the PCs, and the score values showed the location of each sample within a PC.[Citation26] The relationship between the variables and samples was shown in PCA graphs.
Values of Bc, Bx, and TB content reported in the literature from 2006 to 2013 for 30 types of fruits of the genera Opuntia, Hylocereus, and Stenocereus from several countries were collected and compared with those obtained in the present work for S. stellatus and S. pruinosus using PCA. To standardize the pigment content data on the DW basis, average moisture content of 84.47% for Opuntia and 89.99% for Hylocereus was assumed when it was necessary. The graphs showed the grouping of the samples by pigment content. In addition, a grouping of the samples was performed by Bc, Bx, and TB content in intent-to-propose CIs.[Citation27] Data processing was performed in the Minitab 16 (Minitab Inc., Pennsylvania, USA) and Unscrambler X software (CAMO Software AS, Oslo, Norway).
RESULTS AND DISCUSSION
Proximate Analysis of S. stellatus Fruits
Demand for cactus fruits has been increasing worldwide due to their delicious taste and nutritional properties. Nonetheless, many of them are consumed regionally; therefore, they have not been well characterized. The pitayas of S. stellatus are cultivars whose economic importance is high in semiarid regions of the State of Puebla, Mexico, but the nutrient composition of these fruits is unknown. In this work, the composition of white, red, yellow, and purple types of pitayas was determined () in order to determine the contribution of these fruits to the dietary intake of various nutrients by the consumer and to encourage their consumption and utilization. The water content (85.39–86.65%) and total carbohydrate content (9.65–10.85%) were the main components in S. stellatus analysis, and they were similar to other fruits from Stenocereus genera[Citation4,Citation28] and other fruit plants, such as apples, apricots, oranges, and cactus pears.[Citation29]
TABLE 1 Proximate analysis, physicochemical characteristics, and color properties of white, yellow, purple, and red types of S. stellatus fruits in Mexico
Physicochemical Characterization
Physicochemical properties of fruits, such as SS and acidity are related to their ripeness and may become a harvest or quality index.[Citation30] A good balance among pH, sugars, and titratable acidity is necessary for optimal taste. It was suggested that a sugar:acid ratio between 10:1 and 18:1 is indicative of a good taste and acceptability of a fruit.[Citation31] In the present study, sugar:acid ratios for S. stellatus fruits ranged from 12 to 20; this finding means that the pitayas have a pleasant sweet-sour taste. Our titratable acidity values are higher than those reported for S. pruinosus, S. queretaroensis, or O. ficus-indica fruits.[Citation4,Citation31] The pH of the pulp samples was acidic (3.37–3.64); this situation enhances their microbiological stability. These values are higher than those reported for Opuntia and Hylocereus fruits.[Citation31]
Color Properties
The chromatic parameters L*, a*, b*, Hº, and C* of the pulp of S. stellatus fruits from Puebla, Mexico, showed significant differences (p < 0.05) among fruit types (). The purple and red pitayas were darker (lower L* value) than the other fruit types. Hue angle values for pitaya pulp were in the yellowish-reddish region, but the purple pitaya had a lower Hº value and a higher a*/b* ratio, indicative of stronger coloration.[Citation32] The values of L*, Hº, and C* of the yellow and red S. stellatus fruits were similar to those reported by García-Cruz et al.[Citation4] for S. pruinosus orange (L* = 25.7, Hº = 28.9, Chroma = 35.0) and red fruits (L* = 19.4, Hº = 19.8, Chroma = 24.7).
Absorption Spectra
Cactus fruits frequently contain mixtures of betalains and Bxs with diverse structures, according to spectrophotometric and mass-spectrometric analysis.[Citation24] Analysis of absorption curves of pitaya extracts showed differences in the UV-Vis profile among all samples (Online Resource 1). In the ultraviolet (UV) region, a maximum peak (λ1) was displayed at 218, 220, 224, and 228 nm for purple, yellow, white, and red fruit samples, respectively. The pulp of SSWM pulp is colorless and it did not show absorbance in the visible spectrum region. In contrast, SSRM, SSYM, and SSPM samples displayed a second peak (λ2) at 484, 484, and 490 nm, respectively, which are characteristic wavelengths of Bx. Additionally, both SSRM and SSPM displayed a third peak (λ3) at 536 nm, which matched Bc pigments. Nonetheless, the λ2/λ3 ratio was indicative of changes in the tinge of each type of fruit.[Citation31] The highest λ2/λ3 ratio in SSYM suggested that the fruit tinge is yellow-orange and demonstrated that Bxs predominate in its pulp. In contrast, the lowest λ2/λ3 ratio was in SSPM, meaning that Bcs are the predominant pigments there.
TPC, AA, Pigments, and AC of S. stellatus Pulp
The results on the bioactive compounds of pitaya pulp are shown in . There were significant differences (p < 0.05) in AC, AA, and pigment content among fruit types. The biological functions of betalains, phenolic compounds, and AA are centered mainly on their antioxidant properties: They protect to the humans from various chronic diseases that have their origins in oxidative stress. The principal source of these compounds is fruits and vegetables; therefore, high concentrations of these nutrients are desirable. The fruits in this study contain the lowest amounts of TPC than what was reported for different berries, with values between 25 and 84.8 mg GAE g–Citation1 DW.[Citation33] TPC of S. stellatus pitayas is higher than that reported for Hylocereus and S. griseus and for prickly pear fruits from the USA[Citation4,Citation15,Citation24,Citation35–Citation38] ().
TABLE 2 Total phenolic content (TPC), antioxidant capacity (AC), pigments, and ascorbic-acid (AA) content of Stenocereus stellatus fruits with white (SSWM), yellow (SSYM), purple (SSPM), and red pulp (SSRM)
TABLE 3 Pigments, total phenolic compounds (TPC), and antioxidant capacity (AC) of cactus fruits from different countries
AC of pitayas (determined using the ABTS method) was similar to that reported by Gorinstein et al.[Citation33] for berries (80–620 μM TE per g DW), except for SSPM; and higher compared to prickly pear fruits[Citation4,Citation15,Citation24,Citation35–Citation38] (). The highest AA content was found in SSWM fruits (4.11 mg per g pulp DW), . The AA values for S. stellatus were in agreement with those reported by Ruiz et al.[Citation34] for calafate fruits (1.36–4.89 mg∙g–Citation1).
PCA of Physicochemical Properties of S. stellatus Fruits
PCA was used to identify any possible clusters within the analyzed pitaya samples. The scores of the first three PCs for four pitaya cultivars are presented in . Four classes were separated well (), corresponding to SSWM (white), SSYM (yellow), SSPM (purple), and SSRM (red) pitaya. The first three PCs accounted for 95.70% of the total variation (PC1: 59.70%; PC2: 24.00%; PC3: 12.00%).
FIGURE 2 Three-dimensional plots of the principal components PC1, PC2, and PC3 for (a) scores of the samples; (b) loadings of the variables. SS: Stenocereus stellatus; W: white; Y: yellow; P: purple; R: red.
The clustering was most likely caused by small-to-medium differences in many factors: pH, acidity, L*, a*, b*, Bc, Bx, TB, TPC, AA, CHO, RS, and AC but not by large differences any individual parameter. Therefore, the four pitaya cultivars could be effectively specified by PCA. shows a 3-dimensional plot of these PCs.
illustrates the relationship between the variables and the cultivars. The PC plot clearly discriminated two groups (): samples with pigments (SSRM, SSPM, and SSYM) and without pigments (SSWM). Not surprisingly, TB, Bc, and Bx were clustered together on the positive area of PC1, as was TPC.
SSRM was closer than SSYM and SSPM to TB, Bc, and Bx, indicating that SSRM has the highest betalain content. As expected, the colorless SSWM was the furthest of these points and closer to L*. Moreover, SSWM was closer to AA, RS, and acidity (negative PC1, positive PC2), meaning that white pitayas are sweeter and more acidic fruits containing a higher concentration of AA than do the other S. stellatus cultivars.
Grouping of Cactus Fruits in PCA by Pigment Content
Because of some technological disadvantages of beetroot (Beta vulgaris) as a source of betalains, cactus fruits of the genera Opuntia and Hylocereus have been proposed as an alternative natural food pigment source. As demonstrated in our study, S. stellatus fruits are rich in pigments and antioxidants and could be used to obtain red pigments. Concentrations of phytochemicals (including pigments) in fruits depended mainly on the genus, species, ripeness, cultivar (strain), season, and growth region of the plant. Comparison of reported pigment content data is a difficult task because there are no standard extraction or analysis methods or a standard way to present the results. Nonetheless, the Bx, Bc, and TB data of 35 types of cactus fruits of Stenocereus and other genera from different regions of the world[Citation4,Citation15,Citation24,Citation35–Citation38] () were tested using PCA in order to group these cactus fruits by their pigment content. Additionally, CIs for sample grouping on the basis of the pigment content were proposed in order to determine the usefulness of S. stellatus as a betalain source.
shows a 2-dimensional plot of 2 PCs (PCs: PC1: 82.2% and PC2: 17.8%) that explained 100% of the data variability. The structure of PC loadings (PCL) showed that the highest content of Bc was in the lower right area (PCL1: 0.55; PCL2: –0.669), corresponding to the samples ORRM and OSRS from Mexico and Spain, respectively. The samples with the highest Bx content were in the upper right area (PCL1: 0.533; PCL2: 0.742) corresponding to samples 4 (SPYM), 5 (SPRM), and 9 (SPRM) from Mexico (, ). Consequently, the samples with the highest TB were on the right-hand side (PCL1: 0.639, PCL2: –0.038) matching the samples ORRM, SPRM, and SPRM from Mexico and OSRS from Spain. The 95% CIs for low, medium, and maximum levels of Bc, Bx, and TB are shown in .
TABLE 4 Confidence intervals for the sample grouping by pigment content
FIGURE 3 A 2-dimensional plot of the principal components PC1 and PC2 for scores and loadings of principal component analysis (PCA) regarding pigment content of cactus fruits. Numbers represent the ID of a sample.
As a result, the cactus fruits can be classified as a poor, good, and excellent source of TB, Bc, or Bx if the pigment content is low, medium, or high, respectively. Eighty-three percent of the samples were within Bc and TB levels. Only 73% of the samples were consistent with the proposed Bx levels. This relatively poor matching of Bx data could be due to overestimation of this kind of pigments during their spectrophotometric analysis.[Citation31] It is likely, however, that there is a good agreement of the reported data with the proposed CIs. Only 14% of the samples were between the minimum and medium TB levels and 3% were between the medium and maximum TB levels.
According to this notion, the betalain content of red fruits of S. stellatus (Sample 3) and yellow fruits of S. pruinosus (Sample 4) from Puebla, Mexico, can be considered a good source of betalains because they are near the medium level, whereas the red fruit of S. pruinosus (Sample 5) from the same crop area can be considered an excellent source of betalains because it is near the high TB level.
CONCLUSIONS
S. stellatus fruits from Puebla, Mexico, contain bioactive compounds with antioxidant properties, which are important for human nutrition to combat oxidative stress and the related diseases. Although the four types of fruits analyzed are from the same genus, species, and production location, each cultivar has specific characteristics according to PCA analysis. Statistical analysis of TB, Bx, and Bc data for cactus fruits of several species of the genera Opuntia, Hylocereus, and Stenocereus, including those obtained in this work, allowed us to calculate CIs for the reported pigment concentration data and thereby, to classify the cactus fruits as a poor, good, or excellent pigment source. The type of cultivar is the characteristic that allowed categorizing the cactus fruits regarding their pigment content. In this case, the origin of the cultivars was not significant to classify them. According to this notion, the betalain content of red fruits of S. stellatus and yellow fruits of S. pruinosus from Puebla, Mexico, can be considered a good source of betalains. Red-pulp fruits of S. pruinosus from the same crop area can be considered an excellent source of betalains.
FUNDING
The present research was financially supported by the Instituto Politécnico Nacional (Project SIP-20141275) and Consejo Nacional de Ciencia y Tecnología (Project CB-2011-01-169779). M.G. Pérez-Loredo received a scholarship from the Consejo Nacional de Ciencia y Tecnología.
Perez-Loredo__ESM1_R1.pdf
Download PDF (55.3 KB)ACKNOWLEDGMENTS
The authors would like to thank Oscar Rene López-Mendiola for assistance with the gathering of fruits and Luis Enrique Ruíz-Molina for assistance in the identification of fruits species.
Additional information
Funding
Related Research Data
REFERENCES
- Downham, A.; Collins, P. Colouring Our Foods in the Last and Next Millennium. International Journal of Food Science and Technology 2000, 35, 5–22.
- Food and Drug Administration. Additives Approved for Use in Human Food. http://www.fda.gov/ForIndustry/ColorAdditives/ColorAdditiveInventories/ucm115641.htm (accessed July 10, 2014).
- Tsuda, S.; Murakarni, M.; Kano, K.; Taniguchi, K.; Sasaki, Y.F. DNA Damage Induced by Red Food Dyes Orally Administered to Pregnant and Male Mice. Toxicological Science 2001, 61, 92–99.
- García-Cruz, L.; Valle-Guadarrama, S.; Salinas-Moreno, Y.; Joaquín-Cruz, E. Physical, Chemical, and Antioxidant Activity Characterization of Pitaya (Stenocereus Pruinosus) Fruits. Plant Foods for Humans Nutrition 2013, 68, 403–410.
- Abeorubad, A. A Review Article on Edible Pigments Properties and Sources As Natural Biocolorants in Foodstuff and Food Industry. World Journal of Dairy & Food Sciences 2011, 6(1), 71–78.
- Liaotrakoon, W.; De Clercq, N.; Van Hoed, V.; Van de Walle, D.; Lewille, B.; Dewettinck, K. Impact of Thermal Treatment on Physicochemical, Antioxidative, and Rheological Properties of White-Flesh and Red-Flesh Dragon Fruit (Hylocereus spp.) Purees. Food Bioprocess Technology 2013, 6, 416–430.
- Haj Koubaier, H.B.; Snoussi, A.; Essaidi, I.; Moncef Chaabouni, M.; Thonart, P.; Bouzouita, N. Betalain and Phenolic Compositions, Antioxidant Activity of Tunisian Red Beet (Beta Vulgaris L. Conditiva) Roots and Stems Extracts. International Journal of Food Properties 2014, 17(9), 1934–1945.
- Khan, M.I.; Sri Harsha, P.S.C.; Giridhar, P.; Ravishankar, G.A. Pigment Identification, Nutritional Composition, Bioactivity, and In Vitro Cancer Cell Cytotoxicity of Rivina Humilis L. Berries, Potential Source of Betalains. LWT–Food Science and Technology 2012, 47, 315–323.
- Hounsome, N.; Hounsome, D.; Tomos, D.; Edwards-Jones, G. Plant Metabolites and Nutritional Quality of Vegetables. Journal of Food Science 2008, 73(4), R48–R65.
- Osorio-Esquivel, O.; Ortiz-Moreno, A.; Álvarez, V.B.; Dorantes-Álvarez, L.; Giusti, M.M. Phenolics, Betacyanins, and Antioxidant Activity in Opuntia Joconostle Fruits. Food Research International 2011, 44, 2160–2168.
- Yeddes, N.; Kalthoum Chérif, J.; Guyot, S.; Baron, A.; Trabelsi-Ayadi, M. Phenolic Profile of Tunisian Opuntia Ficus Indica Thornless Form Flowers via Chromatographic and Spectral Analysis by Reversed Phase-High Performance Liquid Chromatography-UV-Photodiode Array aAnd Electrospray Ionization-Mass Spectrometer. International Journal of Food Properties 2014, 17(4), 741–751.
- Woo, K.K.; Ngou, F.H.; Ngo, L.S.; Soong, W.K.; Tang, P.Y. Stability of Betalain Pigment from Red Dragon Fruit (Hylocereus Polyrhizus). American Journal of Food Technology 2011, 6(2), 140–148.
- Moshfeghi, N.; Mahdavi, O.; Shahhosseini, F.; Malekifar, S.; Taghizadeh, S.K. Introducing a New Natural Product from Dragon Fruit into the Market. International Journal of Research and Reviews in Applied Sciences 2013, 15(2), 269–272.
- Casas, A.; Valiente-Banuet, A.; Rojas-Martínez, A.; Dávila, P. Reproductive Biology and the Process of Domestication of the Columnar Cactus Stenocereus Stellatus in Central Mexico. American Journal of Botany 1999, 86(4), 534–542.
- García-Cruz, L.; Salinas-Moreno, Y.; Valle-Guadarrama, S. Betalains, Phenolic Compounds and Antioxidant Activity in Pitaya de Mayo (Stenocereus Griseus H.). Revista Fitotecnia Mexicana 2012, 35(5), 1–5.
- Sainani, K.L. Introduction to Principal Components Analysis. Physical Medicine and Rehabilitation 2014, 6(3), 275–278.
- Soares de Andrade, R.H.; Samara do Nascimento, L.; Elias Pereira, G.; Hallwass, F.; Silveira Paim, A.P. Anthocyanic Composition of Brazilian Red Wines and Use of HPLC-UV–Vis Associated to Chemometrics to Distinguish Wines from Different Regions. Microchemical Journal 2013, 110, 256–262.
- Koley, T.K.; Singh, S.; Khemariya, P.; Sarkar, A.; Kaur, C.; Chaurasia, S.N.; Naika, P.S. Evaluation of Bioactive Properties of Indian Carrot (Daucus carota L.): A Chemometric Approach. Food Research International 2014, 60, 76–85.
- Santos, G.J.; Barros, M.; Fernandes, P.; Pires, P.; Bardsley, R. Principal Component Analysis of Proteolytic Profiles As Markers of Authenticity of PDO Cheeses. Food Chemistry 2013, 136, 1526–1532.
- AOAC Official Methods of Analysis of Association of Official Analytical Chemistry; Helrich K. Ed.; 15th ed. Association of Official Analytical Chemists Inc.: Arlington, Virginia, USA; 1990; 1298 pp.
- Kha, T.C.; Nguyen, M.H.; Roach, P.D. Effects of Spray Drying Conditions on the Physicochemical and Antioxidant Properties of the Gac (Momordica cochinchinensis) Fruit Aril Powder. Journal of Food Engineering 2010, 98, 385–392.
- Singleton, V.L.; Orthofer, R.; Lamuela-Raventos, R.M. Analysis of Total Phenols and Other Oxidation Substrates and Antioxidants by Means of Folin-Ciocalteu Reagent. Methods in Enzymology 1999, 299, 152–178.
- Re, R.; Pellegrini, N.; Proteggente, A.; Pannala, A.; Yang, M.; Rice-Evans, C. Antioxidant Activity Applying An Improved ABTS Radical Cation Decolorization Assay. Free Radical Biology and Medicine 1999, 26, 1231–1237.
- Castellanos-Santiago, E.; Yahia, E.M. Identification and Quantification of Betalains from the Fruits of 10 Mexican Prickly Pear Cultivars by High-Performance Liquid Chromatography and Electrospray Ionization Mass Spectrometry. Journal of Agricultural and Food Chemistry 2008, 56, 5758–5764.
- Ranganna, S. Xylene Extraction Method. In: Handbook of Analysis and Quality for fruits and Vegetable Products; Ranganna, S. Ed.; 2nd ed. McGraw Hill: New Delhi, India, 1986; 107–110.
- Braga, C.M.; Zielinski, A.A.F.; Silva, K.M.D.; Souza, F.K.F.D.; Pietrowski, G.D.A.M.; Couto, M.; Granato, D.; Wosiacki, G.; Nogueira, A. Classification of Juices and Fermented Beverages Made from Unripe, Ripe, and Senescent Apples Based on the Aromatic Profile Using Chemometrics. Food Chemistry 2013, 141, 967–974.
- Kara, D. Evaluation of Trace Metal Concentrations in Some Herbs and Herbal Teas by Principal Component Analysis. Food Chemistry 2009, 114, 347–354.
- Campos-Rojas, E.; Pinedo-Espinoza, J.M.; Campos-Montiel, R.G.; Hernández-Fuentes, A.D. Evaluation of Pitaya Plants (Stenocereus spp) of Natural Populations of Monte Escobedo, Zacatecas. Revista Chapingo Serie Horticultura 2011, 17(3), 173–182.
- USDA. National Nutrient Database for Standard Reference. http://ndb.nal.usda.gov/ndb/foods (accessed July 10, 2014).
- Wanitchang, J.; Terdwongworakul, A.; Wanitchang, P.; Noypitak, S. Maturity Sorting Index of Dragon Fruit: Hylocereus Polyrhizus. Journal of Food Engineering 2010, 100, 409–416.
- Stintzing, F.C.; Schieber, A.; Carle, R. Evaluation of Colour Properties and Chemical Quality Parameters of Cactus Juices. European Food Research and Technology 2003, 216, 303–311.
- Voća, S.; Žlabur, J.S.; Dobričević, N.; Jakobek, L.; Šeruga, M.; Galić, A.; Pliestić, S. Variation in the Bioactive Compound Content at Three Ripening Stages of Strawberry Fruit. Molecules 2014, 19, 10370–10385.
- Gorinstein, S.; Arancibia-Avila, P.; Toledo, F.; Namiesnik, J.; Leontowicz, H.; Leontowicz, M.; Ham, K.S.; Kang, S.G.; Vearasilp, K.; Suhaj, M. Application of Analytical Methods for the Determination of Bioactive Compounds in Some Berries. Food Analytical Methods 2013, 6, 432–444.
- Ruiz, A.; Hermosín-Gutiérrez, I.; Mardones, C.; Vergara, C.; Herlitz, E.; Vega, M.; Dorau, C.; Winterhalter, P.; Von Baer, D. Polyphenols and Antioxidant Activity of Calafate (Berberis Microphylla) Fruits and Other Native Berries from Southern Chile. Journal of Agricultural and Food Chemistry 2010, 58, 6081–6089.
- Fernández-López, J.A.; Almela, L.; Obón, J.M.; Castellar, R. Determination of Antioxidant Constituents in Cactus Pear Fruits. Plant Foods for Human Nutrition 2010, 65, 253–259.
- Coria, C.Y.S.; Ochoa, M.J.; Nazareno, M.A. Health-Promoting Substances and Antioxidant Properties of Opuntia sp. Fruits. Changes in Bioactive-Compound Contents during Ripening Process. Food Chemistry 2011, 126, 514–519.
- Stintzing, F.C.; Herbach, K.M.; Mobhammer, M.R.; Carle, R.; Yi, W.; Sellappan, S.; Akoh, C.C.; Bunch, R.; Felker, P. Color, Betalain Pattern, and Antioxidant Properties of Cactus Pear (Opuntia spp.) Clones. Journal of Agricultural and Food Chemistry 2005, 53, 442–451.
- Wu, L.C.; Hsu, H.W.; Chen, Y.C.; Chiu, C.C.; Lin, Y.I.; Ho, J.A. Antioxidant and Antiproliferative Activities of Red Pitaya. Food Chemistry 2006, 95, 319–327.