
Abstract
The aim of this study was to examine textural complexity by developing a model food with varying levels of textural complexity but comparable nutritional density. Embedding inclusions in a gel matrix and layering the samples created different levels of structural and textural complexity: low, medium, and high. Texture properties and textural complexity were analyzed by generic quantitative descriptive analysis and modified texture profiling. The total number of unique textural descriptors observed by the panellists was used as a rudimentary measure of textural complexity and an increasing trend of textural complexity, low complexity < medium complexity < high complexity was observed. Ten unique descriptors showed significantly greater intensity ratings (p < 0.05) for the high complexity sample. This suggested that these textural attributes may be more likely to be distinguished during consumption of a high complexity sample compared to the low complexity or medium complexity samples, leading to greater perceived textural complexity in the high complexity sample.
Introduction
The sensory properties of foods play a key role in food choice decisions, the amount of food intake and eating behavior.[Citation1] The texture of a food in particular, has great leverage on acceptability and determining quality.[Citation2] Texture has been defined as “the sensory manifestation of the structure of the food and the manner in which this structure reacts to applied forces; the specific senses involved being vision, kinaesthetic, and hearing.”[Citation3] Kinaesthetic are described as “those factors of quality that the consumer evaluates with his sense of feel, especially mouthfeel.”[Citation4] The term textural complexity is associated with a range of differing texture attributes in a food that from the first bite through to the point of swallowing stimulate the senses, creating a variety of texture perceptions. Textural complexity is of great interest as a food property in its own right. However, the authors also hypothesize that the textural complexity of a food may be associated with increasing the satiation response, satiation being the process of events, which result in the termination of eating, which in turn controls the amount of food consumed. Thus, creating model foods of varying discernable textural complexities that can be used for future satiation testing is important.
Research conducted on the textural complexity of foods is scarce, although there is an increasing body of literature showing the role of food structure and texture in satiation or satiety responses. Many of which have focused on food viscosity in yogurt-based drinks and custards[Citation5–Citation8] and soup,[Citation9] for example. A clear relationship between higher viscosities, longer oral processing time, and decreased food intake or increased satiation and/or satiety has been observed in these studies.[Citation5,Citation8,Citation9]
The textural complexity of foods most likely influences the oral breakdown process during the mastication cycles and there are a number of studies concerned with the oral breakdown process of model and “real” foods such as bread,[Citation10] almonds,[Citation11] pasta,[Citation12] and singular[Citation13,Citation14] or mixed gels.[Citation15] Many investigations into oral breakdown pathways have typically used homogeneous foods to provide simple models in which physical and sensory properties can be evaluated. However, the consumption of heterogeneous foods happens on a daily basis and thus, mastication of multiple textures and structures occurs simultaneously. This is why it is of importance to study foods with textural complexity and the implication their unique nature has on oral breakdown and further processing such as satiation.
The effect of texture and sucrose spatial distribution on sweetness has been previously studied by making gelatine-agar gel samples of differing strength and sucrose content and then assembling in layers to create an inhomogeneous model.[Citation15] The key finding was that inhomogeneous sucrose distribution enhanced the perceived sweetness of the gels. There was no direct effect of texture on the sweetness ratings but an interaction between texture and homogeneity was found.[Citation15] Findings such as these suggest the potential to build textural complexity into model foods by creating an inhomogeneous matrix through layering techniques that might alter perceived texture sensations. Another way of increasing textural complexity is by embedding inclusions of differing mechanical properties, such as nuts into a gel matrix.[Citation13,Citation14]
The current study aimed to define and evaluate textural complexity by developing unique gel-based model foods of comparable nutritional properties and varying levels of textural complexity, which could be used in the future to study the hypothesised textural complexity-satiation relationship. Sensory evaluation analysis techniques were used to assess the textural complexity and intensity of the “built-in” textures.
Materials and Methods
Development of Gel-Based Model Food
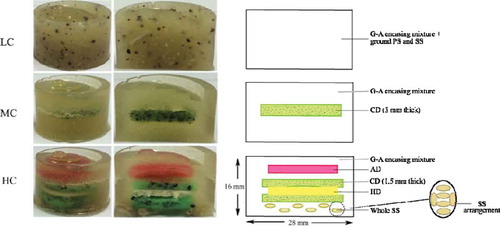
Three gel-based model foods were developed with different textural complexity using the same group of ingredients to ensure similar nutritional densities. These samples are referred to throughout this text as low complexity (LC), medium complexity (MC), and high complexity (HC). The basis of all samples was a gelatine-agar gel (G-A encasing mixture), which encased various layered inclusions, added to create different levels of textural complexity. The LC samples can be described as a homogeneous layer of gelatine and agar with a dispersion of finely ground poppy and sunflower seeds, while the MC have an embedded “chewy disc” (CD) between two layers of G-A encasing mixture. The HC samples are comprised of layers of G-A encasing mixture embedded with (top to bottom) an “agar disc” (AD), a “hard disc” (HD) sandwiched between two CD’s and a layer of whole sunflower seeds ( and ). All samples had a faint honey flavor to disguise any flavor differences between the samples.
TABLE 1 Formulation of gel-based model food samples
FIGURE 1 Photographs and diagrams of the LC, MC, and HC samples showing the layered arrangement. LC: low complexity; MC: medium complexity; HC: high complexity; G-A: gelatine-agar; CD: chewy disc; AD: agar disc; HD: hard disc; SS: sunflower seeds; PS: poppy seeds; The samples are colored for distinction of layers, they were not colored during any of the experiments referred to in this text.
Ingredients and Equipment
Gelatine (250 bloom, Gelita NZ Ltd., Christchurch, New Zealand), powdered agar-agar (Seng Huad Ltd, Thailand), white cane sugar (New Zealand Sugar Ltd., New Zealand), glucose syrup (Queen Fine Foods Pty, Queensland, Australia), gluten flour (Healtheries, Vitaco Health NZ Ltd, New Zealand), critic acid (Hansells Food Group Ltd, Auckland, New Zealand), poppy seeds (Cerebos Gregg’s Ltd., Auckland, New Zealand), and sunflower seeds (Freshlife, Scalzo Food Industries, Melbourne, Australia) were all purchased from local supermarkets. The ingredients were combined to give the nutritional profile summarised in . Honey food flavoring was obtained from Sensient Technologies Ltd., Auckland, New Zealand and AVONSET maize starch was sourced from New Zealand Starch Ltd., Auckland, New Zealand.
Flexible silicone molds were used to create the uniform shape and size of the samples. Stainless steel circular cutters were used to punch out the CD’s, AD’s, and HD’s.
Protocol for Making Gel-Based Model Foods
CD
Cold water (30 g) was added to gelatine (30 g), which was left to swell for 30 min. Glucose syrup (50 g), sugar (20 g), agar (5 g), and water (5 g) were placed in a small heavy-based pot and heated to 120°C. The mixture was cooled to 100°C and starch (2 g) was added stirring constantly for 5 min. The mixture was then cooled to 60°C and the pre-wetted gelatine was added, stirring constantly for 2 min. Additional water was added by weight to account for evaporative losses during heating. Citric acid (0.25 g) and ground poppy seeds (15 g; MC only) or whole poppy seeds (15 g; HC only) were added and the mixture was stirred constantly until all ingredients were dispersed evenly. The mixture was poured out onto a sheet of non-stick baking paper and rolled out to a uniform thickness of 3 mm (MC only) or 1.5 mm (HC only). Once cooled to room temperature, discs were cut using a stainless steel cutter (20 mm diameter) and the rounds were stored in an airtight plastic bag until use.
AD
Agar (8 g), sugar (20 g) and water (100 g) was heated until the agar and sugar had dissolved, after heating water was added to the mixture to correct for water loss during heating. The mixture was poured onto non-stick baking paper while still hot and rolled out to a thickness of 2 mm. Once cooled to room temperature, discs were cut using a stainless steel cutter (18 mm) and stored in an airtight plastic bag until use.
HD
Water (43 g) was added to gluten flour (100 g) to make a stiff dough. The dough was formed into a ball and left to rest for 20 min. The dough was rolled out into a uniform thickness using a pasta maker set to “4” (2 mm thickness). A stainless steel cutter was used to punch out 18 mm diameter discs while the dough was still soft. The discs were dried by placing them in a single layer on a mesh rack and heating in a convection oven at 70°C for 1 h. The dry diameter of the discs was approximately 14 mm and these were stored in an airtight plastic bag until use.
Gelatine-agar encasing mixture
Cold water (50 g) was added to gelatine (20 g), which was left to “swell” for 30 min. Agar (10 g), sugar (20 g), and water (50 g) was heated in a small heavy-based pot until the agar and sugar had completely dissolved, more water was added by weight after heating to account for evaporative water loss. The mixture was cooled to 60°C, and the pre-wetted gelatine was added stirring constantly while using the residual heat to melt it completely. Flavoring was added (1 mL) along with ground poppy seeds (1.7 g) and ground sunflower seeds (7.6 g; LC only) or ground sunflower seeds (7.6 g; MC only) and mixed until evenly dispersed.
Sample assembly
The LC samples were made by completely filling the silicon molds with the G-A encasing mixture (). For the MC samples, the G-A encasing mixture was poured into the mold filling half its volume. The mixture in the mold was left for 2 min at room temperature to firm slightly and a 3?mm thick CD was placed on top. The G-A encasing mixture was then poured over the top, filling the mold completely ().
The HC samples were assembled by pouring the G-A encasing mixture into the molds to ¼ the depth of the mold and left to firm slightly for 1 min at room temperature. One side of an AD was dipped in the warm G-A encasing mixture and “glued” to a 1.5 mm CD, in turn both sides of an HD were dipped in the warm G-A encasing mixture with one side being “glued” to the first CD and the other to a second 1.5 mm CD forming a “sandwich” (). This “sandwich” was placed into the mold on top of the slightly firmed G-A encasing mixture and then covered completely with warm G-A encasing mixture using a toothpick to remove any air bubbles to ensure complete coverage. Six whole sunflower seeds were placed in a pre-determined pattern () on top of the G-A encasing mixture and then the mold was filled to the top with more G-A encasing mixture.
The samples were left in the molds to set in a refrigerator for 1 h at 3°C. They were removed from the molds and stored in airtight plastic bags at room temperature until required (no longer than 4 h). Samples were made fresh for all experiments and were always stored for 1 h prior to testing in a refrigerator at 3°C and then equilibrated to room temperature for 20 min.
Sensory Evaluation
Two different types of sensory evaluation were carried out on the gel-based model food, both analyzing texture attributes. These were a generic quantitative descriptive analysis (QDA) and modified texture profiling (TP). The University of Auckland Human Participant Ethics Committee (UAHPEC) granted ethical approval for a period of 3 years to conduct the sensory evaluation. A total of 20 untrained male and female panellists were recruited from the University of Auckland. Exclusion criteria included smoking, dental surgery within the last 3 months, taking medication that affects sense of taste, low sugar diets, and allergies to ingredients.
The sensory evaluation was carried out in isolation in specialized sensory booths, with an environment controlled for noise and climate. A hatch system was used to pass the samples from the preparation area to the panelists. Each booth was equipped with a score sheet, pen, a spittoon, serviettes, and a glass of filtered water with unlimited supply. The score sheet had detailed instructions and examples for the panelists to follow which reiterated those verbally given at the beginning of the session. Panelists were instructed to rinse their mouths with water between samples and expectorate into the spittoon. The presentation of samples was randomized and panelists were allowed to resample during the trial if required. As the same panelists were used for both sensory tests, QDA was undertaken first so that the panelists were not biased in their responses when identifying texture descriptors given in the modified TP.
QDA Test Protocol
Part 1
All panellists were randomly presented three times with a LC, MC, and HC sample. They could not see the embedded inclusions in the samples as they were uncolored and the sensory booths were dimly lit. The panellists placed the whole sample in their mouth and chewed until a bolus was formed and then expectorated into a spittoon. Panellists were asked to write on their score sheet as many texture descriptors they could detect for each sample. Descriptors were tallied and all non-texture descriptors were discarded, the 12 most frequently observed descriptors were selected to proceed to the next part of the QDA.
TABLE 2 Nutrition information for LC, MC, and HC gel-based model foods
TABLE 3 Descriptors and food examples for visual intensity scales as used during modified TP
Part 2
Panellists were randomly presented three times with a LC, MC, and HC sample. They placed the whole sample in their mouth and chewed until a bolus was formed and then expectorated into a spittoon. The panellists were asked to indicate on a 10 cm line scale how they perceived each of the 12 selected attribute in terms of intensity. The end points for the scale were “not very” and “very.”
Modified TP Protocol
Part 1
Prior to assessing the samples, panellists were allowed to familiarize themselves with a lexicon of 35 textural attributes across three stages of the chewing cycle and their definitions (adapted from Lawless and Heymann,[Citation16] Gwartney et al.).[Citation17] Panellists were allowed to ask questions about definitions and also were shown visual scales of intensity for each descriptor in the lexicon using a well known food item to convey low, medium, and high intensity for each respective descriptor.
The chewing cycle was evaluated in three separate stages. For “first bite/chew” panellists placed the whole sample in their mouth bit down and expectorated into a spittoon and then chose texture descriptors from the “first bite/chew” section of the lexicon. Panellists placed the whole sample in their mouth and chewed until a bolus was formed and they wanted to swallow to evaluate “chewdown.” They expectorated the sample and chose descriptors from the “chewdown” section of the lexicon. “Residual” was evaluated by choosing descriptors from the corresponding lexicon section after the sample had been chewed to the point of swallow and expectorated.
Each time panellists were randomly presented with a LC, MC, and HC sample in triplicate. Whenever participants evaluated the sample for perceived texture attributes they could do so while referring to the supplied texture lexicon and list of definitions. The texture attributes were grouped as those occurring during “first bite/chew,” “chew-down,” and as “residual” and some texture descriptors occurred in more than one of these groups. After completion of this task, the texture attributes were tallied and the 12 most frequently observed descriptors were selected to proceed to the next stage of the modified TP. The 12 texture descriptors came from all of the stages of the chewing cycle.
Part 2
Panellists were randomly presented three times with a LC, MC and HC sample. They placed the whole sample in their mouth and chewed until a bolus was formed and then expectorated into a spittoon. They were asked to indicate on a 10 cm line scale how they perceived each selected attribute in terms of intensity. The end points for the scale were “not very” and “very.” During the session panelists were allowed to refer to the supplied texture lexicon, list of definitions, and visual intensity scales (). The visual intensity scales were necessary as terms used to describe texture can vary with language and culture.[Citation18]
Statistical Data Analysis
Microsoft Excel 2011(Microsoft Corporation, USA) was used for descriptive statistics and to create graphs. One-way analysis of variance (ANOVA) with a Tukey post-hoc test was conducted using SPSS® version 21.0 (IBM Corporation, USA), at a level of significance of p < 0.05.
Results and Discussion
Descriptor Identification: A Measure of Textural Complexity
The two different sensory tests were used to assess the texture of the gel-based model foods as both have advantages and disadvantages.[Citation16] QDA requires less panel training and as a result panellists can sometimes use different descriptors to identify the same sensory property. However, QDA does not confine panellists to a pre-determined set of texture descriptors such as with the modified TP, so potentially more descriptors can be chosen. Descriptors are also more likely to be consumer language descriptions of texture attributes compared to the modified TP, which was created using engineering principles to assess texture characteristics throughout the complete mastication cycle.[Citation16] Modified TP has the advantage of some training to get panellists within the same reference frame when describing and rating descriptors. However, as with any type of sensory evaluation using human subjects, natural differences will occur, such as the sensory perception and mastication techniques of the individual.
Results from the descriptor generation parts of both sensory tests were used to give a measure of textural complexity of the samples by tallying the number of different texture attributes identified by panellists. All non-textural descriptors were discarded and descriptors were pooled if synonymous words were used for the same descriptor. A clear trend was observed in the results gathered from the QDA with the number of descriptors observed increasing from the LC to HC samples. Although this is a crude measurement it shows that we were able to successfully increase the number of distinguishable textural attributes in the HC sample and hence, it’s perceived textural complexity (). The same trend although less obvious was observed from the data collected using modified TP with the greatest number of different textural descriptors being identified in the HC sample. Possibly the reason there is a difference between the two data collection methods is that during the modified TP, panellists had to stick within a defined set of descriptors. Although it can also be argued that with QDA panellists can be limited by their imagination or lack of exposure to a wide range of textural attributes (and thus descriptors).
It was also noted that there was a greater number of identified textural descriptors in the “chewdown” phase, observed during modified TP () for all samples. The major function of “chewdown” is to reduce particle size while creating a swallowable bolus.[Citation19] A great deal of manipulation is required to do this, including saliva lubrication, temperature adjustment, and sensory assessment.[Citation19] The first bite is generally an explorative measure and is associated with mechanical properties such as hardness, whereas “chewdown” often produces properties such as guminess, chewiness, and adhesiveness, for example.[Citation20] It can be argued that the texture attributes present in the model food in the current study are more commonly found in the “chewdown” phase and thus, is one of the reasons there is a greater number of perceived textural attributes at this stage. Also studies using sensory evaluation techniques such as temporal dominance of sensations (TDS) have shown an increase in dominant textures in the “chewdown” period and have shown patterns where certain texture attributes are only apparent during specific stages of the chewing cycle.[Citation21,Citation22] This indicates that the “chewdown” stage is of importance, first, to understand the oral breakdown process of a food and the associated perceivable textures, but also is a stage to target to increase textural complexity in foods.
The difference in the number of identified descriptors between the three samples was also greatest during the “chewdown phase.” This is a key finding as this ties in to the proposed definition of textural complexity, where a number of different perceivable textures should be noticeable throughout the entire chewing cycle, not just “first bite” or point of swallow. Thus, the multiple perceived textures in the middle of the chewing cycle suggest that the HC sample is more texturally complex than the LC or MC samples. However, there is no major difference between the LC and MC samples during the three stages of the chewing cycle, which suggests that the MC may have to be modified for future study.
Textural Intensities Between Samples
Prior to part 2 of each of the sensory evaluations, the 12 most frequently observed texture descriptors for both QDA and modified TP were selected as descriptors to be analyzed based on their intensities in the three samples. There were some similarities between those chosen during QDA and modified TP, as expected and in general the descriptors identified from the modified TP are more “sophisticated” than those from the QDA ( and ). Spider-plots were generated based on the average intensities for each of the descriptors ( and ). A one-way ANOVA was conducted on the ratings for each of the texture attributes during QDA and modified TPA (data were kept separate) to determine any significant differences between samples ().
TABLE 4 Number of different texture descriptors identified during QDA and modified TP of LC, MC, and HC model food
TABLE 5 ANOVA tables showing significant p-values for texture attributes rated during QDA and modified TP
FIGURE 2 Spider-plot showing the intensity of the selected textural descriptors obtained from A: QDA; and B: modified TP for LC, MC, and HC gel-based model food. LC: low complexity; MC: medium complexity; HC: high complexity.
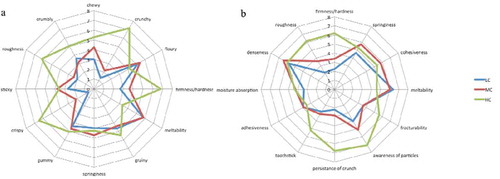
The LC and MC samples had similar intensity ratings among the selected descriptors from both the QDA and modified TP. The QDA results () showed that the HC samples had significantly greater intensity ratings (p < 0.05) than the LC and MC samples for the descriptors; firm/hard, crunchy, crispy, and rough ().
Chewiness was rated significantly more intense (p < 0.05) in the HC samples compared to the LC sample and “crumbly” had a significantly greater intensity rating (p < 0.05) for the HC sample on comparison with the MC samples ().
The difference in the descriptors “crunchy” and “crispy” can be attributed to the whole poppy seeds, whole sunflower seeds and the HD, which were not present in the LC and MC samples. The only descriptor in which the HC sample was found to be significantly less intense (p < 0.05) than the LC and MC samples was “meltability” ().
The results collected from the modified TP also show that the HC sample was rated to have a significantly greater intensity than the LC and MC samples for 6 out of 12 descriptors (p < 0.05; ). Four descriptors in total are common to both sensory evaluation methods. Of these descriptors, “firm/hard” and “roughness” were rated significantly more intense (p < 0.05) in the HC samples. These descriptors were rated 6.2 ± 1.4 and 6.2 ± 2.1 (mean out of 10 ± SD), respectively, during modified TP, which corroborates the consistency of the panellists who rated the respective intensities 6.8 ± 1.8 and 6.2 ± 1.4 during QDA indicating that the two sensory tests were producing comparable results for these attributes.
The greater firmness/hardness of the HC samples can be mostly attributed to the embedded inclusions. However, results show a significant difference in the firmness/hardness between the MC and LC samples during modified TP (p < 0.05) but not during QDA (). The G-A encasing mixture was created as a “strong” gel (20 g gelatine and 10 g agar/100 g water) which was of a greater concentration than the “strong” gelatine/agar gels used to study breakdown properties by Mosca, van de Velde[Citation15] (up to 6 g gelatine:0.8 g agar). The firmness of the gel is important as it can increase masticatory effort and thus, orosensory processing time.[Citation13,Citation14] Average QDA firmness ratings of 2.7 ± 1.9, 3.6 ± 2.0 and modified TP firmness ratings of 2.3 ± 1.0, 3.4 ± 1.4 were obtained for the LC and MC samples respectively. Mosca, van de Velde[Citation15] reported ratings using a 100 point line scale of ~20 for low strength, ~40–45 for medium strength and ~60 for their agar-gelatine gels, although a direct comparison is not possible due to formulation and sensory evaluation method differences.
The modified TP also showed that the HC sample was rated as significantly more intense for “fracturability,” “awareness of particles,” “persistence of crunch,” and “tooth stick” (p < 0.05) than the LC and MC samples (). Most likely “awareness of particles,” “persistence of crunch,” and to an extent “fracturability” can be attributed to the presence of the whole poppy seeds, whole sunflower seeds, and the HD in the HC sample. In validation of the “meltability” ratings from the QDA the HC sample was rated significantly less intense (p < 0.05) than the LC and MC samples during modified TP ().
Overall, there were seven descriptors collected from each sensory evaluation method that showed significant differences in textural attributes between the HC sample and either the LC and MC samples together or the LC or MC sample alone. Taking into account the 20 unique descriptors across both the QDA and modified TP, 11 unique descriptors showed significantly greater intensity ratings (p < 0.05) for the HC sample. This suggests that these textural attributes are probably more likely to be distinguished during consumption of a HC sample and in some cases might not be distinguished at all in the LC or MC samples leading to greater perceived textural complexity in the HC samples. The G-A encasing mixture probably also plays a role in the way the inclusions are released during chewing of the MC and HC samples and thus, may be why certain sensory properties are more intensely perceived than others. The oral breakdown process of gelatine and chocolate embedded with peanuts has previously been studied[Citation13,Citation14] with the key finding being that the gelatine matrix reduced the ease at which the particles of different sizes were detached from the matrix and relocated to the occlusion plane. Whereas, the peanuts were easily removed from the chocolate as it melted.[Citation14] The researchers hypothesized that the food matrix influenced the selection function while the embedded peanut fragments affected the “breakage function” (resistance to fragmentation). This finding can be applied to the current samples, because the firmness of the G-A matrix might also slow the release of the embedded inclusions due to the greater required masticatory effort, thus creating a longer orosensory processing time. The orosensory processing time has been identified as a key factor in decreasing food intake and increasing satiation response and/or satiety,[Citation5,Citation6,Citation8,Citation9] so it is important that any model food developed for satiation or satiety purposes has an increased orosensory processing time. This is also beneficial for a texturally complex food as there is more “time” to identify and perceive textural properties before the point of swallowing. However, during the development of the model food, careful attention was paid to ensure the LC, MC, and HC samples had similar orosensory processing times so that textural complexity is the variable studied. Further research will be conducted on the effect of textural complexity on the oral breakdown process of the samples.
Conclusions
From the preliminary findings in this study, the gel-based model foods that were developed appeared to have differing textural complexity, most notably between the HC and LC/MC samples. The ability for panellists to distinguish more textural attributes in the HC sample suggests that the G-A encasing gel might be controlling the release of the embedded inclusions over time and increasing the probability of a person to perceive different textures before the point of swallowing. There is potential for these gel-based model foods to be used for future study, first, into the mechanics of textural complexity in the oral breakdown process and then ultimately to study the hypothesized textural complexity-satiation response relationship.
Related Research Data
References
- Sorensen, L.B.; Moller, P.; Flint, A.; Martens, M.; Raben, A. Effect of Sensory Perception of Foods on Appetite and Food Intake. A Review of Studies on Humans. International Journal of Obesity and Related Metabolic Disorders 2003, 27, 1152–1166.
- Çakır, E.; Daubert, C.R.; Drake, M.A.; Vinyard, C.J.; Essick, G.; Foegeding, E.A. The Effect of Microstructure on the Sensory Perception and Textural Characteristics of Whey Protein/κ-Carrageenan Mixed Gels. Food Hydrocolloids 2012, 26, 33–43.
- Szczesniak, A.S. Texture Is a Sensory Property. Food Quality and Preference 2002, 13, 215–225.
- Kramer, A.; Twigg, B.A. Principles and Instrumentation for the Physical Measurement of Food Quality with Special Reference to Fruit and Vegetable Products. Advanced Food Research 1959, 9, 153–220.
- Mars, M.; Hogenkamp, P.S.; Gosses, A.M.; Stafleu, A.; De Graaf, C. Effect of Viscosity on Learned Satiation. Physiology and Behavior 2009, 98, 60–66.
- de Wijk, R.A.; Zijlstra, N.; Mars, M.; de Graaf, C.; Prinz, J.F. The Effects of Food Viscosity on Bite Size, Bite Effort, and Food Intake. Physiology & Behavior 2008, 95, 527–532.
- de Wijk, R.A.; Janssen, A.M.; Prinz, J.F. Oral Movements and the Perception of Semi-Solid Foods. Physiology and Behavior 2011, 104, 423–428.
- Hogenkamp, P.S.; Stafleu, A.; Mars, M.; Brunstrom, J.M.; de Graaf, C. Texture, Not Flavor, Determines Expected Satiation of Dairy Products. Appetite 2011, 57, 635–641.
- Bolhuis, D.P.; Lakemond, C.M.M.; de Wijk, R.A.; Luning, P.A.; de Graaf, C. Both Longer Oral Sensory Exposure to and Higher Intensity of Saltiness Decrease Ad Libitum Food Intake in Healthy Normal-Weight Men. The Journal of Nutrition 2011, 141, 2242–2248.
- Tournier, C.; Grass, M.; Zope, D.; Salles, C.; Bertrand, D. Characterization of Bread Breakdown During Mastication by Image Texture Analysis. Journal of Food Engineering 2012, 113, 615–622.
- Frecka, J.M.; Hollis, J.H.; Mattes, R.D. Effects of Appetite, BMI, Food Form and Flavor on Mastication: Almonds As a Test Food. European Journal of Clinical Nutrition 2008, 62, 1231–1238.
- Hoebler, C.; Karinthi, A.; Devaux, M.-F.; Guillon, F.; Gallant, D.J.G.; Bouchet, B.; Melegari, C.; Barry, J.-L. Physical and Chemical Transformations of Cereal Food During Oral Digestion in Human Subjects. British Journal of Nutrition 1998, 80, 429–436.
- Hutchings, S.C.; Foster, K.D.; Bronlund, J.E.; Lentle, R.G.; Jones, J.R.; Morgenstern, M.P. Particle Breakdown Dynamics of Heterogeneous Foods During Mastication: Peanuts Embedded Inside Different Food Matrices. Journal of Food Engineering 2012, 109, 736–744.
- Hutchings, S.C.; Foster, K.D.; Bronlund, J.E.; Lentle, R.G.; Jones, J.R.; Morgenstern, M.P. Mastication of Heterogeneous Foods: Peanuts Inside Two Different Food Matrices. Food Quality and Preference 2011, 22, 332–339.
- Mosca, A.C.; van de Velde, F.; Bult, J.H.F.; van Boekel, M.A.J.S.; Stieger, M. Effect of Gel Texture and Sucrose Spatial Distribution on Sweetness Perception. LWT–Food Science and Technology 2012, 46, 183–188.
- Lawless, H.T.; Heymann, H. Texture Evaluation. In Sensory Evaluation of Food: Principles and Practices; Heldman, D.R. Ed.; Springer: New York, NY, 2010; 259–276 pp.
- Gwartney, E.A.; Foegeding, E.A.; Larick, D.K. The Texture of Commercial Full-Fat and Reduced-Fat Cheese. Journal of Food Science 2002, 67, 812–816.
- Tunick, M.H.; Onwulata, C.I.; Thomas, A.E.; Phillips, J.G.; Mukhopadhyay, S.; Sheen, S.; Liu, C.-K.; Latona, N.; Pimentel, M.R.; Cooke, P.H. Critical Evaluation of Crispy and Crunchy Textures: A Review. International Journal of Food Properties 2012, 16, 949–963.
- Bourne, M.C. Relation Between Texture and Mastication. Journal of Texture Studies 2004, 35, 125–143.
- Brandt, M.A.; Skinner, E.Z.; Coleman, J.A. Texture Profile Method. Journal of Food Science 1963, 28, 404–409.
- Lenfant, F.; Loret, C.; Pineau, N.; Hartmann, C.; Martin, N. Perception of Oral Food Breakdown. The Concept of Sensory Trajectory. Appetite 2009, 52, 659–667.
- Rosenthal, A.J.; Share, C. Temporal Dominance of Sensations of Peanuts and Peanut Products in Relation to Hutchings and Lillford’s “Breakdown Path.” Food Quality and Preference 2014, 32, 311–316.