
Abstract
Dielectric properties of common Mexican beans (Phaseolus vulgaris L.) were determined and analyzed at microwave frequencies (800–2500 MHz). The free-space transmission technique was employed for the measurements of three varieties (“Flor de mayo,” “Bayo,” and “Negro”) with different moisture content (8.8–12.3%, w.b.) at 20, 30, 40, 50, and 60°C. The dielectric constant and loss factor of beans decreased with increasing frequency for a fixed temperature, and increased with increasing temperature at a fixed frequency. The dielectric constant increased with increasing moisture content, while the loss factor remained nearly constant. With these results, disinfestation or quality control measurements can be proposed for beans using microwaves.
INTRODUCTION
Dielectric properties are important parameters associated with electromagnetic heating, which involves radiofrequency (RF) and microwaves (MW). It is critical to know the dielectric properties of foods for process development and new RF and MW applications.[Citation1] These properties can be described by the permittivity (ε), which is a complex value defined by:
where, the real part, ε’, is the dielectric constant, and the imaginary part, ε”, is the loss factor, and j = √ - 1.[Citation2] Physically, ε’ is related to energy storing, while ε” is related to energy dissipation. High loss factor values implicate fast and intense heating when the material is subjected to RF or MW energy.
Several methods have been developed to measure the dielectric properties in crops and foods, such as parallel plates, open-ended coaxial probe, and resonant cavity.[Citation1] Recently, glucose biosensor was reported to determine the dielectric properties of juices (orange, black grape, sugarcane, and sapodilla) in the microwave range to relate their glucose concentration.[Citation3] Among the dielectric properties methods, accurate results (errors <3%) have been reported with the free space transmission technique for grains and particulate materials, considered as non-invasive and non-destructive;[Citation4,Citation5] also, the technique is suitable for low-medium loss of materials. The method operates throughout radiating fields employing two antennas, one as a transmitter and the second as a receiver.[Citation6] The sample is placed inside a cubic thin-walled cardboard container between the antennas. The thickness of the container should be at least a half of the wavelength of the used frequency
In Mexico, one of the most important crops is common bean (Phaseolus vulgaris L.). The largest diversity of beans belongs to this country, with more than 140 varieties.[Citation7] Beans, as other legumes, are an excellent source of protein: cooked beans contain more than 22% of protein.[Citation8] In order to take advantage of the nutrimental value of beans, new formulations have been investigated, such as a snack from corn and beans (“Peruano” and “Negro” from Queretaro). Researchers found that the bean variety affected the processing conditions.[Citation9] To the best of our knowledge, there are no reports about the dielectric characterization of Mexican beans at MW frequencies, which can be valuable to design new disinfestation or control quality processes. Dielectric properties of other foods have been reported at MW frequencies, as key parameters to develop new processes, such as mashed potatoes at 2450 MHz,[Citation10] and pumpable foods at 915 MHz for continuous flow microwave heating systems,[Citation11] or to determine the quality of meat pork at 2400 MHz.[Citation12] Thus, the objective of this study was to evaluate the dielectric properties of three varieties of Mexican beans in the range of microwave frequencies from 800 to 2500 MHz, which includes the punctual values of 915 and 2450 MHz. These two frequencies are allocated by the Federal Communications Commission (FCC)—United States for industrial, scientific, and medical use.[Citation13]
MATERIAL AND METHODS
Beans
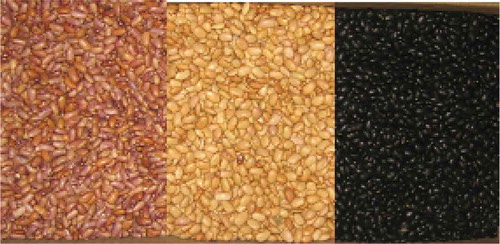
Packed raw beans (Phaseolus vulgaris L.) from three varieties: “Flor de mayo,” “Bayo,” and “Negro,” were acquired in Cholula, Puebla, Mexico (). They were harvested in the year 2014 and at the moment of the measurements, they were still fresh (2–3 months of storage). Any strange matter (small rocks), defective or damaged kernels, or beans of other varieties were removed. Part of the batch was conditioned to increase its moisture content. Beans were placed in glass jars with double bottom, holding tap water to saturate the environment; they were exposed during 18 h at room temperature.
FIGURE 1 The three varieties of Mexican beans (from left to right): “Flor de mayo,” “Bayo,” and “Negro.”
Moisture Content and Density of Beans
A sample of beans (10–12 g) was milled in a grinder (model GX410011, type F408, Krups, Mexico City), and the moisture content of 3 g was determined by duplicate following the official method 925.10,[Citation14] at 100ºC for 24 h. The bulk density was calculated dividing the weight of beans contained in a glass test tube of 500 mL;[Citation15] the determination was made by triplicate.
Antennas
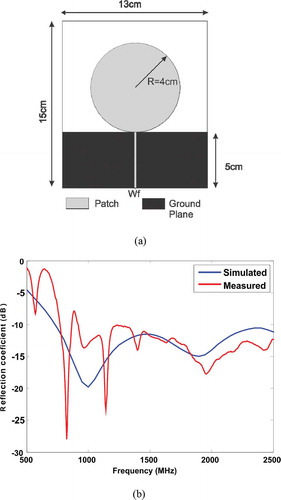
Broad monopole antennas[Citation16] were designed and manufactured for the dielectric properties measurement system in the MW range. The radius of the monopole[Citation17] was calculated using Eq. (2):
where, LF is the lowest resonant frequency of the antenna (GHz), and g is the gap between the patch and the ground plane (cm). In this case, in order to include the allocated frequency of 915 MHz, LF = 0.8 GHz and g = 0 cm, then R = 4 cm. The width of the microstrip line to feed the monopole was 2 mm. The antennas were fabricated on a 0.708 mm thick substrate (RO3003, Rogers Corporation, USA), with relative dielectric constant εr=3 and loss tangent of 0.0013. The structure of the broad band monopole antenna is depicted in . The antennas were tested by measuring the reflection coefficient. This reflection coefficient was obtained using a vector network analyzer (SPARQ-3002E, Lecroy, USA). To check the performance of the antenna, this was simulated using the HFSS software (version 13, ANSYS, USA). Simulated and measured results for the reflection coefficient of the antenna are presented in . This coefficient had values below –10 dB in the frequency range between 0.8 to 2.5 GHz, which makes it suitable for the measurements.[Citation18]
FIGURE 2 A: The designed broad band monopole antenna and B: its reflection coefficient.
Dielectric Properties Measurement System
shows the scheme for the dielectric properties measurements; the system was operated inside an anechoic chamber, in order to provide low reflection and interference environment for accurate measurements. Antennas were connected to the mentioned vector network analyzer to work from 800 to 2500 MHz. An empty cardboard container of 20 × 20 × 20 cm3 was employed for calibration; the antennas were placed in contact with the walls of the container and the transmission reflection coefficient was obtained. Then, the container was filled with around 6.7 kg of beans and the transmission coefficient was measured. The dielectric properties can be obtained with the radiant fields insertion function, by:[Citation19]
FIGURE 3 Scheme of the dielectric properties measurement system.
where, is the transmission reflection coefficient for the bean sample,
is the transmission reflection coefficient for the empty container, and f is the frequency (Hz). The dielectric constant (ε’) and loss factor (ε”) were calculated from expressions for a low loss material, with the condition
:[Citation6]
where, Δϕ is the phase of the transfer insertion function H(f) (degrees), ΔA is the attenuation in transmission due to the sample (dB), λ0 is the free-space wavelength (m), and d is the thickness of the sample (m). The transfer insertion function is sensible to the thickness of the sample. El Sabbagh[Citation6] reported different values of the dielectric properties measured with the transmission line method just with the variation of the thickness of the brick. The loss factor is more affected than the dielectric constant with the variation of the thickness. Based on previous measurements (data not shown), we determined that the brick should have a thickness of at least λ/2 (where λ is the wavelength, m) for accurate data. Calculations for Eqs. (4) and (5) were carried out in MATLAB software. Dielectric heating is associated with both ionic conduction and dipolar rotation mechanisms. Loss factor includes components from the two mechanisms, expressed as:
where, ε”σ is the loss due to ionic conduction and εd” is the loss due to dipolar rotation.[Citation2] The sensitivity of the measurement system was evaluated with a solid plastic foam with known properties. The errors were <7% for dielectric constant and <10% for loss factor, which were considered as acceptable.
For dielectric materials, electrical conductivity (σ, S/m) is also a key parameter. Given that at microwave frequencies ionic conduction is largely the dominant mechanism for grains and seeds,[Citation20] σ of beans was calculated from the loss factor, attributed to ionic conduction as:[Citation21]
where, ε0 is the permittivity of free space (F/m), and ω is the angular frequency (rad/s) equal to 2πf.
The beans temperature (initial temperature = 20°C) was increased taking the filled cardboard container and warming it up using a domestic microwave oven (1650 W, LG, Mexico). The container was heated for either 1 min or the time required to reach the target temperature (30, 40, 50, or 60ºC). The beans sample was manually mixed to get uniform temperature, which was checked with a T type thermocouple connected to a digital multimeter (DT-5808, WHDZ, China). The temperature was verified at four different points within the container, and the coefficient of variation (COV; standard deviation/mean) was calculated; COV has been employed as an index for heating uniformity: a low COV value indicates better uniformity.[Citation22] The COV (<0.06) was interpreted as the sample was uniformly heated prior to the measurements. Immediately after warming, the container was placed inside the chamber, the antennas were placed in contact with the walls, and the measurements were carried out taking five replicates. Since the whole measurement took around 30 s, it was assumed that temperature remained without variation while measuring. Also, the moisture content of the sample was determined after measurements, in order to establish if moisture loss occurred during the warming at different temperatures.
Calculation of Penetration Depth
With the results of the measured dielectric properties, the penetration depth of microwave power in the beans was calculated for the allocated frequencies of 915 and 2450 MHz at different temperatures, as reported by:[Citation23]
where, dp is the penetration depth (m), c is the speed of the light in free space (3 × 10⁸ m/s), and f is the frequency (Hz).
Statistical Analysis
Results were analyzed by analysis of variance (ANOVA) and Tukey’s pairwise comparison using the software Minitab 17 (Minitab Inc., State College, PA). Differences between means were established at the significant level of p = 0.05.
RESULTS AND DISCUSSION
Moisture Content and Bulk Density of the Beans
There were no significant changes (p > 0.05) in the moisture content of the beans before and after the warming of the sample at every target temperature (changes <0.3% w.b.). Then, moisture loss was considered as negligible due to heating for measurements at different temperatures. The average values of moisture content (8.8 to 12.3%, w.b.) and bulk density (705.2 to 757.6 kg/mCitation3) of bean samples are shown in . All the samples had adequate moisture content for handling, preservation, processing, or storage of beans, according to the Mexican Standard,[Citation24] which establishes a moisture range between 8.5 and 13% (w.b). Data for bulk density are in the range reported for beans of the Campeão-3 variety (650–850 kg/m3, depending on moisture content).[Citation25] The bulk density decreased as moisture content increased (p < 0.05); this trend was also reported for Brazilian beans[Citation25] and for coffee beans.[Citation26] The porosity of beans was not determined in the present study. Porosity for legumes has been reported between 0.44 and 0.51, when moisture content is around 5–14% and density 608–740 kg/mCitation3.[Citation27,Citation28] It is recommended to determine the porosity, as it is recognized as other important affecting factor in dielectric properties values.
TABLE 1 Bulk density of three varieties of beans at different moisture contents
Effect of Frequency and Temperature on the Dielectric Properties of Beans
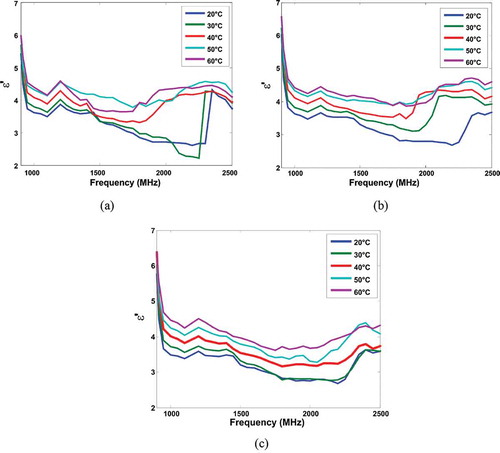
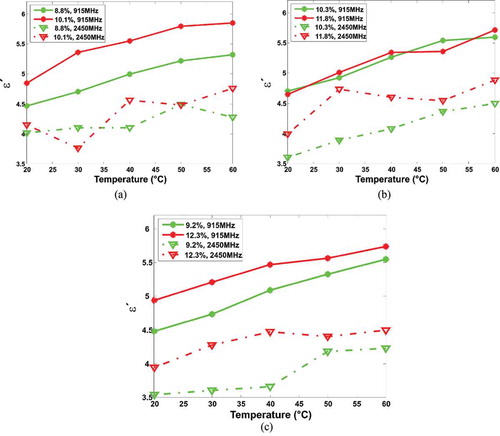
In general, dielectric constant (ε’) of beans decreased with frequency and increased with temperature, but at low temperatures, ε’ increases are achieved at higher frequency. shows this trend for the three bean varieties, with a slight increase of ε’ close to 2500 MHz. No differences between ε’ values at 50 and 60ºC for higher frequencies were detected (p > 0.05). Decreasing in both ε’ and ε” with increasing frequency was also reported by legumes, such as chickpea,[Citation29] legume flours,[Citation30] black-eyed peas, and mung beans.[Citation31]
FIGURE 4 Frequency-dependence of dielectric constant (ε’) for three bean varieties at different temperatures: A: “Flor de mayo” (8.8% of moisture content); B: “Bayo” (10.3% of moisture content); and C: “Negro” (9.2% of moisture content).
Loss factor (ε”) of beans at five temperatures and two frequencies (915 and 2450 MHz) are presented in . In general, ε” decreased with frequency and increased with temperature. The effect of temperature was lower at 2450 MHz than the observed for 915 MHz. For 60°C, the measurement system failed for samples with higher moisture content. Electrical conductivity of beans had similar behavior than ε”, with values ranging between 0.04 and 0.13 S/m, depending on variety, temperature, and frequency ().
TABLE 2 Loss factor and electrical conductivity of Mexican beans for three varieties with different moisture contents (percentage in wet basis) at different temperatures in the allocated frequencies of 915 and 2450 MHz
It is recognized that dielectric properties have a relation with the frequency. An important effect that produces change in the value of the dielectric properties, when an electromagnetic wave with fixed frequency is applied, is the polarization of the permanent dipoles of the material. At very low and very high frequencies with respect to the molecular relaxation process, the dielectric constant has constant values, and the losses are zero. At intermediate frequencies, the dielectric constant suffers dispersion, and the loss factor exhibits its maximum value at the relaxation frequency, all these effects are described by the Debye model.[Citation32] The temperature dependence is a function of the dielectric relaxation process under certain conditions and of the frequency of the electromagnetic wave. As the temperature increases, the relaxation frequency increases and the maximum value for loss factor will move to high frequencies. Otherwise, in a region of dispersion the dielectric constant increase with increasing temperature.[Citation33]
Since loss factor indicates the ability of the material to dissipate electrical energy as heat, its values are important to determine if the material is suitable to be treated under microwave energy. Moreover, more research is required to determine the dielectric properties of pests related to beans, in order to establish if they are higher than those for the beans. That would indicate the possibility to treat beans with microwave energy with the advantage of differential heating between the pest and the host (beans).
Effect of Moisture on the Dielectric Properties of Beans
The dielectric constant of beans increased with increasing moisture content in the legume (p < 0.05), shown in (average values are presented). However, this effect was less noticeable for “Flor de mayo” at 2450 MHz (), and “Bayo” at 915 MHz (p > 0.05), shown in . Dielectric constant increases with moisture content as water content increase in the sample is related to free water in the beans. An increasing behavior of in ε’ with moisture content was also reported for soybean seeds in the range from 13 to 18 GHz,[Citation5] for legume flours[Citation30] in the range from 0 to 1800 MHz, and for black-eyed peas and mung beans[Citation31] in the range from 0 to1800 MHz. With results from , new methods could be developed to estimate the moisture content of beans, as a quality control measure. The determination of dielectric constant in samples at 20ºC can be related to its moisture content, being a non destructive, and quick method. On the other hand, in Fig. 6 it can be observed that moisture content did not affect the loss factor of beans for p > 0.05, when values were compared for 915 and 2450 MHz. There is a sharp increase of the loss factor with higher temperature until 50ºC; however, for measurements at 60ºC, the values increased drastically. This can be related to a measurement failure as at high temperatures antennas could suffer dilatation and the original design would not accurately work.
FIGURE 5 Temperature-dependence of dielectric constant (ε’) for three bean varieties at different moisture contents: A: “Flor de mayo;” B: “Bayo;” and C: “Negro.”
Effect of Density and Frequency on the Dielectric Properties of Beans (Argand Diagram)
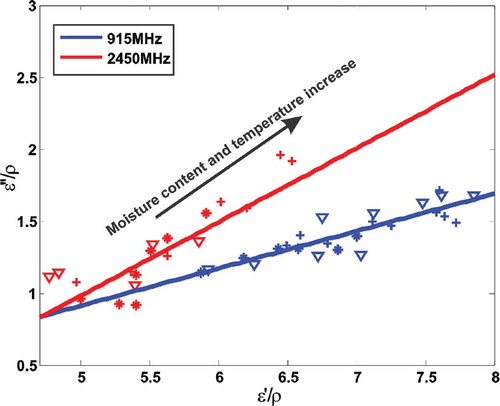
The complex-plane plot, known also as Argand diagram, can be employed for non-pure materials, where a distribution of relaxation times occurs.[Citation34] Since the density has certain effect on the interaction of the sample and the electromagnetic field,[Citation35] the plot of dielectric constant and loss factor has been shown dividing each parameter by the density of grains and legumes.[Citation30,Citation36]
The Argand diagram for the studied beans at the allocated MW frequencies (915 and 2450 MHz) is depicted in . Due to our discussion about limitations for measurements at 60ºC, the diagram was built for all the studied moisture contents of the three varieties from 20 to 50ºC. The complex relationship is linear with increasing frequency, and the slope of the straight line was higher for 2450 MHz than the observed for 915 MHz. The same trend was reported for the complex-plot for corn[Citation4] and peanuts.[Citation37] As the tendency for the three studied varieties was similar among them, the Argand diagram could be employed to estimate the density of Mexican beans based on the dielectric properties measurements, as it has been proposed for corn,[Citation4] and commented for legume samples.[Citation30]
FIGURE 6 Temperature-dependence of loss factor (ε”) for three bean varieties at different moisture contents: A: “Flor de mayo;” B: “Bayo;” and C: “Negro.”
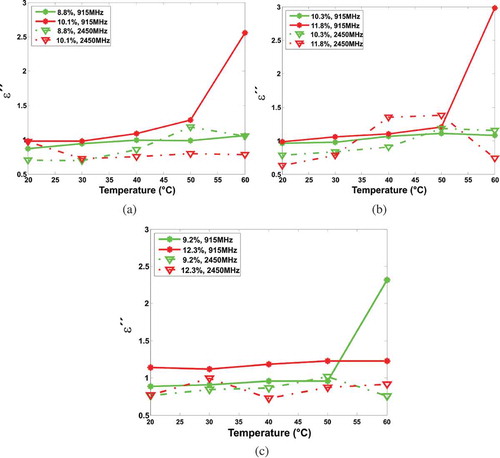
FIGURE 7 The Argand diagram for dielectric properties of three varieties of beans at the allocated frequencies for microwaves.
Penetration Depth of Microwave Power in Beans
The calculated penetration depth in beans at 915 and 2450 MHz are shown in . Power penetration is deeper at lower frequencies, being more than twice or three times deeper for 915 MHz (between 9.8 and 12.7 cm) respect to 2450 MHz (ranging from 3 to 6.21 cm). Penetration depth is useful to determine the layer for further microwave applications in beans, such as microwave-assisted drying[Citation38] or disinfestations procedures at 2450 MHz.[Citation39] With the obtained results, thin layers of beans should be employed to subject these bean varieties in microwave treatments. This practice would overcome the lack of penetration waves at these frequencies,[Citation30] and avoid the non-uniform heating during the microwave exposition.
TABLE 3 Average microwave penetration depth (cm) in beans at allocated frequencies, 915 and 2450 MHz, at different temperatures and moisture contents (percentage in wet basis)
Penetration depth in beans decreased with temperature, and there was not a defined trend respect to moisture content. The penetration depth values for common beans in this study at 915 MHz are lower than those reported for other legumes at the same frequency and temperatures, with depths from 27.1 to 54.2 cm for moisture content lower than 10.8% measured at 20ºC[Citation30] or 25 to 38 cm for moisture content <10.2%, determined at 20ºC.[Citation31]
CONCLUSION
Dielectric constant of Mexican beans was affected by frequency, temperature and moisture content in the microwave range (800–2500 MHz). Throughout the complex-plane representation involving the density of the sample, no differences among varieties were detected, which would be useful for determining moisture content and bulk density in beans. Also, further applications may be proposed, such as dielectric treatments in order to prevent pest during storage. For that, frequency of 915 MHz will have better penetration depth at 50–60ºC (target temperatures to kill insects); “Negro” (black) variety is more suitable for these treatments, followed by “Flor de Mayo,” when the moisture content is close to 10% of moisture content.
FUNDING
The authors are thankful for the financial support from CONACyT (Consejo Nacional de Ciencia y Tecnología, Mexico) for PhD studies of R. Torrealba-Meléndez and for Projects 168990 and 180061.

Additional information
Funding
REFERENCES
- Sosa-Morales, M.E.; Valerio-Junco, L.; López-Malo, A.; García, H.S. Dielectric Properties of Foods: Reported Data in the 21st Century and Their Potential Applications. LWT–Food Science and Technology 2010, 43, 1169–1179.
- Ryynänen, S. The Electromagnetic Properties of Food Materials: A Review of Basic Principles. Journal of Food Engineering 1995, 26, 409–429.
- Jafari, F.; Khalid, K.; Hassan, Y.J.; Zulkifly, A.; Salim, N.S.M. Variation of Microwave Dielectric Properties Glucose Biosensor System. International Journal of Food Properties 2015, 18, 1428–1433.
- Trabelsi, S.; Kraszweski, A.W.; Nelson, S.O. Nondestructive Microwave Characterization for Determining the Bulk Density and Moisture Content of Shelled Corn. Measurement Science and Technology 1998, 9, 1548–1556.
- Mane, V.; Puri, V. Ag Thick Film Microstripline As Nondestructive Dielectric and Moisture Sensor For Soybean. Archives of Applied Science Research 2010, 2, 286–294.
- El Sabbagh, M.A.; Ramahi, O.M.; Trabelsi, S.; Nelson, S.O.; Khan, L. Use of Microstrip Patch Antennas in Grain and Pulverized Materials Permittivity Measurement. Antennas and Propagation Society International Symposium, IEEE 2003, 4, 42–45.
- Rodríguez-Licea, G.; García-Salazar, J.A.; Rebollar-Rebollar, S.; Cruz-Contreras, A.C. Preferencias del Consumidor de Frijol (Phaseolus Vulgaris L.) en México: Factores y Características Que Influyen en la Decisión de Compra Diferenciada por Tipo y Variedad [Consumer preferences of beans (Phaseolus vulgaris L.) in Mexico: Factors and characteristics that influence purchase decision by type and variety]. Paradigma Económico 2010, 2, 121–145. (In Spanish).
- Wang, N.; Hatcher, D.W.; Tyler, R.T.; Toews, R.; Gawalko, E.J. Effect of Cooking on the Composition of Beans (Phaseolus Vulgaris L.) and Chickpeas (Cicer Arietinum L.). Food Research International 2010, 43, 589–594.
- Estrada-Girón, Y.; Martínez-Preciado, A.H.; Michel-Uribe, C.R.; Soltero, J.F.A. Characterization of Extruded Blends of Corn and Beans (Phaseolus Vulgaris) Cultivars: Peruano and Black-Querétaro under Different Extrusion Conditions. International Journal of Food Properties 2015, 18(2), 2638–2651.
- Regier, M.; Housova, J.; Hoke, K. Dielectric Properties of Mashed Potatoes. International Journal of Food Properties 2001, 4, 431–439.
- Coronel, P.; Simunovic, J.; Sandeep, K.P.; Kumar, P. Dielectric Properties of Pumpable Food Materials at 915 MHz. International Journal of Food Properties 2008, 11, 508–518.
- Ngadi, M.; Dev, S.R.S.; Raghavan, V.G.S.; Kazemi, S. Dielectric Properties of Pork Muscle. International Journal of Food Properties 2015, 18, 12–20.
- USDA (Unites States Department of Agriculture). Kinetics of Microbial Inactivation for Alternative Food Processing Technologies. Microwave and Radio Frequency Processing. http://www.fda.gov/Food/FoodScienceResearch/SafePracticesforFoodProcesses/ucm100250.htm (accessed Nov 21, 2014).
- AOAC. Official Methods of Analysis. Association of Official Analytical Chemists, 15th Ed; AOAC: Arlington, VA, 1990.
- Mohsenin, N.N. Physical Properties of Plant and Animal Materials; Gordon and Breach Science Publishers: New York, NY. 1986.
- Kataria, T.K.; Murthy, D.V.B.; Corona-Chavez, A. Compact Ultra Wide Band Antenna with Filtering Structure Using Metamaterial (MTM) and Substrate Integrated Circuit (SIC) Technologies. Proceedings of IEEE International Workshop on Antenna Technology, IWAT 09, Los Angeles, CA, March 2–4, 2009; 2009, 4 pp.
- Ray, K.P. Design Aspects of Printed Monopole Antennas for Ultra-Wide Band Applications. International Journal of Antennas and Propagation 2008, 713858, 8 pp.
- Ojha, J.R.; Peters, M. Microwave and Millimeter Wave Technologies: Modern UWB Antennas and Equipment. Chapter 3. In Patch Antennas and Microstrip Lines; Mini, I.; Ed.; Intechopen: Germany, 2010, 49–62.
- Muqaibel, A.H; Safaai-Jazi, A. A New Formulation for Characterization of Materials Based on Measured Insertion Transfer Function. IEEE Transactions on Microwave Theory and Techniques 2003, 51(8), 1946–1951.
- Nelson, S.O.; Trabelsi, S. Models for the Microwave Dielectric Properties of Grain and Seed. Transactions of the ASABE 2011, 54(2), 549–553.
- Metaxas, A.C.; Meredith, R.J. Industrial Microwave Heating; Peter Peregrinus Ltd.: London, UK, 1993.
- Geedipalli, S.S.R.; Rakesh, V.; Datta, A.K. Modeling the Heating Uniformity Contributed by a Rotating Turntable in Microwave Ovens. Journal of Food Engineering 2007, 82, 359–368.
- von Hippel, A.R. Dielectric Properties and Waves; John Wiley: New York, NY, 1954.
- NMX-FF-038-SCFI-2013. Non Industrialized Food Products for Human Consumption—Fabaseous-Beans (Phaseolus vulgaris L.)—Specifications and Test Methods. Mexican Government. http://200.77.231.100/work/normas/nmx/2010/nmx-ff-038-scfi-2013.pdf (accessed March 18, 2014).
- Berbert, P.A.; Queiroz, D.M.; Melo, E.C. Dielectric Properties of Common Bean. Biosystems Engineering 2002, 83, 449–462.
- Berbert, P.A.; Queiroz, D.M.; Sousa, E.F.; Molina, M.B.; Melo, E.C.; Faroni, L.R.D. Dielectric Properties of Parchment Coffee. Journal of Agricultural Engineering Research 2001, 80(1), 65–80.
- Konak, M.; Carman, K.; Aydin, C. Physical Properties of Chick Pea Seeds. Biosystems Engineering 2002, 82(1), 73–78.
- Haciseferogullari, H.; Gezer, I.; Bahtiyarca, Y.; Menges, H.O. Determination of Some Chemical and Physical Properties of Sakiz Faba Bean (Vicia Faba L. var. Major). Journal of Food Engineering 2003, 60, 475–479.
- Guo, W.; Tiwari, G.; Tang, J.; Wang, S. Frequency, Moisture, and Temperature Dependent Dielectric Properties of Chickpea Flour. Biosystems Engineering 2008, 101, 217–224.
- Guo, W.; Wang, S.; Tiwari, G.; Johnson, J.A.; Tang, J. Temperature and Moisture Dependent Dielectric Properties of Legumes Associated with Dielectric Heating. LWT–Food Science and Technology 2010, 43, 193–201.
- Jiao, S.; Johnson, J.A.; Tang, J.; Tiwari, G.; Wang, S. Dielectric Properties of Cowpea Weevil, Black Eyed-Peas, and Mung Beans with Respect to the Development of Radiofrequency Heat Treatments. Biosystems Engineering 2011, 108, 280–291.
- Debye, P. Polar Molecules; The Chemical Catalog, Co.: New York, NY, 1929.
- Bottcher, C.J.F.; Bordewilk, P. Theory of Electric Polarization, Vol. 11; Elsevier: Amsterdam, Holland, 1978.
- Içıer, F.; Baysal, T. Dielectric Properties of Food Materials-2: Measurement Techniques. Critical Reviews Food Science and Nutrition 2004, 44, 473–478.
- Nelson, S.O. Correlating Dielectric Properties of Solids and Particulate Samples Through Mixture Relationships. Transactions of the ASAE 1992, 35(2), 625–629.
- Trabelsi, S.; Kraszweski, A.W.; Nelson, S.O. New Calibration Technique for Microwave Moisture Sensors. IEEE Transactions on Instrumentation and Measurement 2001, 50, 877–881.
- Trabelsi, S.; Paz, A.M.; Nelson, S.O. Microwave Dielectric Method for the Rapid, Nondestructive Determination of Bulk Density and Moisture Content of Peanut Hull Pellets. Biosystems Engineering 2013, 115, 332–338.
- Malafronte, L.; Lamberti, G.; Barba, A.A.; Raaholt, B.; Holtz, E.; Ahrne, L. Combined Convective and Microwave Assisted Drying: Experiments and Modeling. Journal of Food Engineering 2012, 112, 304–312.
- Purohit, P.; Jayas, D.S.; Yadav, B.K.; Chelladurai, V.; Fields, P.G.; White, N.D.G. Microwaves to Control Callosobruchus Maculates in Stored Mung Bean (Vigna Radiata). Journal of Stored Products Research 2013, 53, 19–22.