
Abstract
The objective of this study is to develop a method for identifying and discriminating 10 potato varieties by combining machine vision and artificial neural network methods. The potato varieties include Agria, Savalan, Florida, Fontaneh, Natasha, Verona, Karso, Elody, Satina, and Emrad. A total number of 72 characteristic parameters specifying color, textural, and morphological features are found among these varieties. By using principal component analysis, 16 principal features are selected for identifying and discriminating potato varieties. The data obtained from image processing were classified using linear discriminant analysis and non-linear artificial neural network method. The accuracy of discriminant analysis were 73.3, 93.3, 73.3, 40, 73.3, 73.3, 66.7, 80, 40, and 53.3%, respectively, for the varieties used in this study. The classification accuracy was improved by 100% for all the varieties using neural network analysis and the correct classification ratio was 100% using this method. It is revealed from the results that machine vision technique and neural network analysis could identify potato varieties with acceptable accuracy.
INTRODUCTION
Identifying varieties of agricultural and horticultural crops is important at every stage of the agri-production chain.[Citation1] All those involved in crop production, plant breeders, variety registration agencies, seed producers, farmers, growers, processors, and other end-users require and benefit from variety identification and discrimination.[Citation2] In fact, variety identification is indispensable in crops marketing, for the following situations: Farmers need to know the variety of the seed they plant, to ensure the correct product is grown and harvested. Bulk handlers need to be certain of harvested varieties to ensure correct segregation for specific markets; marketers need to be confident that the products they sell meet varietal purity standards for target markets around the world.
These different activities’ requirements vary. For instance, the variety registration process (involving testing for distinctness, uniformity, and stability) requires that a description of a newly bred variety be produced and then compared to all existing varieties in common knowledge. On the contrary, farmers or processors are more likely to be interested in variety identity in a verification or quality control context. Thus, different approaches to variety identification are appropriate and important.
Studying various aspects of the potato due to its importance in people’s diet seems important. For instance, in industrial usages and particularly potato chips manufacturing, determining of potato tubers variety is important before applying them for operations like cutting, frying, etc. The amount of starch and oil for frying potatoes in different varieties is varied, which can affect the color and the product quality. According to potato experts’ comments; the determination of potato variety from tubers using the human visual system (HVS) is so difficult and associated with error, and very few people are able to identify them.
There are numerous methods for variety identification. Molecular markers may serve as a modern and suitable approach to variety identification. This approach can be faster and more cost-effective. Different molecular marker techniques were used in potato population genetics and variety identification.[Citation3] Methods are based on the amplification of DNA sequences with the polymerase chain reaction (PCR) offer advantages for identification, as they are quicker, need relatively little target DNA, avoid the use of radioactivity, require no prior knowledge of the DNA sequences of interest, and use readily commercially available materials. Random amplified polymorphic DNA (RAPD) markers are (10 nucleotide length) DNA fragments from PCR amplification of random segments of genomic DNA with single primer of arbitrary nucleotide sequence and which are able to differentiate between genetically distinct individuals, although not necessarily in a reproducible way. There has been huge interest in RAPDs for variety discrimination.[Citation4–Citation6]
One of the other methods based on molecular markers in variety identification particularly potato, is retrotransposon analyses. In fact, retrotransposons are transposable DNA elements (transposons) that employ retroviral-like reverse transcription during the processes of transposition.[Citation7] In a study, the suitability of retrotransposon-based markers for discrimination of pea varieties has been reported by Smykal.[Citation8] In addition, Novakova et al.[Citation9] did another study in concerning to potato variety identification using the same method. In this study a set of 20 of the most grown potatoes was analyzed and it was concluded that the use of retrotransposon, based markers, appears to be suitable for the differentiation of large sets of potato samples. It should be an eligible complement to other molecular markers used in potato variety identification, such as simple sequence repeats (SSR) and amplified fragment length polymorphisms (AFLP).
Most of these methods are time consuming and also require sophisticated laboratory facilities. On the contrary, computerized methods, especially image processing and machine vision, can take dimensional measurements more accurately and consistently.[Citation10] In addition, they can give an objective measure of color and morphology of the object and provide high flexibility and repeatability at relatively low cost with fairly high plant throughput with superior accuracy, while an inspector could only assess subjectively.[Citation10,Citation11] Here some applications of image processing and machine vision are mentioned in the field of variety identification of agricultural productions.
In a study, an algorithm was developed in order to classify types of oranges using an image processing technique and correlation analysis based on size.[Citation12] All the processing was done in frequency domain. The aim was to identify and determine the quality control of this product using measurement size of oranges. Finally, the amount of error was reported as 1.4% for the classification of orange varieties. Zapotoczny[Citation2,Citation13] Examined on discrimination of 11 types of wheat using image texture features. These textural features were calculated in seven channels of Red, Green, Blue, Y (luminance), and two color information (U, V) and S as absolute value (V+jU). It could be discriminated by 100% using discriminant analyses and artificial neural network (ANN). Li et al.[Citation14] used multi-spectral imaging for classification of a Chinese famous tea. Two types of multi-spectral image features were extracted, namely gray level co-occurrence matrix and wavelet transform. Then, by means of principal component analysis (PCA), the structure of the wavelet textural features was determined and finally, a classification ratio of 96.82% for different types of a Chinese famous tea using multi-class least square support vector machine, was found. Golpour et al.[Citation15] tried to identify five rice cultivars by means of developing an image processing algorithm. Thirteen color features were applied and a 96.66% classification accuracy using an optimized neural network with two hidden layers was achieved.
The objective of this research was to develop a method for identifying and discriminating potato varieties by means of machine vision and ANN. This objective was motivated by the need for highly accurate computerized method for identification of agricultural products and by the current lack of guidelines, standards, and procedures for performing machine learning. This requires an algorithm developing for analyzing color, textural, and morphological features in order to classify different types of potato tubers.
MATERIALS AND METHODS
Potato Samples
One hundred twenty potato tubers of each variety were provided from Ardabil (An Iranian north-west province) central agricultural research from 2012 harvest. Ten varieties were included Agria, Savalan, Florida, Fontaneh, Natasha, Verona, Karso, Elody, Satina, and Emrad (). The tubers were randomly selected and transferred to the testing laboratory of the school for taking images. The used process for fulfilling the aim of classification is given in the flowchart in .
FIGURE 1 Samples of 10 varieties including; (1) Agria, (2) Savalan, (3) Florida, (4) Fontaneh, (5) Natasha, (6) Verona, (7) Karso, (8) Elody, (9) Satina, and (10) Emrad.
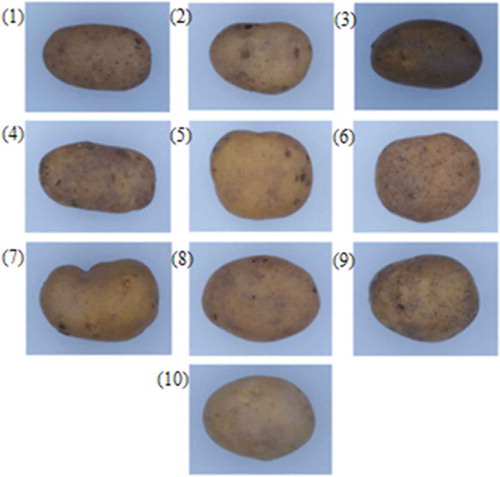
FIGURE 2 Flowchart of the image processing algorithm for classifying potato varieties.
Acquisition and Loading Image
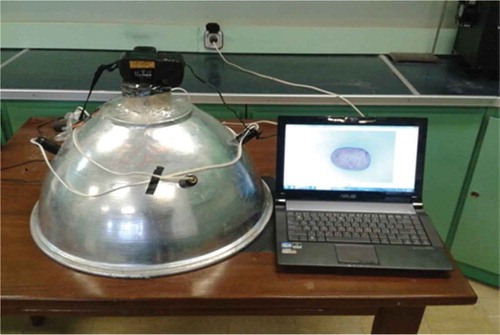
Lighting is a key and effective factor on image quality as the lighting method and light source have an impact on subsequent processes and obtained results. The image acquisition system, shown in , is a dome-shaped chamber, in which a combination of light-emitting diode (LED) light bulbs and fluorescent is used for supplying lighting condition. Three rows of bulbs with 23 LED bulbs in each row were used. The lighting chamber was made from a stainless steel sheet. Hence, the LED bulbs were fitted with an angle of 45° relative to the potatoes. Thus, in order to eliminate shade and other unwanted effects, direct lighting was avoided. The camera used in this research was a CCD camera (SONY 200) with resolution of 10.1 mega pixel and 40 mm close-up lens with focal length of 70 mm and aperture setting of 5.6 and with a wavelength range between 400 and 520 nm. The camera was set to autofocus at a distance of 31.5 cm from the camera objective to the base on which the subjects were placed and the camera was set on color image mode in which a pixel in such an image covers an area of around 0.02 mm2. A suitable lighting system allowed the potatoes to be properly recognized and analyzed. The background that was used to set the potatoes, was a Shtenbakh white board. The major advantage of this board was lack of light reflection. One image was captured for each potato tuber. These digital images were taken with resolution of 3872 × 2592 pixels under the same lighting condition and constant voltage of 12 V. Afterward, they were transferred to the permanent memory of a computer by a universal serial bus (USB) cable. Because of central processing unit limitation, the images were then converted into 968 × 648 jpeg resolution. Processing and analyzing of the images were done by image processing toolbox of MATLAB R2012 software.
FIGURE 3 Image acquisition system.
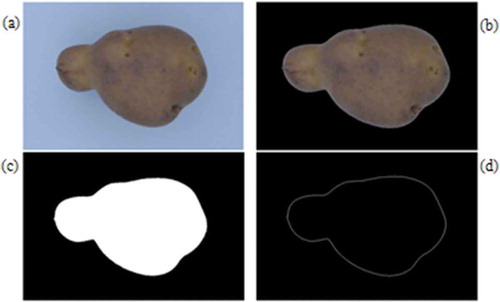
Although the image acquisition camera produced was able to capture high contrast images, in order to extract only the usable features from each image for analyzing potato varieties, some operations were needed which are called pre-processing. Because both noise and image background information are redundant, they were removed from the pre-process step. If noise and other undesired information are not removed, problems will emerge at the time of image analysis. Therefore, uniformity of background can be useful in this regard. In order to reduce noise and obtain images with uniformed backgrounds a linear Gaussian low-pass filter[Citation16] and morphological operations, such as opening, were used. The segmentation is important to such an extent that sometimes it may lead to the failure of machine vision process. Therefore, image segmentation was approached by attempting to find the boundaries among regions and use global thresholding. The pixels less than this value, belonged to the background (displayed in black pixels) and other pixels higher than it were considered as foreground (the object displayed in white pixels). Results of pre-processing and segmentation operations and the boundary or contour image of a potato are shown in .
FIGURE 4 Results of pre-processing and segmentation operations; A: original image, B: uniformed background, C: segmented image, and D: boundary of potato.
Extracting Color Features
Red, green, and blue (RGB) is an additive color space and each number represents the amount of RGB components in a color. As the mathematical distance (e.g., Euclidian, or otherwise defined by the metric of the space) between colors is not proration to the perceived difference between the colors, this color space cannot distinguish directly among color images. In addition, image processing in the RGB color space is not usually the most efficient method.[Citation17] Combinations and transformation can overcome these limitations. In other words, the classification accuracy could be improved by weighting each color component in a different way. To study effect of color features on the identification of potato varieties performance, three transformations of RGB color space were evaluated, i.e., rgb, YCbCr, and hue saturation value (HSV).
Normalized RGB (rgb)
To modify the brightness and color of a given pixel from the RGB color space, normalized values of RGB were obtained by Eq. (1). The “normalized RGB” color space was denoted by “rgb:”
where r, g, and b are the normalized values between 0 and 1.
YCbCr
YCbCr color space represents color as brightness and two color difference signals, while RGB only represents color as RGB. This means that in practical applications the YCbCr color space works well and improves system’s efficiency. The Y element represents the luminance component, and the Cb and Cr elements represent two chrominance components. The basic equations to convert between RGB components and YCbCr are as follows:
HSV
The HSV color model describes colors according to their hue, saturation, and value. Although RGB and HSV separate the image intensity from color information, this is very useful in many applications. In addition, it has some advantages, such as robustness, to lighting change, removing shadows, etc. Another reason for utilizing this color model was that it can be easily implemented. Thus, function rgb2hsv was used from the image processing toolbox for MATLAB due to calculate these components. Furthermore, mean and standard deviation of these color components were calculated. In total, 24 color features were extracted for identification ().
TABLE 1 Extracted color features of potato tubers
Extracting Texture Features
Texture is an important aspect of image. Textural features like entropy, max probability, homogeneity, uniformity, cluster shade, cluster prominence, and inertia which has been used in the study, have an important role in image analysis.[Citation18] Image texture analysis is a tool which is more powerful than direct measurement of the intensity of gray levels. It also includes statistical information in the field of image texture to the space; moreover, some texture descriptors are invariant to rotation, translation, and homogeneity which make extracting features from images and unnecessary use of complicated algorithms easier.[Citation19]
In this research, in order to describe texture of the object in the image, statistical methods were chosen. This choice was due to their simplicity and fewer complex mathematical computations. Since measures of texture only compute statistical moments of histograms, they carry no information regarding the relative position of pixels with respect to each other; this is important when describing texture. In order to solve this problem, the co-occurrence matrix was used, to incorporate this type of information into the texture-analysis process is to consider not only the distribution of intensities, but also the relative positions of pixels in an image.[Citation20] In this research, the textural features were calculated from the gray co-occurrence matrix when the direction was equal to 0° and the distance was 1, respectively, and in total, 24 texture features were extracted for identification ().
TABLE 2 Extracted texture features of potato tubers
Shape Feature Extraction
Shape is one of the major problems in potato inspection. Potato tubers contain a wide variety of shapes which are affected by the environment, in which the irregularities are seen. Incoming damage to the tuber during harvesting and transportation causes formation of different shapes. The normal form of potato tuber is spherical or rectangular with a smooth surface while the form of non-normal has more outgrowth and dips. Because the shape of some varieties of potatoes was very close to each other, the morphological features () were obtained in two separate parts: the data from dimensional descriptors such as perimeter, area roundness, etc., and those from Fourier descriptors.
In order to calculate different potato shape features (), accurate determination of area, perimeter, length, and width is absolutely essential; because the other features which were included roundness, eccentricity, elongation, aspect ratio, and extent are obtained from combination of these features. Therefore, after segmentation and obtaining a binary image with a good quality (like ), the perimeter of a potato in the segmented binary image equals the number of boundary or edge pixels. As a matter of fact, the perimeter can be measured by tracing the boundary of the potato and summing all the steps of length 1 or we have taken from and the area of the potato was estimated as the total number of white pixels in the binary image. For length and width, the Euclidean distance (ED) transform of the binary image was computed. In fact, for each pixel in binary image, the distance transform assigns a number that is the distance between that pixel and the nearest non-zero pixel of binary image which was shown in . In two-dimensions (2D), the ED between
and
was calculated by following equation:
FIGURE 5 Length and width of a sample potato extracted from binary image.
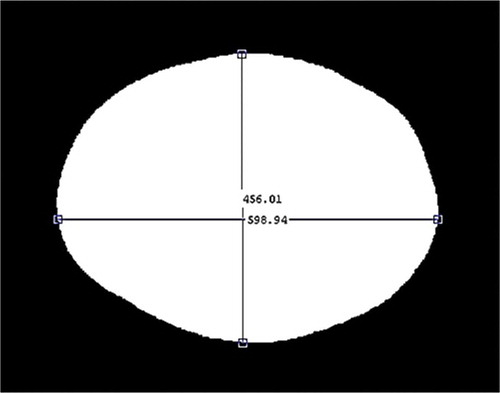
TABLE 3 Extracted morphological features of potato tubers
Fourier Descriptor
Shape descriptors of an object are often simple and effortless for brain and human vision system. In other words, computer descriptors are deterministic and quantitative; however, they are subjective for humans.[Citation21] A one-dimensional (1D) functional representation of a boundary namely signature was used. Regardless of how a signature is generated, the basic idea is to reduce the boundary representation to a 1D function that presumably is easier to describe than the original 2D boundary.[Citation22] Hence, as shown in , the radius signature r(k) was obtained from potato boundaries and starting point in the contour was determined at minimum distance of r(k) in the clockwise direction. Fourier descriptor is a common and robust technique for analysis of agri-productions shapes. Therefore, after obtaining the radius signature it was transferred into Fourier domain for calculating coefficients as Fourier descriptors of the boundary. In order to analysis of potato shapes, fast Fourier transform of r(k) was calculated using Eq. (4).
FIGURE 6 A: External boundary of a potato with its centroid point, B: 1-D corresponding boundary signature.
where N is the number of pixels in the boundary. The inverse Fourier transform of these coefficients restores r(k) that is, from Eq. (5):
We know from discussions of the Fourier transform that instead of all the Fourier coefficients, only the first p-coefficients are used. This is equivalent to setting = 0 for
in Eq. (5). The result is the following approximation to r(k):
Although only p-terms were used to obtain each of , k still ranges from 1 to
). That is the same number of points exists in the approximate boundary, but not as many terms were used in the reconstruction of each point.[Citation20] In this research, it was found that the p-value was equal to 10, which means the first 10 harmonics could describe the shape of potato tubers.
For extracting effective shape information, a method of harmonics multiplied by its magnitude was established to provide an effective heuristic. This method offered two significant advantages and concepts. First, it can be proven that the operation of
in the frequency domain was equivalent to the Fourier transform of r(k)’s derivative in the spatial domain.
Second, h in (h × F (h) provides a weight to enhance high frequency components, i.e., the relatively small curve changes along the potato boundary so that low and high frequencies could be compared at the same scale. This concept is very useful in the definition of shape separator. A separator S was defined for the degree of shape irregularity:
Selecting Effective Features
In order to reduce size of the input vector into classifier and select the features that had more effect on classification, statistical method of PCA was used. This method of variable selection was operated in an iterative manner for systematically removing color, shape, and texture parameters whose F-statistics are smaller than F-to-remove, and, retaining those parameters whose F-statistics are greater than F-to-enter values. For this analysis, a level of significance of α = 0.05 was applied and a threshold F-value of 0.15 was used both for inclusion and excluding parameters from the model. The advantage of PCA as an optimal linear transform is in maintenance of subspace that has the highest variance so that, it can compress spectral data into a group of new orthogonal variables with much low dimension, through computing a linear projection of the spectral data Kara and Dirgenali.[Citation22] The final selected features to use in classification are given in .
TABLE 4 The top 16 selected color, textural, and morphological features for recognizing the 10 varieties of potatoes using stepwise discrimination (STEPDIS procedure of SPSS)
Classification Models
Discriminant analysis (DA)
If are the predictor variables and
is dependent variable and of categorical type (quantitative or ordinal), the purpose of the DA is to find linear function such as:
as the probability of,
is maximized. When the dependent variable has the number of g different values, the goal is to attribute new observations of variables to do one of g groups based on a detection function.
ANN
A neural network is a powerful data modeling tool that is able to capture and represent complex input/output relationships. In the present study, a multi-layer perceptron (MLP) neural network was built for potato identification. This type of neural network is known as a supervised network because it requires a desired output for learning. The goal of this type of network was to create a model that correctly maps the input to the output using historical data so that the model can be used to produce the output when the desired output is unknown. In general, setting too few hidden units cause high training errors and high generalization errors due to under-fitting, while too many hidden units result in low training errors but still high generalization errors due to over-fitting.[Citation23] However, determination of number of hidden layer neurons largely depends on trial-and-error method. In this research, the method proposed by Li et al.[Citation18] was used, in which the number of hidden layer neurons was initially calculated by Eq. (10).
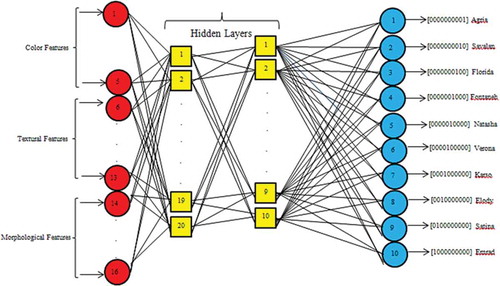
where m is number of output neurons and represents the potato varieties, n is number of input neurons and equals the number of used input features, and h is the number of hidden neurons. Finally, a neural network was designed with 16-20-10-10 structure, in which 16 neurons were for the input layer, 20 and 10 neurons were for the middle layers, respectively, and 10 neurons were in the output layer. Also, 75% of the whole data allocated for training and 25% of data set allocated for test.
Processing inside neurons is determined by activation function. In this work, the tansig function was used; moreover, trainlm function was used to train the network and updating the weights and bias values according to Levenberg-Marquardt optimization. This function is often the fastest backpropagation algorithm in the toolbox and is highly recommended as a first-choice supervised algorithm; however, it requires more memory space comparing with other algorithms. In this study, neural networks were designed, trained, and tested using MATLAB neural network toolbox.
The output of each class was coded in a binary form. The advantage of this type of coding is having same values and similar errors. That is, if an error occurs, the network considers size of the error values to be equal. For example, having this coding, the error resulting from the first class of data in the second class is equal to the error resulting from standing the first class data in the tenth class and neural network does not consider any difference between them. shows structure of the neural network.
FIGURE 7 Topology of ANN for classification system of potato.
In order to evaluate performance of ANN, a matrix known as confusion matrix in size of the number of classes (10 × 10) was used. The more diagonal the matrix, the more efficient the classification tools would be. In other words, all the ith class data were located in their own classes. Finally, network performance was represented by a number called correct classification ratio (CCR). This number was equal to the ratio of the number of correct classifications to the total number of classifications.
RESULT AND DISCUSSION
Selecting Effective Parameters by Stepwise PCA
Stepwise DA was applied to identify a subset of dominant color, texture, and shape parameters that most distinguish potato varieties. The summary of texture variable selection by PCA is presented in . At the beginning of the test, all 24 parameters were involved in the model, and in every step one variable was removed according to its Wilks’ Lambda and p-value. It could be seen that the model kept only eight parameters as the most effective textural features.
TABLE 5 Summary of texture parameters selection by stepwise PCA analysis
DA Classifier
After identifying the most important color, shape, and texture parameters for characterizing potato varieties, the DA model created classification functions. Results of the classification of potato varieties using DA method are given in . The average of the correct classification accuracy of DA classifier was obtained as 66.7%. This value is low and indicates the fact that needs a robust classifier for identifying potato varieties with high accuracy. As can be observed, two samples of Savalan variety were falsely judged as Agria variety, while 18 samples of Fontane and Satina variety were wrongly discriminated as other varieties. Hence, the highest classification accuracy belonged to class 2 (Savalan) and lowest value was related to class 4 and 9 (Fontaneh and Satina varieties) and this was reasonable because only these two classes were very similar to each other from color and textural aspect. In addition, it was found that there is no linear relation between the features of these two classes with the other classes, while the quantified extracted features from class 2 have significant difference compared with the other classes and a linear classifier like DA can separate it with relatively good accuracy from other groups. Therefore, it can be concluded that DA was a linear method and the value derived from accuracy of this method indicated the fact that there was a linear relationship between different varieties of potatoes in terms of various characteristics such as color, texture, and tuber shape. In other words, to achieve a high separation ratio, non-linear classifiers, such as ANN, was required.
TABLE 6 Values of classification accuracy of DA method when testing
Classification by ANN
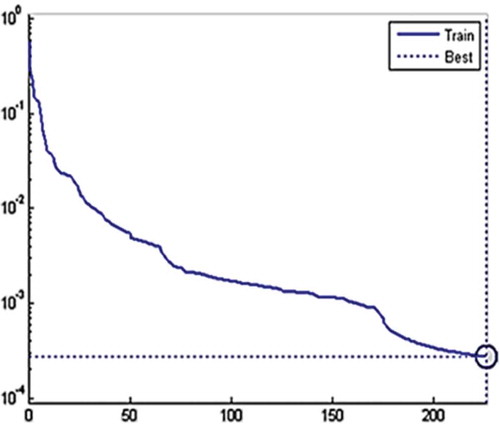
After training and validation, the neural network was able to gain minimum error in 226 iterations. As shown in , the number of low epoch rather than default properties of the network which was 1000 iteration demonstrated the sufficient learning speed and the network convergence toward the goal that was correct classification of varieties. Since a non-linear problem (potato varieties classification) occurred, a optimization algorithm was brought which will match itself with non-linear nature of the problem. The Levenberg-Marquardt method is a standard technique used to solve non-linear least squares problems. Non-linear least squares problems (like the current problem) arise when the function is not linear in the parameters. As our parameters were far from their optimal value, the mentioned algorithm was a good choice for learning and updating parameters in the direction of the greatest reduction of the least squares objective.
FIGURE 8 Learning curve by Levenberg-Marquardt learning pattern for epoch 226.
CCR of potato varieties by MLP neural network with 16-20-10-10 structure was obtained as 100%. One reason for higher recognition accuracy of the ANN comparing with DA approach can be found in non-linearity of this classifier. This result is reasonable, because all potato varieties were close to each other in terms of three traits including color, texture, and shape. Therefore, these varieties cannot be expected to be separated with high accuracy by a linear classification. The other reason for achieving the success rate classification accuracy was the structure of the neural network topology. In fact, applying two hidden layers than one layer which is common for ANN in pattern recognition problems, had great impact on potato variety classification, so that 82.41% accuracy was obtained using only one hidden layer (16-10-10) in network and this is a significant difference compared 100% accuracy.
Irregularity Determination
Although samples had been selected randomly in which there was regular and irregular potatoes in each variety group, but the vision system was able to detect irregular potatoes. Despite the aim of this study was not to identify the irregularity of potatoes, we were able to determine the shape of potatoes using Fourier descriptors and dimensional parameters. In other words, for all potatoes, without considering their variety, four shape features (roundness, elongation, extent, and eccentricity) and three Fourier descriptors were found to be effective in sorting regular and irregular potatoes. Finally, the developed vision system was able to achieve 96.1% of accuracy in detecting the regularity of potato tubers depending on the DA.
One of the cases that should be noticed was about invariance to size, rotation, and scale of the images. Although images were taken in a controlled environment, there are some features in which are not invariant to rotation or scale changes especially about textural features that we used co-occurrence matrix method for extracting these features. Briefly, problems associated with the co-occurrence matrix were:
They require a great deal of computation (many matrices to be computed).
Features are not invariant to rotation or scale changes in the texture.
Computer-based methods are a novel group of approaches not yet widely used in potato variety identification. The machine vision techniques and neural network were used in this method. It was found that different potato varieties could be identified and classified with a very high accuracy level using triple features of color, textural, and morphological characteristics extracted by machine vision and use of a non-linear classifier ANN. The results indicated effectiveness of artificial intelligence like machine vision in identification of cultivars and horticultural crops, which can have a wide application in the food industry in order to achieve the objectives of automation. Furthermore, another result of this study shows that the textural features had a key role in determining potato varieties from the tuber surface because half of the final features were included texture features and this issue can be considered in further studies.
ACKNOWLEDGMENTS
The authors are grateful to the Center of Ardabil Agricultural Research (CAAR), especially Dr. Hasanpanah and En. Hasanifor their assistance in this scientific research.

References
- Cooke, J.R. The Reasons for Variety Identification. In Identification of Food Grain Varieties Potato Research; Wrigley, C.W.; Ed.; AACC: Saint Paul, MN, USA, 1995a, 1–18.
- Zapotoczny, P. Discrimination of Wheat Grain Varieties Using Image Analysis and Multidimensional Analysis Texture of Grain Mass. International Journal of Food Properties 2014, 17, 139–151.
- Gebhardt, C.; Ballvora, A.; Walkenmeier, B.; Oberhagemann, P.; Schiller, K. Assessing Genetic Potential in Germplasm Collections of Crop Plants by Marker-Trait Association: A Case Study for Potatoes with Quantitative Variation of Resistance to Late Blight and Maturity Type. Molecular Breeding 1994, 13, 93–102.
- Sosinski, B.; Douches, D.S. Using Polymerase Chain Reaction-Based DNA Amplification to Fingerprint North American Potato Cultivars. HortScience 1996, 31, 130–133.
- McGregor, C.E.; Lambert, C.A.; Greyling, M.M.; Louw, J.H.; Warnich, L. A Comparative Assessment of DNA Fingerprinting Techniques (RAPD, ISSR, AFLP, and SSR) in Tetraploid Potato (Solanumtuberosum L.) Germplasm. Euphytica 2000, 113, 135–144.
- Chakrabarti, S.K.; Pattanayak, D.; Sarmat, D.; Chimote, V.P.; Naik, P.S. Stability of RAPD Fingerprints in Potato: Effect of Source Tissue and Primers. Biologia Plantarum 2006, 50, 531–536.
- Kumar, A.; Hirochika, H. Applications of Retrotransposons As Genetic Tools in Plant Biology. Trends in Plant Sciences 2001, 6, 127–134.
- Smykal, P. Development of An Efficient Retrotransposon-Based Fingerprinting Method for Rapid Pea Variety Identification. Journal of Applied Genetics 2006, 47, 221–230.
- Novakova, A.; Simacova, K.; Barta, J.; Curn, V. Potato Variety Identification by Molecular Markers Based on Retrotransposon Analyses. Plant Breed 2009, 45(1), 1–10.
- Vivek Venkatesh, G.; Iqbal, S. Md.; Ganesan, D. Estimation of Volume and Mass of Axi-Symmetric Fruits Using Image Processing Technique 2015, 18, 608–626.
- Sylla, C. Experimental Investigation of Human and Machine-Vision Arrangements in Inspection Tasks. Control Engineering Practice 2002, 10(3), 347–361.
- Cruvinel, P.E.; Minatel, E.R. Image Processing in Automated Pattern Classification of Oranges; World Congress of Computers in Agriculture and Natural Resources: Iguacu Falls, Brazil, 2002.
- Zapotoczny, P. Discrimination of Wheat Grain Varieties Using Image Analysis and Neural Networks. Part I. Single Kernel Texture. Journal of Cereal Science 2011, 54, 60–68.
- Li, X.; Nie, P.; Qiu, Z.J.; He, Y. Using Wavelet Transform and Multi-Class Least Square Support Vector Machine in Multi-Spectral Imaging Classification of Chinese Famous Tea. Expert Systems with Application 2011, 38, 11149–11159.
- Golpour, I.; Amiri Parian, J.; Amiri Ghayjan, R. Identification and Classification of Bulk Paddy, Brown, and White Rice Cultivars with Colour Features Extraction Using Image Analysis and Neural Network. Journal of Food Science 2014, 32(3), 280–287.
- Castleman, K. Digital Image Processing; Prentice-Hall: Englewood Cliffs, NJ, 1996; 667 p.
- Chen, X.; Xun, Y.; Li, W.; Zhang, J. Combining Discriminant Analysis and Neural Networks for Corn Variety Identification. Computer and Electronics in Agriculture 2010, 71, 48–53.
- Li, J.; Tan, J.; Martz, F.A.; Haymann, H. Image Texture Features As Indicators of Beef Tenderness. Meat Science 1999, 53, 17–22.
- Park, B.; Chen, Y.R. Co-Occurrence Matrix Texture Features of Multi-Spectral Images on Poultry Carcasses. Journal of Agricultural Engineering Research 2001, 78(2), 127–139.
- Gonzalez, R.C.; Woods, R.E. Digital Image Processing; Pearson Education, Inc.: Upper Saddle River, NJ, 2008; 808–819.
- Ying, Y.; Jing, H.; Tao, Y.; Zhang, N. Detecting Stem and Shape of Pears Using Fourier Transformation and An Artificial Neural Network. Information and Electrical Technologies Division of the ASAE 2002, 46(1), 157–162.
- Kara, S.; Dirgenali, F. A System to Diagnose Atherosclerosis Via Wavelet Transforms, Principal Component Analysis and Artificial Neural Networks. Expert Systems with Applications 2007, 32, 632–640.
- Duda, R.O.; Hart, E.P.; Stork, G.D. Pattern Classification; John Wiley & Sons, Inc.: New York, NY, 2001.
APPENDIX
Table