
Abstract
Avocado oil is one of the functional oils having high quality and high price in the market. This oil shows many benefits for the human health and is applied in many cosmetic products. The authentication of avocado oil becomes very important due to the possible adulteration of avocado oil with other lower priced oils, such as palm oil and canola oil. In this study, Fourier transform infrared spectroscopy using attenuated total reflectance in combination with chemometrics techniques of partial least squares and principal component regression is implemented to construct the quantification and classification models of palm oil and canola oil in avocado oil. Partial least squares at the wavenumbers region of 1260–900 cm–1 revealed the best calibration models, having the highest coefficient of determination (R2 = 0.999) and the lowest root mean square error of calibration, 0.80%, and comparatively low root mean square error of prediction, 0.79%, for analysis of avocado oil in the mixture with palm oil. Meanwhile, the highest R2, root mean square error of calibration, and root mean square error of prediction values obtained for avocado oil in the mixture with canola oil at frequency region of 3025–2850 and 1260–900 cm–1 were 0.9995, 0.83, and 0.64%, respectively.
INTRODUCTION
Avocado is one of the valuable fruits, as it is rich in nutrients, high in proteins, antioxidants, and dietary fiber.[Citation1] The quality of fruits are determined by various factors, like variety or cultivar, growth conditions, and harvesting time. From a nutritional point of view, avocado is important because of the high caloric fruit. The high content of unsaturated fatty acids is one of its main characteristics. Moreover, avocado is rich in vitamin E, ascorbic acid, vitamin B6, β-carotene, and potassium.[Citation2] The mesocarp of avocado fruit (avocado pulp) contains an approximately of 8–30% oil, depending on the variety and the growth conditions.[Citation3] The fleshy pulp of avocado provides a high-quality oil. Avocado oil (AO) contains high levels of oleic acid and palmitic acid.[Citation4] AO offers many beneficial effects on human health. There is a report that AO can help to reduce plasma cholesterol because of its high unsaturated fats and phytosterols.[Citation5] The oil also helps to reduce triglyceride content in the blood. AO has also been suggested for direct human consumption in diets designed to reduce cardiovascular diseases.[Citation6]
The adulteration of high value oils is a serious commercial problem in the trade of fats and oils for a long time, because there is a great difference in price for different oil products.[Citation7] AO has relatively high price, so there is always a possibility that illegal practices may occur, such as dilution with cheaper oils, like palm oil (PO), canola oil (CaO), sunflower oil, corn oil, etc. For this reason, it is important to control the quality of AO to prevent fraud and to guarantee its originality and quality from adulteration.[Citation8] Many analytical techniques can be used to discriminate among different oils as well as to detect the adulteration. Fourier transform infrared (FTIR) spectroscopy has ability to serve as a “fingerprint technique,” meaning that there are no two samples having the same infrared (IR) spectra either in the number of peaks or in the peak intensities.[Citation9] For these reasons, FTIR spectroscopy can be taken into account as an ideal instrumental method for the authenticity studies of edible fats and oils.[Citation10,Citation11]
FTIR spectroscopy was typically combined with multivariate calibration approaches to analyze the level of adulterants.[Citation12] The most common multivariate calibrations used for quantitative analysis are partial least squares (PLS) and principal component regression (PCR). Both of these methods are based on data reduction and inverse calibration, where there is a possibility to calibrate for the desired component while implicitly modeling the other source of variation.[Citation13] FTIR spectroscopy combined with chemometrics has been used to detect and quantify oil adulterants, such as corn oil and sunflower oil in virgin coconut oil,[Citation14] soybean oil in camellia oil,[Citation15] corn oil in sesame oil,[Citation16] as well as sesame oil in olive oil.[Citation17] Moreover, FTIR spectroscopy is also used for the authentication of black seed oil[Citation18] and extra virgin olive oil.[Citation19] The present study highlights the application of FTIR spectroscopy for quantification PO and CaO as oil adulterants in AO using multivariate calibration (PLS and PCR).
MATERIAL AND METHODS
Avocado fruits were taken from Bantul, Jogjakarta. The selected vegetable oils, namely PO and CaO, were purchased from the local market around Universitas Gadjah Mada, Jogjakarta, Indonesia.
Extraction of AO
Avocado was extracted from pulp. Avocado mesocarp was sliced to about 3–5 cm and then dried under sun light (34°C). The dried pulp, called simplisia, was then processed and finely ground and then percolated with n-hexane (1:10). The n-hexane flow rate was controlled to 1 mL/min (20 drops/min). Then, the n-hexane is evaporated to separate the oil using rotary evaporator (its water bath set at 70°C), the oil is recuperated from hexane. The oil were kept in oven at 100°C until constant weight and finally stored in desicator at 20°C for further analysis.
Preparation of Calibration and Validation Samples
Twenty-five calibration samples consisting of AO and vegetable oils (PO and CaO) in binary mixtures (concentration ranging from 0–100% [v/v]) were prepared. For validation or prediction, 15 independent samples were used. The final volume of each sample was 2 mL. Pure AO and vegetable oils, as well as their blends, were analyzed using a FTIR spectrophotometer.
FTIR Instrumental Analysis
FTIR spectrophotometer (ABB 3000, Canada) equipped with a deuterated triglycine sulphate (DTGS) detector and a KBr/germanium as beam splitter, interfaced to a computer having Windows operating system and Horizon MB software, was used for FTIR spectra acquisition. A few drops of each sample were positioned in contact with attenuated total reflectance (ATR) on a multi-bounce plate of ZnSe crystal. All FTIR spectra were recorded from 4000 to 650 cm–1, co-adding 32 interferograms at a resolution of 8 cm–1. These spectra were subtracted against background air spectrum. The ATR plate was carefully cleaned in situ by scrubbing with hexane twice followed by acetone before filling in with the next sample. These spectra were recorded as absorbance values at each data point. The sample measurements were replicated two times.
Data Analysis
The software Horizon MB 3000 was used to construct data analysis, including PLS and PCR for quantification. FTIR spectral regions offering the highest values of coefficient of determination (R2) and the lowest values of root mean square error of calibration (RMSEC) were selected for developing PLS and PCR calibration models. The calibration models were further used to predict the level of oil adulterants in the prediction samples. The values of R2 and root mean square error of prediction (RMSEP) were used for prediction criteria.
RESULT AND DISCUSSION
FTIR Spectra Analysis
Chemically, fats and oils are esters from glycerol with three fatty acids. Some of the fats and oils have quite similar physico-chemical composition, therefore, the adulterated fats and oils are difficult to detect physically.[Citation11] Due to its capability of the fingerprint technique, FTIR spectroscopy in the region 4000–400 cm–1 allows one to differentiate authentic oils from those of adulterated ones by observing the spectra changes.[Citation20] exhibits FTIR spectra of AO, PO, and CaO at frequency region of 4000–650 cm−1. The assignment of functional groups for IR absorption is as follows: 3012 cm–1 (cis = C-H stretch), 2922 and 2856 (asymmetrical and symmetrical stretching of –CH2), 1742 (C=O stretching), 1715 (C=O ester stretching), 1461 (-CH2 bending), 1418 (cis C=H bending), 1378 (-CH3 bending), 1238 (-C-O stretch), 1165 (-C-O stretch; -CH2 bending), 1115 (-C-H bending), 1098 (-C-O stretch), 971 (trans –CH=CH- bending out of plane), 908 (=CH2 wagging), 844 (=CH2 wagging), and 721 (cis –CH=CH- bending out of plane).[Citation21,Citation22]
FIGURE 1 FTIR spectra of avocado oil (AO), canola oil (CaO), and palm oil (PO) at mid-infrared regions (4000–650 cm–1).
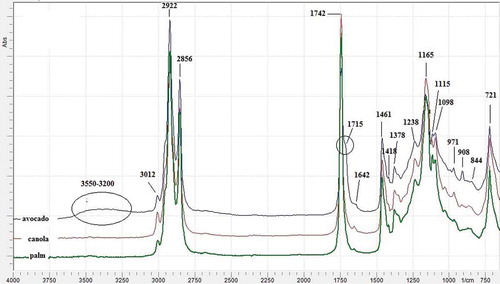
Taking in to account the spectra, it can be seen that AO has two main differences with PO and CaO. First, in spectra region of 3500–3250 cm–1, there is a band in AO, attributable to to OH group of free fatty acid and phytosterols including β-sitosterol and campesterols.[Citation23] This band cannot be ascribed to water because the preparing process of AO is free from water and further it has been treated with anhydrous sodium sulphate to remove the residual water. The second difference appears in carbonyl absorption band; AO posses two peaks in carbonyl regions, namely at 1742 and 1715 cm−1 (C=O ester stretching), whereas in PO and CaO, there is only one peak at 1742 cm–1.
Quantification of Adulterants
Quantification of PO and CaO as oil adulterants in AO was performed using multivariate calibration of PLS and PCR. PLS and PCR are factor analysis where the spectral and concentration data are incorporated into the model in one step.[Citation24,Citation25] The AO–PO samples were separated into the calibration and the prediction sets. Three spectra regions were chosen for developing PLS and PCR regressions, they are 1260–900, 1795–1600, and 3025–2850 cm–1. The results obtained from the PLS and PCR calibrations in terms of R2, RMSEC, and RMSEP either for normal spectra and its derivatives (first derivative and second derivative) for authentication study of AO, either with PO or CaO are presented in and , respectively. Resolution is enhanced in the first derivative, since the changes in the gradient are examined. The second derivative gives a negative peak for each band and shoulder in the absorption spectrum. However, derivation treatments can strongly affect the sensitivity of measurements. As a consequence, the use of derivative FTIR spectra should be avoided if the concentration of adulterants is very low.[Citation26]
TABLE 1 Multivariate calibrations for determining palm oil in avocado oil using PLS and PCR techniques*
TABLE 2 Multivariate calibrations for determining canola oil in avocado oil using PLS and PCR techniques*
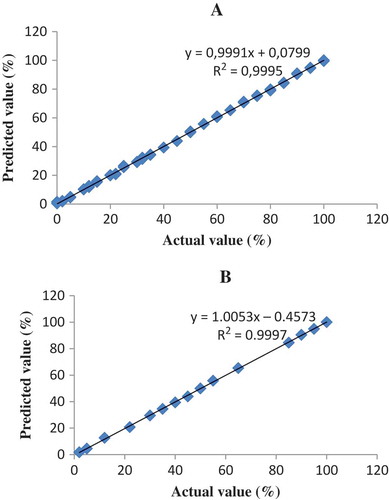
From the result, it can be shown that PLS calibration technique at frequency of 1260–900 cm–1 offer the better model than others, in terms of the highest value of R2 (0.9996) and the lowest value of RMSEC (0.80%) and RMSEP (0.79%) for the relationship between the actual value (x-axis) and the FTIR predicted (y-axis) value of PO contents with the equation of y = 0.9999; x = 0,0164. shows the PLS calibration model of PO in AO. PLS calibration technique at frequency region of 3025–2850 and 1260–900 cm–1 using first derivative spectra is chosen to quantify CaO in the binary mixtures with AO. This PLS model reveals the highest value of R2 (0.9995) and the lowest value of RMSEC (0.83%) and RMSEP (%) with the equation of y = 0.9991; x = 0.0799. shows the PLS calibration model of CaO in AO.
FIGURE 2 The relationship between actual and FTIR predicted values of AO adulterated with PO using normal spectra at 1260–900 cm–1 for A: calibration model; and B: validation model.
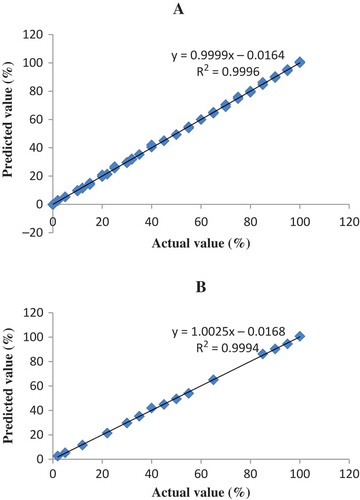
FIGURE 3 The relationship between actual and FTIR predicted values of AO adulterated with CaO using normal spectra at 1260–900 cm–1 for A: calibration model; and B: validation model.
PLS and PCR models are commonly called “factor methods” because these transform the high number of original variables into a smaller number of orthogonal variables called “factors” or “principal components” (PCs), which are linear combinations of the original variables. The first PCs contain more useful information, whereas the last ones represent the noise, which have to be unnecessary and not taken into account in the PLS and PCR models.[Citation27] The number of factors used for making PLS and PCR model was also included in and . The optimum number of factors selected for calibration was automatically optimized by the software based on the predicted residual sum of squares (PRESS). The factor that has minimum PRESS value was chosen for building the calibration model. The selection of number of factors was validated using leave one-out cross validation technique, and the square error of cross validation (SECV) value was computed. The result of SECV value for number of factors in the selected PLS for quantification PO and CaOin AO were 0.64 and 0.70%, respectively. The low values of SECV indicate the goodness of cross validation.
CONCLUSION
The presence of PO in AO can be monitored using PLS calibration model at the wavenumbers region of 1260–900 cm–1. The coefficient of determination (R2) obtained for the relationship between actual value of PO and FTIR predicted value is 0.999. The values of RMSEC and RMSEP obtained are 0.80 and 0.79%, respectively. Meanwhile, the wavenumber region of 3025–2850 and 1260–900 cm–1 was used for quantification of CaO, R2, RMSEC, and RMSEP values are 0.9995, 0.83 and 0.64%, respectively. It can be concluded that FTIR spectroscopy combined with multivariate calibrations can be used to detect and quantify the adulteration of AO in binary mixtures with PO and CaO. PLS calibration model was succed to determine the level of adulterants.
FUNDING
The author would like to thank the Faculty of Pharmacy, Gadjah Mada University for the financial support.
Additional information
Funding
REFERENCES
- Bergh, B. Nutritious Value of Avocado. California Avocado Society Yearbook 76; California Avocado Society: California, USA, 1992; 123–135 pp.
- Ozdemir, F.; Topuz, A. Changes in Dry Matter, Oil Content, and Fatty Acids Composition of Avocado During Harvesting Time and Post-Harvesting Ripening Period. Food Chemistry 2004, 86, 79–83.
- Takenaga, F.; Matsuyama, K.; Abe, S.; Torri, Y.; Itoh, S. Lipid and Fatty Acid Composition of Mesocarp and Seed of Avocado Fruits Harvested at Northern Range in Japan. Journal of Oleo Science 2008, 57, 591–597.
- Tango, J.S.; Carvalho, C.R.L.; Soares, N.B. Physical and Chemical Characterization of Avocado Fruits Aiming its Potential for Oil Extraction. Revista Brasileira de Fruticultura 2004, 26, 17–23.
- Salgado, J.M.; Bin, C.; Mansi, D.N.; Souza, A. Effect of the Hass Avocado (Persea Americana Mill) on Hypercolesterolemic Rats. Ciencia e Tecnologia de Alimentos 2008, 28, 922–928.
- Ortiz-Moreno, A.; Dorantes, L.; Galíndez, J.; Guzmán, R.I. Effect of Different Extraction Methods on Fatty Acids, Volatile Compounds, and Physical and Chemical Properties of Avocado (Persea Americana Mill.) Oil. Journal of Agricultural and Food Chemistry 2003, 51, 2216–2221.
- Ozen, B.; Mauer, L. Detection of Hazelnut Oil Adulteration Using FTIR Spectroscopy. Journal of Agricultural and Food Chemistry 2002, 50, 3898–3901.
- Litz, R.E.; Raharjo, S.H.T.; Gómez-Lim, M.A. Avocado. In Biotechnology in Agriculture and Forestry; Pua, V.E.C.; Davey, M.R.; Eds.; Springer-Verlag: Berlin Heidelberg, 2007.
- Pavia, D.L.; Lampman, G.M.; Kriz Jr., G.S. Introduction to Spectroscopy: A Guide for Students of Organic Chemistry, 3rd Ed; Thomson Learning Inc.: London, 2001.
- Reid, L.M.; O’Donnell, C.P.; Downey, G. Recent Technological Advances for the Determination of Food Authenticity. Trends in Food Science and Technology 2006, 17, 344–353.
- Christy, A.A.; Kasemsumran, S.; Du, Y.; Ozaki, K. The Detection and Quantification of Adulteration in Olive Oil by Near-Infrared Spectroscopy and Chemometrics. Analytical Science 2004, 20, 935–940.
- Ritz, M. Identification of Origin of Coal from the Ostrava-Karvina Mining District by Infrared Spectroscopy and Discriminant Analysis. Vibrational Spetroscopy 2007, 43, 319–323.
- Paradkar, M.M.; Sivakesava, S.; Irudayaraj, J. Discrimination and Classification of Adulterants in Maple Syrup with the Use of Infrared Spectroscopic Techniques. Journal of the Science of Food and Agriculture 2002, 83, 714–721.
- Rohman, A.; Che Man, Y.B. The Use of Fourier Transform Mid Infrared (FT-MIR) Spectroscopy for Detection and Quantification of Adulteration in Virgin Coconut Oil. Food Chemistry 2011, 129, 583–588.
- Wang, L.; Lee, F.S.C.; Wang, X.; He, Y. Feasibility Study of Quantifying and Discriminating Soybean Oil Adulteration in Camellia Oils by Atenuated TR MIR and Fiber Optic Diffuse Reflectance NIR. Food Chemistry 2006, 95, 529–536.
- Nurrulhidayah, A.F.; Che Man, Y.B.; Rohman, A. FTIR Spectroscopy Combined with Chemometric for Analysis of Sesame Oil Adulterated with Corn Oil. International Journal of Food properties 2014, 17(6), 1275–1282.
- Rohman, A.; Che Man, Y.B. Authentication of Extra Virgin Olive Oil from Sesame Oil Using FTIR Spectroscopy and Gas Chromatography. International Journal Food Properties 2012, 15, 1309–1318.
- Rohman, A.; Wibowo, D.; Sudjadi; Lukitaningsih, E.; Rosman, A.S. The Use of Fourier Transform Infrared Spectroscopy in Combination with Partial Least Square for Authentication of Black Seed Oil. International Journal of Food Properties 2015, 18, 775–784.
- Rohman, A.; Che Man, Y.B.; Nurrulhidayah, A.F. First Derivative FTIR Spectra Combined with Chemometrics and Fatty Acid Composition for Analysis of Pumpkin Seed Oil Blended into Olive Oil. International Journal Food Properties 2015, 18, 1086–1096.
- Yap, K.Y.L.; Chan, S.Y.; Lim, C.S. Infrared-Based Protocol for the Identification and Categorisation of Ginseng and Its Products. Food Research International 2007, 40, 643–652.
- Guillen, M.D.; Cabo, N. Characterization of Edible Oils and Lard by Fourier Transform Infrared Spectroscopy. Relationships Between Composition and Frequency of Concrete Bands in the Fingerprint Region. Journal of American Oil Chemist’s Society 1997, 74, 1281–1286.
- Lerma-Garcia, M.J.; Ramis-Ramos, G.; Herrero-Martinez, J.M.; Simo-Alfonso, E.F. Authentication of Extra Virgin Olive Oils by Fourier-Transform Infrared Spectroscopy. Food Chemistry 2010, 118, 78–83.
- dos Santos, M.A.Z.; Tatiana, V.R.; Claudio, M.P.; Ramis-Ramos, G.; Carla, R.B. Profile of Bioactive Compounds in Avocado Pulp Oil: Influence of the Drying Processes and Extraction Methods. Journal of American Oil Chemist’s Society 2014, 91, 19–27.
- Che Man, Y.B.; Syahariza, Z.A.; Mirghani, M.E.S.; Jinap, S.; Bakar, J. Analysis of Potential Lard Adulteration in Chocolate and Chocolate Products Using Fourier Transform Infrared Spectroscopy. Food Chemistry 2005, 90, 815–819.
- Smith, B.C. Quantitative Spectroscopy: Theory and Practice; Academic Press: Amsterdam, The Netherlands 2002; 125–179 pp.
- Cadet, F.M.; de la Guardia, M. Infrared quantitative analysis. In Encyclopedia of Analytical Chemistry, Meyers, R.A.; Ed.; John Wiley & Sons Inc.: Chichester, UK, 2001; 1–26 pp.
- Ragno, G.; Ioele, G.; Risoli, A. Multivariate Calibration Techniques Applied to the Spectrophotometric Analysis of One-to-Four Component Systems. Analytica Chimica Acta 2004, 512, 173–180.