
Abstract
In this study a hyperspectral imaging system (short wave infrared range from 1000 to 2500 nm) was used to model fish texture by experimental compression test. Partial least square–discriminate analysis modeling technique was used for classifying the samples by linking the hyperspectral information and their measured texture. The R2 of cross validation and prediction were 0.97 and 0.96, respectively. The root mean squared errors for cross validation and prediction were 0.07 and 0.09, respectively. Sensitivity and specificity for both class I and II were 1.00. Results indicated that hyperspectral imaging in short wave infrared range has ability to detect texture stiffness of rainbow trouts which is affected by freshness.
INTRODUCTION
Rainbow trout (Oncorhynchus mykiss, formerly named Salmo gairdneri) is one of the salmonid species which is native to tributaries of the Pacific Ocean in Asia and North America range from Alaska to Mexico.[Citation1,Citation2] The rainbow trout flesh is tender with a tasty and nutty flavor which made this fish very popular in chain food in all over the world.[Citation3] Rainbow trout is one of the major aqua cultural productions in Iran. The annual production of rainbow trout in Iran was 106,409 tons in 2011, that is 13.8% of the total production in the world.[Citation4]
Texture is a critical parameter that is used to determine the overall quality perception of salmon products.[Citation5] Consumers usually accept tenderness rate as the major parameter that determines the quality of meat.[Citation6] A primary goal in texture analysis is developing objective measurement methods that accurately define textural characteristics for consumer quality judgments.[Citation7] There are several methods for texture analysis of meat and its products. One of them is using a taste panel. But, the design and execution of the taste panels require special skills and experiences for obtaining reliable results.[Citation8] On the other hand, the human inspection is a subjective method, which is time-consuming, laborious, tedious, and inconsistent.[Citation9] In contrast, texture of salmon fillets can be measured by using mechanical food-testing equipment.[Citation10] The measurement of texture using an instrument is preferred over sensory evaluations since instruments can reduce variation among measurements and are more precise.[Citation11] Some instrumental evaluation methods for meat and its products have been used for texture analysis such as hardness, adhesiveness, cohesiveness, springiness, chewiness, gumminess, and fracture ability.[Citation12] There are many instrumental methods for measuring the force based on cutting or compressing of a meat sample. However, not all of those techniques are applicable for fish samples, for instance, shear force is a common method used for pork or beef texture analysis. In Shear force measurement, strips or cores (1 cm2 × 3 cm) are removed parallel to the muscle fibers and sheared perpendicular to the fibers.[Citation12] This technique cannot be used for a given fish sample, especially in rainbow trout, because it is not possible to remove a core with 1 cm2 × 3 cm dimension. In this situation, the compression test is used instead of the shear force method. By compression test method, sample is compressed to some percentage of its thickness and the maximum force is measured.[Citation12] Beside of this, common traditional method for detection of fish freshness is compression by finger-like compression test. If the pressure region returns to the initial state, then this fish is fresh, but if its shape is changed, then this sample isn’t fresh. This method is time consuming and depends on individual skills. Because of this, compression test is related to freshness of fish and people use this parameter for detection of sample freshness. However, instrumental methods are destructive, time-consuming, and laborious, and therefore, cannot be used as an automatic system in the industry inspection line.
Hyperspectral imaging (HSI) is a powerful method that has many applications in food products research.[Citation13] HSI has advantages of two different methods namely spectroscopy and imaging.[Citation14] In spectroscopy usually one or few points of a given sample is measured while information from the whole sample is measured by a HSI system. This method is non-destructive, fast, and relatively inexpensive. Its applications in agriculture include vegetation mapping, crop disease, stress and yield detection, component identification in plants, and detection of impurities. There is growing interest in HSI for safety and quality assessments of agro-food products.[Citation15] Wu et al. applied partial least square regression (PLSR) to establish a quantitative model between hyperspectral images of salmon fillets and their corresponding parameters of hardness, cohesiveness, and adhesiveness.[Citation9] The Correlation Coefficients (r) of 0.665, 0.555, and 0.606 while the root mean square errors of cross validation (RMSECV) of 4.09, 0.067, and 0.504 were achieved for hardness, cohesiveness, and adhesiveness, respectively. The results demonstrated that HSI technique has the potential to quantitatively measure texture of salmon fillet in a rapid and non-invasive way. It was concluded that R2 for classification is better than regression when the target is the texture analysis of meat product. Liu et al. attempted to classify beef samples into tender and tough classes using spectroscopy which resulted in a model with correct classification of 83%.[Citation16] Soft Independent Modeling of Class Analogy (SIMCA) of principal component analysis (PCA) model of measured tenderness showed great promise in the classification of tender and tough meats with over 96% success. While the R2 in the regression model was between 0.49 and 0.55 for tenderness and sensory chewiness, respectively. The HSI method has acceptable results in other fields, such as detection and quantification of ergot bodies in cereals,[Citation17] external insect infestations on jujube fruit,[Citation18] and monitoring quality of tomato fruit.[Citation19] The main aim of this research is to model the texture of rainbow trout by linking a compression test (as time-consuming and destructive method) and HSI (as fast and non-destructive method) in duration of storage.
MATERIAL AND METHODS
Sample Preparation
A total of 80 rainbow trout were killed, gutted, packed in food plastics individually, and then labeled. Samples were divided to four different batches. Each batch had 20 samples and was preserved in ice for 1, 3, 5, and 7 days, respectively. These batches were then stored in four boxes full of ice. Fresh ice was added daily to completely cover the fish. The boxes were put in a cold preservation room with 4°C.
HSI
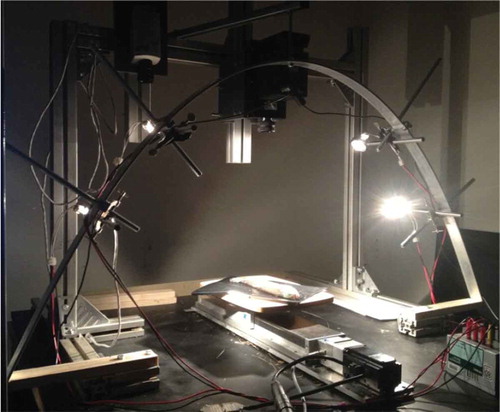
The HSI was done in HyperSpectral Imaging laboratory of MeBioS (Mechatronics, Biostatistics, and Sensors) division of Biosystems Department, KU Leuven, Belgium. The HSI system consists of a short wave infrared (SWIR) imager, illumination device, and translation stage (). The SWIR HSI was done by using a hyperspectral camera (HS SWIR XS-M320C4-60, Headwall Photonics Inc., Fitchburg, MA) which consists of an MCT camera (XEVA MCT-2140, Belgium) with the optimal sensitivity from 1000–2500 nm and 320 by 256 pixel resolution and a reflective concentric grating (Headwall Photonics Inc., Fitchburg, MA). The spectrograph had a fixed-size internal slit (60 μm) to define the field-of-view (FOV) for the spatial line. Illumination device consists of a light source with four halogen lamps (DECOSTAR ALU 12V 20W 36°, OSRAM, Germany) that were arranged on arc frame to obtain homogeneous illumination of the scanned area. The system operates by push broom camera and scans a single-spatial line of a target object and the spectrograph disperses light from each line element or pixel to a spectrum. Therefore, each image is build based on lines of pixels in one axis and spectral pixels in the other axis. To obtain a three-dimensional (3D) hyperspectral data cube, the sample has to be moved along with the second spatial dimension. A controlled translation stage with adjustable sample holder was used to move the sample using a stepper motor (TLA15-400, Franke GmbH, Aalen, Germany) under the SWIR camera. The system was operated using Lab View V8.5 software (National Instruments, Austin, TX, USA). The Exposure time was optimized and selected as 9.7 ms in order to have a good signal to noise ratio of the reflectance in whole surface of a fish sample. Translation stage speed and step was 200 mm/s and 0.3 mm, respectively.
FIGURE 1 Short wave infrared hyperspectral imaging system.
Compression Test
A compression test was performed by a universal material testing machine equipped with a 200 N load cell (). The probe was a stainless steel cylinder (diameter: 11 mm). Approximately one-third of the cylinder base was rounded imitating a human finger (). Sample thickness and the maximum force needed to compress the sample to 40% of its thickness were recorded. The probe compression speed was 1 mm/s. The sample temperature during compression was kept constant at 5–7ºC by keeping the samples in a plastic film covering with ice until before performing the measurements. An average of three recorded forces performed on each sample was calculated as compression force.[Citation12,Citation20] Statistical analysis was done by applying the analysis of variance (ANOVA) using SPSS13 software. Duncan’s multiple ranges test was used to separate means at a 5% level of significance.
FIGURE 2 (a) Compression test using the universal testing machine and (b) stainless steel probe.
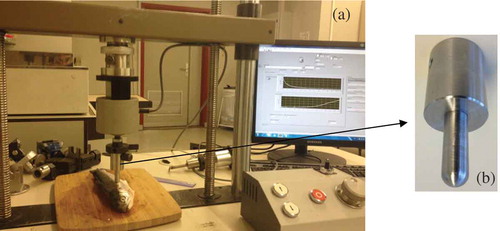
Image Correction
The dark and white reference images were captured in the optimized data acquisition setup for SWIR camera. A white reference tile (Spectralon® Reflectance Standards, RSS-08-010, Labsphere) with 20% reflectance was used to provide an estimate of the incident light on the tile at each wavelength, which is used in the normalization of the spectra. On the other hand, the dark reference image (~0% reflectance) was obtained by turning off the illumination device together with covering the camera lens completely with its non-reflective opaque black cap. These two images were used for elimination or reducing of the effects of variation in illumination, detector sensitivity, and geometry for every pixel in the image using the following equation:[Citation21]
where R is the relative reflectance, I is the intensity value captured from the sample, ID is the dark current, and IW is the intensity captured from the white reference tile.
Image Segmentation and Region of Interest (ROI) Selection
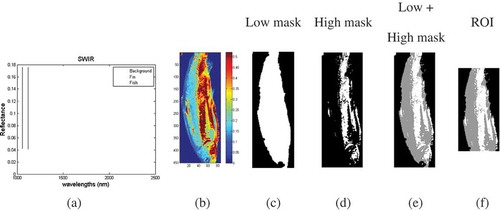
In the captured images, the background, the edges and the saturated pixels were removed before calculating the mean spectrum of each sample. By doing so, these uninformative regions of each fish image which do not carry useful information were removed before data handling. A low and high mask was used in order to remove uninformative regions and select ROI. shows reflected spectra from the fin and a fish sample using SWIR setup. Reflectance for the background region is zero which is not shown in figure. As shown in , the region between 1054–1150 nm was selected to segment the background, fin edges, and fish based on the best differentiation of the mentioned spectra. The threshold value 0.1 was used. shows the selected region in a fish sample () by applying low mask with white color. In order to remove the saturated points, a 95% of maximum reflectance (thresholds for high mask) in the 1100 nm bands is used to constrain the high mask. All pixels with value higher than threshold were removed from the images. shows the saturated pixels with white color, detected by applying the high mask criteria. Gray scale area in the shows the interesting region containing of information from fish flesh. Finally applicable region was selected through cutting the head and tail of the fish samples manually ().
FIGURE 3 Low and high masks of a fish sample. (a) Reflected spectra from fin and fish, (b) images in bands 1100 nm, was used to obtain high mask threshold, (c) image after applying the low mask, (d) image after applying the high mask, (e) image after applying the low and high masks, and (f) final region of interest.
Preprocessing
In order to remove/reduce physical phenomena in the spectra, several preprocessing methods such as smoothing, scatter correction, and derivative transformation were used before modeling.[Citation22,Citation23] Savitzky-Golay (SG) function using a window size of 15 was used for smoothing the spectra.[Citation24] First and second derivatives are both commonly used in spectroscopy, particularly in near infrared (NIR) spectroscopy. After smoothing and second derivative function, standard normal variate (SNV) and multiplicative scatter correction (MSC) were used to scatter correction of spectrums.[Citation25,Citation26]
Partial Least Square Discriminate Analysis (PLS-DA) Classification
PLS-DA method was used the quantitative regression method of PLS to perform qualitative analysis. The PLS-DA calibration technique links the spectral information with the sample classes. In the model, 60% samples of each class were used for calibration and 40% samples were used to predict. The squared correlation coefficient (R2) of the predicted classes versus reference classes obtained by compression test and root mean square error (RMSE) were used to evaluate the model. R2 indicates how well-predicted and measured class of samples fit a line or curve. RMSE is an estimate of the standard error and was calculated by following equation:
where ŷi is the predicted class of the ith sample, yi is the real class of the ith sample, is the class average of all samples, and N is number of samples. Sensitivity and specificity are two statistical measures which are used to investigate the performance of a classification model. The sensitivity of Class I is the proportion of Class I (positives) samples that classified as Class I (true positive). The specificity of Class I is the proportion of Class II (negatives) samples that classified as Class II (true negatives). These parameters can be written as Eqs. (3) and (4):[Citation27]
shows the flowchart of this research to analysis the data for investigation of storage time effects on rainbow trout texture using HSI. All image processing, modeling and preprocessing methods were performed using PLS-Toolbox (Eigenvector Research Inc, Wenatchee, USA).
FIGURE 4 Flow chart of the texture analysis of rainbow trout using SWIR hyperspectral imaging.
RESULTS AND DISCUSSIONS
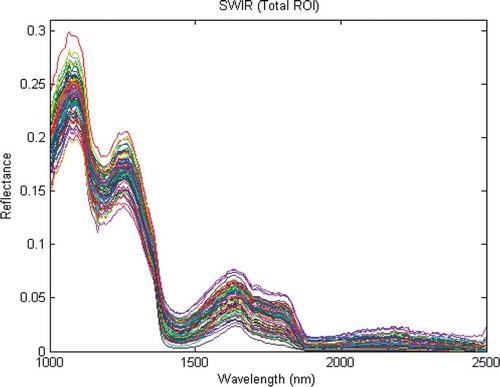
The mean spectrum of each sample using SWIR HSI system in the ROI by applying low and high masks was calculated. As shown in the main information of spectra was between 1000 and 1900 nm. For modeling by PLS-DA, the spectra between these regions were used.
FIGURE 5 Raw spectra of rainbow trout by SWIR hyperspectral imaging.
Compression Test Classification
The variance analysis of the obtained maximum force indicated that time storage of rainbow trout has a significant effect on maximum force (p < 0.01). Moreover, shows obtained results of compression test of rainbow trout for four different storage times of the samples. As indicated, maximum, minimum, mean and standard deviation of 1 day samples is different from other days samples. In similar research, Liu et al. reported Warner-Bratzler Shear Force (WBSF) for beef meat in duration of ice storage that, the results for 2, 4, and 8 day samples were 7.38 ± 2.28, 5.85 ± 2.06, and 5.36 ± 1.70 kg, respectively.[Citation19] As shown, the mean force of 2-day samples is more than 4 and 8 days. Also the difference between 4 and 8 days WBSF is negligible.[Citation19] These results confirm our results too.
TABLE 1 Mean comparison of maximum force of rainbow trout for four different storage time batches
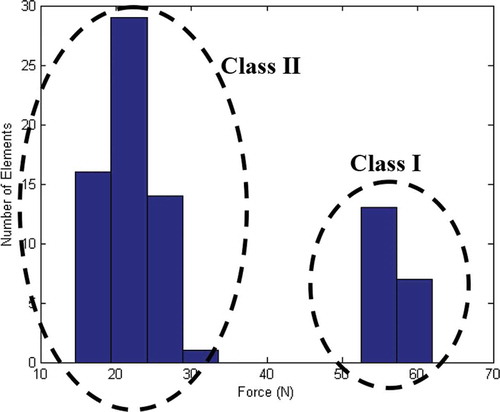
shows relative frequency of the obtained results by a compression test. As shown, the force measured of samples in the first day of storage is completely separated from those measured in 3, 5, and 7 preservation time. Therefore, 1 day samples assigned as Class I and other samples categorized as Class II. As described in the introduction, one method used to detect the freshness of fish is by finger compression. If the region that is compressed returns to the initial state, that would indicate that the fish is fresh. It can also be concluded that fresh fish has firmer texture and would require more force for compression.
FIGURE 6 Relative frequency of maximum force obtained from the compression test.
PLS-DA Modeling
The performance of PLS-DA models was evaluated based on R2 and RMSE for calibration (Cal), cross validation (CV) and a Prediction (Pre) set. In addition, sensitivity and specificity of models were calculated. The number of latent variable (LV) principle component (PC) was selected 2, based on minimum RMSECV. This model used to detect the class of samples based on compression test classification. shows results obtained based on two different preprocessing techniques such as SG+D2+MSC and SG+D2+SNV. As shown in , both techniques resulted in the sensitivity and specificity of 100%. The R2 of Calibration, CV, and prediction were 0.97, 0.97, and 0.96, respectively, when SG+D2+MSC was used as preprocessing technique, while 0.98, 0.98, and 0.97 obtained based on SG+D2+SNV preprocessing technique. This conclusion is according to the previous studies that the performance of models based on both SNV and MSC are rather similar.[Citation28,Citation29] In similar research, classification of tender and tough beef meats reported 0.96 by using WBSF method.[Citation19] It should be emphasized that this result obtained using second derivative (D2) helps to separate overlapping absorption bands, remove baseline shifts and increase apparent spectral resolution.[Citation30,Citation31]
TABLE 2 The obtained results by PLS-DA model
In this research, the texture of rainbow trout was analyzed using a compression test and HSI. The compression test indicated that texture of fresh samples (or 1 day samples) is firmer than texture of non-fresh samples (or more than 1 day samples) and storage of rainbow trout has significant effect on texture. This study suggests that SWIR (1000–2500 nm) HSI system coupled with chemometric techniques has a great potential to be used as a non-destructive, reliable, and rapid texture detection tool for rainbow trout. D2 preprocessing combined with a smoothing function and followed by a scatter correction method helps to build a robust model.
FUNDING
The authors gratefully acknowledge I.W.T.-Flanders for the financial support through the Chameleon project (IWT 100021).
Additional information
Funding
Related Research Data
REFERENCES
- Behnke, R.J. Native Trout of Western North America; American Fisheries Society (Afs Monograph: No 6): Bethesda, MD, 1992.
- Clemento, A.J.; Anderson, E.C.; Boughton, D.; Girman, D.; Garza, J.C. Population Genetic Structure and Ancestry of Oncorhynchus Mykiss Populations above and Below Dams in South-Central California. Conservation Genetics 2009, 10, 1321–1336.
- Froese, R.; Pauly, D. Fish Base. http://www.fishbase.org ( accessed on July 1, 2013).
- FAOSTAT. Food and Agriculture Organization of the United Nations, FAOSTAT database. http://www.fao.org/fishery/statistics/en ( accessed on October 13, 2013).
- Morkore, T.; Einen, O. Relating Sensory and Instrumental Texture Analyses of Atlantic Salmon. Journal of Food Science 2003, 68(4), 1492–1497.
- Brewer, S.; Novakofski, J. Consumer Sensory Evaluations of Aging Effects on Beef Quality. Journal of Food Science 2008, 73, S78–S82.
- Moskowitz, H.R. Food Texture: Instrumental and Sensory Measurement; Marcel Dekker Incorporated, New York, 1987; 335 p.
- Ashton, T.J.; Michie, I.; Johnston, I.A. A Novel Tensile Test Method to Assess Texture and Gaping in Salmon Fillets. Journal of Food Science 2010, 75(4), S182–S190.
- Wu, D.; He, H.J.; Sun, D.W. Non-Destructive Texture Analysis of Farmed Salmon Using Hyperspectral Imaging Technique. In Proceedings of the 3rd CIGR International Conference of Agricultural Engineering (CIGR-AgEng 2012). Valencia, Spain, 8–12 July, 2012.
- Sigurgisladottir, S.; Hafsteinsson, H.; Jonsson, A.; Lie, O.; Tho-massen, M.; Torrissen, O. Textural Properties of Raw Salmon Fillets As Related to Sampling Method. Journal of Food Science 1999, 64, 99–104.
- Casas, C.; Martinez, O.; Guillen, M.D.; Pin, C.; Salmeron, J. Textural Properties of Raw Atlantic Salmon (Salmosalar) at Three Points Along the Fillet, Determined by Different Methods. Food Control 2006, 17(7), 511–515.
- Nollet Leo, M.L. Handbook of Meat, Poultry, and Seafood Quality, 2nd Ed; John Wiley & Sons Inc, Iowa, 2012; 576 p.
- Wu, D.; Sun, D.W. Advanced Applications of Hyperspectral Imaging Technology for Food Quality and Safety Analysis and Assessment: A Review—Part II: Applications. Innovative Food Science and Emerging Technologies 2013, 19, 15–28.
- Heia, K.; Sivertsen, A.H.; Stormo, S.K.; Elvevoll, E.; Wold, J.P.; Nilsen, H. Detection of Nematodes in Cod (Gadusmorhua) Fillets by Imaging Spectroscopy. Journal of Food Science 2007, 72, E11–E15.
- Dale, L.M.; Thewis, A.; Boudry, C.; Rotar, I.; Dardenne, P.; Baeten, V.; Pierna, J.A.F. Hyperspectral Imaging Applications in Agriculture and Agro-Food Product Quality and Safety Control: A Review. Applied Spectroscopy Reviews 2013, 48(2), 142–159.
- Liu, Y.; Lyon, B.G.; Windham, W.R.; Realini, C.E.; Pringle T.D.; Duckett, S. Prediction of Color, Texture, and Sensory Characteristics of Beef Steaks by Visible and Near Infrared Reflectance Spectroscopy. A Feasibility Study. Meat Science 2003, 65(3), 1107–1115.
- Vermeulen, P.; Pierna, J.F.; Egmond, H.V.; Dardenne, P.; Baeten, V. Online Detection and Quantification of Ergot Bodies in Cereals Using Near Infrared Hyperspectral Imaging. Food Additives & Contaminants: Part 2012, 29(2), 232–240.
- Liu, G.; He, J.; Wang, S.; Luo, Y.; Wang, W.; Wu, L.; Si, Z.; He, X. Application of Near-Infrared Hyperspectral Imaging for Detection of External Insect Infestations on Jujube Fruit. International Journal of Food Properties 2016, 19, 41–52.
- Mollazade, K.; Omid, M.; Akhlaghian Tab, F.; Rezaei Kalaj, Y.; Mohtasebi, S.S. Data Mining-Based Wavelength Selection for Monitoring Quality of Tomato Fruit by Backscattering and Multispectral Imaging. International Journal of Food Properties 2014, 18, 880–896.
- Rasmussen, R.S.; Heinrich, M.H.; Hyldig, G.; Jacobsen C.; Jokumsen, A. Moderate Exercise of Rainbow Trout Induces Only Minor Differences in Fatty Acid Profile, Texture, White Muscle Fibers, and Proximate Chemical Composition of Fillets. Aquaculture 2011, 314, 159–164.
- Kamruzzaman, M.; ElMasry, G.; Sun, D.W.; Allen, P. Non-Destructive Prediction and Visualization of Chemical Composition in Lamb Meat Using NIR Hyperspectral Imaging and Multivariate Regression. Innovative Food Science and Emerging Technologies 2012, 16, 218–226.
- Huang, X.; Xin, J.; Zhao, J. A Novel Technique for Rapid Evaluation of Fish Freshness Using Colorimetric Sensor Array. Journal of Food Engineering 2011, 105(4), 632–637.
- Huang, Y.; Cavinato, A.G.; Mayes, D.M.; Bledsoe, G.E.; Rasco, B.A. Non-Destructive Prediction of Moisture and Sodium Chloride in Cold Smoked Atlantic Salmon (Salmosalar). Journal of Food Science 2002, 67, 2543–2547.
- Savitzky, A.; Golay, M.J.E. Smoothing and Differentiation of Data by Simplified Least Squares Procedures. Analytical Chemistry 1964, 36, 16–27.
- Bakeev, K.A. Process Analytical Technology: Spectroscopic Tools and Implementation, 2nd Ed; Wiley: New York, NY, 2010; 557 p.
- Martens, H.; Næs, T. Multivariate Calibration; John Wiley & Sons: New York, NY, 1989; 504 p.
- Parikh, R.; Mathai, A.; Parikh, S.; Sekhar, G.C.; Thomas, R. Understanding and Using Sensitivity, Specificity, and Predictive Values. Indian Journal of Ophthalmology 2008, 56(1), 45–50.
- Pizarro, C.; Esteban-Díez, I.; Nistal, A.J.; González-Sáiz, J.M. Influence of Data Pre-Processing on the Quantitative Determination of the Ash Content and Lipids in Roasted Coffee by Near Infrared Spectroscopy. Analytica Chimica Acta 2004, 509, 217–227.
- Zhu, F.; Cheng, S.; Wu, D.; He, Y. Rapid Discrimination of Fish Feeds Brands Based on Visible and Short-Wave Near-Infrared Spectroscopy. Food and Bioprocess Technology 2011, 4, 597–602.
- Lin, M.; Al-Holy, N.; Mousavy-Hesary, M.; Al-Qadiri, H.; Cavinato, A.G.; Rasco, B.A. Rapid and Quantitative Detection of the Microbial Spoilage of Chicken Breasts by Diffused Reflectance Spectroscopy (600–1100 nm). Letters in Applied Microbiology 2004, 39, 148–155.
- Grau, R.; Sanchez, A.J.; Giron, J.; Iborra, E.; Fuentes, A.; Barat, J.M. Nondestructive Assessment of Freshness in Packaged Sliced Chicken Breasts Using SW-NIR Spectroscopy. Food Research International 2011, 44(1), 331–337.