
Abstract
This research proposed to design a prediction model based on radial basis function neural network and near infrared reflectance spectroscopy in detecting concentration of benzoyl peroxide in flour. Near infrared reflectance spectra acquired from 100 different concentration samples were pre-processed by the standard normal variate method, detection of leverage, and student residual. Near infrared reflectance spectroscopy models were designed to predict benzoyl peroxide in the 36 samples by means of partial least squares, back propagation neural network, and radial basis function, respectively. The results demonstrated that the radial basis function model, with prediction correlation coefficient (R), root mean squared error of prediction, and ratio of performance to standard deviate reaching 0.9937, 15.5095, and 8.8216, respectively, had optimal prediction accuracy and feasibility providing quality evaluation and dynamic monitoring service for quality inspection department and consumers.
INTRODUCTION
Flour can be used to make bread, noodles, steamed buns, and other flour products, and its safety and quality are still considered as important issues all over the world. Usually, most consumers prefer to buy the flour and its by-products that looked whiter requiring a higher whiteness of flour, which forced the wheat processing enterprises to attach great importance to flour whiteness.[Citation1,Citation2] One of the components of wheat is lutein, it turns the flour yellow for a long time after it is ground. The conjugate double-bond in lutein molecules is a chromophore, it will be oxidized slowly in the air by means of absorbing light and cause the flour to fade,[Citation3] but a long period of storage, at least several months, is required, so it is not feasible for the sake of business.[Citation4] Benzoyl peroxide (BPO) which will promote flour to turn white due to its feature of strong oxidation[Citation5] is one of flour brighteners a lot of flour processing enterprises widely use to cater to the demand of consumers.[Citation6] But the excessive use of BPO will destroy the carotene, vitamin A, vitamin E, vitamin B1, and vitamin B2 in flour.[Citation7] If people eat the flour with excessive BPO for a long time, it will cause vitamin deficiencies and some diseases, such as angular stomatitis, neuritis, the cumulative damage of central nervous system, and even failure of the liver,[Citation8] and because of which many countries, including China, have issued corresponding laws and regulations to restrain the use of BPO. For example, Chinese GB2760-2007 stipulates the concentration of BPO in flour should not exceed 60 mg·Kg–1; the maximum concentration of BPO in flour is 80 mg·Kg–1 in the United States, which is 300 mg·Kg–1 in Japan, and 50 mg·Kg–1 in the United Kingdom.[Citation9] In March 2011, the Ministry of Public Health of China issued the latest announcement that it was forbidden to add brightener into flour From May 1, 2011. But some small flour enterprises are still using BPO as a flour brightener[Citation10] due to the fierce market competition and the low cost of BPO. So, it is of vital importance to detect BPO in flour rapidly by technical means, which can not only provide powerful technical support for sampling observation of quality supervision department and standardize the market order, but also ensure the safety of flour quality and the consumers’ rights and interests. Currently, China has established two national standards, GB/T18415-2001 (gas chromatography) and GB/T22325-2008 (high-performance liquid chromatography [HPLC]), to detect BPO besides other detection methods involving electrochemical analysis,[Citation11] Chemiluminescence,[Citation12] and iodometry,[Citation13] etc. But these methods are too complex, time consuming, and chemical reagents consuming, and they also require professionals with a variety of specialized equipments, which are problems commonly existing in the process of quantitative and qualitative analysis of other crops and their by-products. Recently, many researchers are seeking a more speedy and simple method to achieve the quantitative and qualitative analysis of the food addictive in raw material to realize the real-time monitoring quality.
Near infrared reflectance spectroscopy (NIRS) is a green and non-destructive testing technology,[Citation14] which has become a very effective method of speedy detection to take place of the chemical test. Ni et al.[Citation15] predicted the fat content, water content, acid value, and peroxide value in potatoes using the least squares support vector machine (LS-SVM) algorithm together with NIRS, and the predictive correlation coefficients of each ingredient were all above 0.949, with the maximum of the root mean squared error of prediction (RMSEP) being only 0.435, the minimum value being 0.076. Luo[Citation16] predicted the polyphenol and the polysaccharide in tea using the NIRS technology in combination with artificial neural network models with R, RMSEP, RSEP being 0.9804, 0.529, 0.017, and 0.9682, 0.111, 0.030, respectively. Latorre et al.[Citation17] designed an origin recognition model based on the NIRS and soft independent modeling of class analogy (SIMCA) analysis with the sensitivity being 93.3% and the specificity being 100%. Zhang et al.[Citation18] adopted the LS-SVM model based on NIRS analysis to identify the nuances scar of fresh jujube fruit, and the identification accuracy could reach 100%. Ferreira et al.[Citation19] used NIRS, the partial least squares (PLS) algorithm, and multivariate calibration to predict the moisture, ash, protein, and fat in soybeans, with the minimum value of the decision coefficient being 0.72, the maximum value being 0.88 and root mean square error of cross validation (RMSECV) all being below 2.09%. Zhang et al.[Citation20] designed a model between the spectral data and BPO using PLS algorithm, with the coefficient of calibration set and prediction set being 0.8901 and 0.8865, respectively; the RMSE being 40.85 mg·Kg–1 and 44.69 mg·Kg–1, respectively. Haughey et al.[Citation21] detected the melamine in soybean meal using NIRS in combination with PCA, with R2 reaching 0.89–0.99 and the RMSE of the calibration set and prediction set being 0.081–0.276 and 0.134–0.368%, respectively. Mouazen et al.[Citation22] detected the glucose in a mixture of Saudi and imported honey samples adulterated with glucose syrup of five concentrations: 0, 5, 12, 19, and 33%, using visible/near infrared reflectance (VIS/NIR), with the standard deviation divided by RMSEP being 4.52, 0.85, and 2.53 g/100 g, respectively. On the basis of predecessors’ researches, this research proposed to design a prediction model for detecting the flour of different BPO concentrations using NIRS in combination with the radial basis function (RBF) algorithm. The feasibility and validity of this method is validated through a great deal of experiments.
MATERIALS AND METHODS
The Source and Preparation of the Samples
The flour in the market may have been added a variety of additives, such as gluten fortifier and brightener, in order to ensure the accuracy of experimental results, the original flour used in this experiment was hard-red-spring wheat in the North-Eastern area which was gathered and ground by the Agricultural Products Quality and Safety Research Institute of Heilongjiang Academy of Agricultural Sciences. The analytical reagent of BPO produced by Sigma in the United States was preserved in water with number 517909 and 75% concentration. The stepwise dilution method was adopted to prepare the samples instead of preparing directly to decrease experiment error, since the required concentration of BPO was lower. The procedures were as follows: First, make a 1% concentration sample (10,000 mg kg–1); then, add flour into the 1% concentration sample to dilute it to 0.1% (1000 mg kg–1); finally, take the 0.1% concentration sample as reference sample to make up the required concentration samples. One hundred different concentration samples were prepared, ranging from 10 to 505 mg kg–1, with the concentration gradient being 5 mg kg–1, the mean value being 257.5mg kg–1, and the standard deviation being 145.06 mg kg–1. The prepared samples were put in the same environment (room temperature 25°C, dark, and ventilation) for 48 h to make sure that the BPO reacted well to lutein.
Collection of Spectral Data
NIRS DS2500 analyzer with a scanning range of 400–2498 nm by increments 2 nm produced by FOSS company was adopted to scan the spectra at the temperature between 21–25°C. While loading the sample, the rim of cup was smoothed after a sample was packed into the sample cup to make it even with the cup’s edge in order to avoid the objective interference. To eliminate the influence of inconsistent uniformity, each sample was measured 10 times repeatedly, and the average of 10 times would be taken. One hundred groups of spectral data were obtained with each group containing 1050 spectral points.
Measurement of BPO by Physical and Chemical Methods
When the BPO was put into flour, it would react to the moisture in flour and decompose into benzoic acid under the action of enzyme. In theory, the full reaction of the BPO was required, but it was hard to control the degree of the reaction in fact. So before measuring the benzoic acid in samples, the unreacted BPO should be extracted and reduced to benzoic acid. In order to examine the accuracy of the prepared concentrations, the HPLC method was adopted to measure the actual concentrations of BPO of some samples which would be compared with the prepared concentrations. At first, 11 prepared samples were selected with their concentrations being 10, 50, 100, 150, 200, 250, 300, 350, 400, 450, 500 mg/kg, respectively. Methanol was adopted to extract BPO, and potassium iodide was used as a reducing agent to restore the BPO to benzoic acid. The experimental procedures were according to the Chinese GB/T22325-2008[Citation23] as follows: Measure 5 g (the accuracy is 0.1 mg) of the prepared samples and place them in colorimetric tubes of 50.0 mL; add 10.0mL of methanol; blend them in vortex mixer for 1 min; lay them still for 5 min, and add 5.0 mL of 50% potassium iodide solution; blend them in vortex mixer for 1 min; lay them still for 10 min; add water up to 50.0 mL; blend, lay still and absorb supernatant fluid through the 0.22 μm membrane filters with filtrate, place them in sample bottles for use. And then make nine copies of benzoic acid standard solutions, the concentrations of them were 0, 5.0, 10.0, 25.0, 50.0, 100.0, 200.0, 400.0, 600.0 μg/mL, respectively, with the benzoic acid as solute and the methanol as solvent. Next, measure nine copies of 5 g pure flour, place them into nine colorimetric tubes of 50 mL and put 10.00 mL of prepared benzoic acid standard solutions of different concentrations into those nine colorimetric tubes, respectively. Deal with those nine colorimetric tubes in the vortex mixer as above, and the final concentrations of the standard solutions were 0, 1.0, 2.0, 5.0, 10.0, 20.0, 40.0, 80.0, and 120.0 μg/mL, respectively. Inject 10.0 μL of benzoic acid standard solutions of different concentrations into the liquid chromatograph (Agilent 1100 series). The parameters of liquid chromatograph were set as follows: the chromatographic column was 4.6 mm × 250 mm, the test wavelength was 230 nm, the proportion between methanol and water (including 0.02 mol/L ammonium acetate) in the mobile phase was 10:90 (volume fraction), the flow velocity was 1.0 mL/min and the injection volume was 10.0 μL. showed the liquid chromatogram of benzoic acid standard solution of 5.0 μg/mL, it could be seen a better peak shape when the elution time was 4.805 min. showed the standard curve with the benzoic acid concentration being the abscissa and the peak area of benzoic acid being the ordinate. Finally, inject 10.0 μL of the sample solutions mentioned above into liquid chromatograph, the parameters of liquid chromatograph were set as above, got the liquid chromatogram of samples, look up the corresponding concentration of the benzoic acid from the curve according to the peak area of benzoic acid, and calculate the concentration of BPO in the samples by Formula 2.1.
FIGURE 1 The liquid chromatogram of benzoic acid standard solution of 5.0 μg/mL.
FIGURE 2 The standard curve of benzoic acid standard solution.
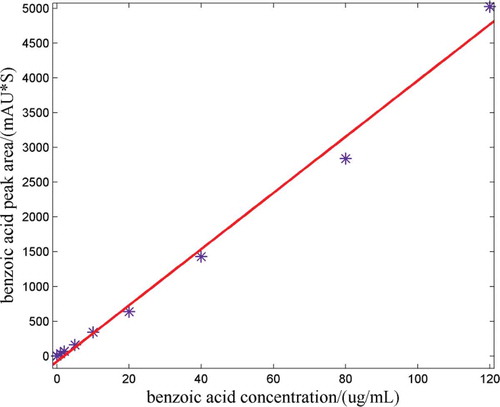
where D is the concentration of BPO in a sample, unit: g/kg, c is the concentration of benzoic acid detected by standard curve, unit: μg/mL, V is the volume of a sample extract, unit: mL, m is the quality of a sample, unit: g. Constant 0.992 is the conversion factor for converting between benzoic acid and BPO: 242.2/(2 × 122.1). Two significant figures would be kept in results.
The measurements of 11 samples were shown in . By analyzing the data in , the recoveries of 11 samples were over than 95% except for the 10 mg/kg concentration sample whose recovery was 90% and the average recovery of 11 samples was 98.1%, which illustrated that the prepared concentrations of samples had high accuracy. In conclusion, the concentrations of BPO prepared in this study could be used as the standard concentrations.
TABLE 1 The comparison between configured concentration and measured concentration of BPO
Calibration Methods and Evaluation of the Model
T detection of leverage and student residual
It is of vital importance to eliminate abnormal samples, since the measuring equipments, test methods, personal operation, or source of samples might lead to the abnormal samples, which could cause maladjustment of models. In general, abnormal samples were composed of two parts: concentration anomaly and spectral anomaly. If the abnormal samples were caused by improper operation or equipment abnormality, the ones should be scanned again when discovered, while they must be eliminated directly if the abnormal samples were caused by themselves. The methods commonly used for eliminating abnormal samples are residual error of predicting concentration,[Citation24] Mahalanobis Distance,[Citation25] T detection of leverage and student residual.[Citation26] In this study, the T detection of leverage and student residual were adopted because their ability of verifying whether concentrations are abnormal or not and the contributions to model are given by samples. All samples were analyzed according to the distribution chart of residuals distribution of the leverage values and the student residuals.
Suppose there was a spectral matrix, where n denoted the number of samples and m denoted the point number of each spectrum. The principal components matrix
would be obtained from the matrix
by means of PCA, and thereafter the hat matrix
could be calculated as follows:
The diagonal element of the hat matrix was the leverage value of sample i, as shown in Formula 2.3, where i is any of one sample.
The leverage value of the sample calculated by this method demonstrated the effects of the sample on the model. Therefore, if the leverage value of sample i was too high, two or three times higher than the average value of the sample set, it indicated that the regression model relied on sample i too much, which was bad for the stability of the model. In other words, sample i might be an abnormal sample. The student residual of a sample demonstrated the predicting ability of the model to this sample. When the number of the principal components was f, the student residual of the sample i was calculated as follows:
where is the prepared concentration,
is the predictive concentration,
is the leverage value.
RBF
RBF can be treated as a question of the surface fitting (approximation) in a high-dimensional space, it can look for a surface best matching the training data in a multidimensional space by learning, the new data inputted into the model are analyzed by the surface. The rationale of RBF is to carry on the back propagation learning by using the recursive technology called stochastic approximation in statistics. RBF neural network is used to build model using the command “newrbe” in this study as its good robustness and self-study ability, it is composed of input layer, output layer, and hidden layer, where the Radbas and a pure linear function (Purelin) were set as the transfer function of hidden layer and output layer, respectively, and the speed was set as 1000.
Model evaluation
R, RMSEP, and ratio of performance to standard deviate (RPD) were taken as indexes to evaluate the model and calculated as follows:
where is the value measured by the standard method,
is the value predicted by model,
is the average value of preparing values, m is the sample number of the prediction set, SD is the standard deviation of the calibration set. The bigger R was and the lower RMSEP was, the higher accuracy of the model was. RPD was used to validate the stability and predictive capacity of the model. RPD > 3 demonstrated that model had a great stability and prediction capacity.[Citation27]
Results and discussion
The Pre-Processing of Spectral Data
The spectral data were pre-processed with different combinations of the first derivative, second derivative, and the standard normal variate (SNV), respectively, to discard irrelevant spectral elements and reduce the amounts of noise and non-significant information. showed the predictive results from RBF model with different pre-processing methods, it could be concluded that when the spectral data in calibration set were pre-processed, the RBF models could achieve good prediction precision and all better than the model having no spectral pre-processing. This was because different pre-treatments of spectra data were performed to evaluate their ability to remove or reduce disturbing effects not related to the chemical absorption of light.[Citation28] Investigated from , the highest R and RPD, and the smallest RMSEP occur in the quantitative prediction by means of RBF model set up by SNV spectra, which showed SNV spectra had the priority over conventional spectra, the first and second derivative spectra. Therefore, the RBF model had the optimal outcome when the spectra data were only pre-processed by SNV.
TABLE 2 The predictive abilities of RBF model with different pre-processing means
The Division of Sample Sets
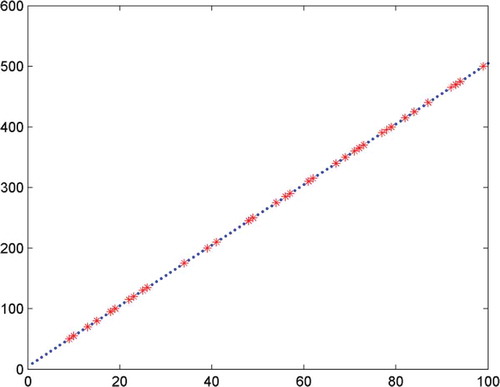
The sample set partitioning based on joint x-y distance (SPXY) algorithm was used to divide sample sets in this study, the 100 samples were divided into two parts in a ratio of 2:1 around 65 representative samples as calibration set and other samples as prediction set, with the former being used to design the calibration model and the latter being used to inspect and evaluate the performance of the model. showed the mean values and the standard deviations of samples in different sets, the data of calibration set were close to that of all samples, which demonstrated that the calibration set had good representativeness, and the mean value and the standard deviation of the prediction set had a big deviation with that of all samples, which illustrated that the prediction set could validate the applicability of model. showed the sample distribution of the calibration set and prediction set. As a general observation of , it is noted that the samples of the calibration set distributed in all samples evenly. Above all, SPXY algorithm was a reasonable method to divide the samples into a calibration set and prediction set.
TABLE 3 The mean value and the standard deviation
FIGURE 3 The distribution of the calibration set and prediction set. (*) the prediction set, (∙) the calibration set.
The Elimination of Abnormal Samples
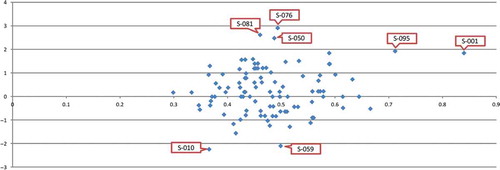
The leverages and student residuals of all samples were calculated, was the distribution map of them with the abscissa being the leverage value and the ordinate being the student residual. Notice from that the location of the sample with number S-001 was center-right compared with other samples, and its leverage value was relatively big; the location of the samples with number S-010, S-050, S-059, S-076, and S-081 deviated from the abscissa axis compared with other samples, and the student residuals were relatively big; the leverage value and student residual of the sample with number S-095 were both relatively big; thus those seven samples above could be categorized temporarily as abnormal samples.
FIGURE 4 The distribution of T detection of leverage and student residual of all the samples.
In order to determine the influence of abnormal samples in the model, the samples would be recycled one by one. Before recycling, it was noted that there was one tentative abnormal sample in prediction set and the other six in the calibration set, since it was uncertain whether they were abnormal or not, pick them out from sets and recycle them one by one to calibration set. First, the sample S-001 was recycled from the seven tentative abnormal samples into calibration set and the other six samples were eliminated, so far, there were 60 samples in the calibration set and 34 samples in the prediction set. Then, prediction models were designed by means of PLS regression, BP neural network, and RBF, respectively, to identify the effects of this sample on models. Finally, the other six samples would be processed likewise and the results were shown in .
TABLE 4 The models performance after recycling abnormal samples one by one
Analyzing the data in , the recycle of samples S-010, S-059, S-076, and S-081 all decreased the performance of PLS model, BP model, and RBF model with R and RPD decreasing and RMSEP increasing, so those four samples were regarded as abnormal samples and should be eliminated. On the contrary, the recycle of sample S-001 and sample S-095 had improved the performance of the three models, thus they should be recycled. As for sample S-050, though it decreased the performance of PLS model and BP model, it had contributions to the RBF model, besides, RBF model was adopted in this study, so sample S-050 was recycled at last.
The Design of Model RBF and the Analysis of the Results
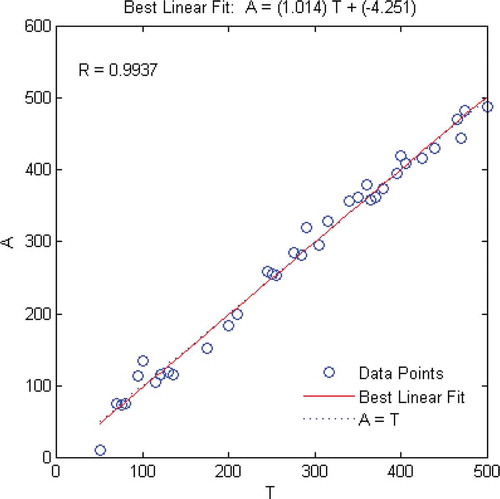
Before modelling, the residual 96 samples were divided into calibration set of 60 samples and prediction set of 36 samples, the two sets were pre-processed by SNV. The RBF model was designed with the spectral data of calibration set as input and the corresponding concentrations of BPO as output, and then it was tested by prediction set. Meanwhile, as a comparison, the models based on PLS and BP neural network were designed. The predictive results of those three models were shown in , as could be seen from the table that the RBF model was the best among those three models by comparing the values of index R, RPD, and RMSEP. The fitting curve between the predicted values of RBF model and the preparing values was shown in , where the diagonal (A = T) meant 100% correct prediction. The more consistent the fitting curve and the diagonal and the closer the data points near the diagonal, the better the prediction performance of the model. It was demonstrated in that the predictive values of samples of prediction set evenly distributed on both sides of diagonal and the fitting curve matched well with the diagonal, which illustrated good predictive effects of the RBF model. showed the preparing values, predictive values, and the absolute errors of 36 samples of prediction set, the data demonstrated that the absolute error of each sample was relatively low except for four samples with the concentrations 50, 100, 175, and 290 mg·Kg–1, respectively, which could be accepted in actual testing, which further verified the better predictive effect of the model.
TABLE 5 The predictive abilities of the different models by the pre-processing SNV
TABLE 6 The predicted results
FIGURE 5 The comparison between the predicted value and the test value.
Conclusion
The NIRS technology was adopted to detect BPO in flour taking place of the conventional chemical measurements, which had greatly improved the analysis speed of the measurement and provided theoretical basis for the speedy detection of BPO. The prediction model was designed based on RBF, abnormal samples were detected using T detection of leverage and student residual, and the predictive accuracy was improved by means of SNV. If spectra data were not pre-processed and the abnormal samples were not eliminated, R, RMSEP, and RPD were 0.9826, 23.0029, and 5.4504, respectively; then, spectra data were pro-processed by SNV, R, RMSEP, and RPD were 0.9906, 17.412, and 7.3762, respectively; on this basis, the abnormal samples were eliminated by T detection of leverage and student residual, R, RMSEP, and RPD were 0.9937, 15.5095, and 8.8216, respectively. It was noted from the evaluation indexes that the precisions were higher after pre-processing spectra data and eliminating abnormal samples. The implementation of the proposed innovative optical approach could be utilized for fast quality control purpose and greatly ensure safety of flour that was not easy reach with conventional techniques.
AcknowledgmentS
The deepest gratitude goes foremost to the Agricultural Products Quality and Safety Research Institute of Heilongjiang Academy of Agricultural Sciences. Thanks for their support on the supply of the materials (flour and BPO) and the technical assistance (the measurement of BPO by physical and chemical methods). At last I also owe my sincere gratitude to my friends and my fellow classmates who helped me overcome the difficult course of the thesis writing.
Related Research Data
References
- Miskelly, D.M. Flour Components Affecting Paste and Noodle Color. Journal of the Science of Food and Agriculture 1984, 35, 463–471.
- Yang, C.-Z.; Zhang, L.; Si, H.-Q.; Chuan, M.-X. Review of Wheat Flour Whiteness. Journal of Triticeae Crops 2002, 22(3), 74–77.
- Yasunaga, T.; Uenura, M. Evaluation of Color Characteristics of Obtained from Various Types and Varieties of Wheat. Cereal Chemical 1962, 39(3), 171–183.
- Chen, Z.; Huang, M. The Use of Flour Brightener and the Safety of Production. Guangzhou Food Science and Technology 1997, 13(3), 36–38.
- Abe-Onishi, Y.; Yomota, C.; Sugimoto, N.; Kubota, H.; Tanamoto, K. Determination of Benzoyl Peroxide and Benzoic Acid in Wheat Flour by High Performance Liquid Chromatography and Its Identification by High Performance Liquid Chromatography Mass Spectrometry. Journal of Chromatography A 2004, 1040(2), 209–214.
- Wei, A.; Dai, H.; Li, G. Properties and Quantitative Determination in Wheat Flour of Benzol Peroxide. Cereal and Food Industry 2003, 3, 49–51.
- Lei, K. The Truth of Flour Additives. China Food-Additive Weekly (Version 1) 2005, 01, 25.
- Li, S.; Liu, Q. The Role and Endangerment of the Benzoyl Peroxide in Wheat Flour. Guangdong Chemistry 2011, 38(9), 96–125.
- Liu, G. The Flour Brightener and Its Application. Grain Processing 2005, 4, 15–18.
- Fu, J. The Brightener Go Back Quietly, the Integrity of the Flour Industry Face the Examination. Grain and Oil Market 2012, B01, 1–2.
- Que, X.; Zhang, N. Research on Measuring the Benzoyl Peroxide Through the Oscillopolarography in Flour. Huaihai Medicine 2008, 26(1), 27–28.
- Bowyer, J.R.; Spurlin, S.R. Chemiluminescence Method for Determination of Benzoyl Peroxide in Solution. Analytica Chimica Acta 1987, 192, 289–292.
- Wang, Y.; Xu, G. Measuring of the Benzoyl Peroxide Through the Iodometry in Flour. China Public Health 2002, 18(2), 170–171.
- Lapchareonsuk, R.; Sirisomboon, P. Sensory Quality Evaluation of Rice Using Visible and Shortwave Near-Infrared Spectroscopy. International Journal of Food Properties 2015, 18(5), 1128–1138.
- Ni, Y.; Mei, M.; Kokot, S. Analysis of Complex, Processed Substances with the Use of NIR Spectroscopy and Chemo Metrics: Classification and Prediction of Properties—The Potato Crisps Example. Chemo Metrics and Intelligent Laboratory Systems 2011, 105(2), 147–161.
- Luo, Y.; Guo, Z.; Zhu, Z.; Wang, C.; Jiang, H.; Han, B. Studies on ANN Models of Determination of Tea Polyphenol and Amylose in Tea by Near-Infrared Spectroscopy. Spectroscopy and Spectral Analysis 2005, 25(8), 1230–1233.
- Herrero Latorre, C. A fast Chemometric Procedure Based on NIR Data for Authentication of Honey with Protected Geographical Indication. Food Chemistry 2013, 141, 3559–3565.
- Zhang, S. A Simple Identification Model for Subtle Bruises on the Fresh Jujube Based on NIR Spectroscopy. Mathematical and Computer Modelling 2013, 58, 545–550.
- Ferreira, D.S. Comparison and Application of Near-Infrared (NIR) and Mid-Infrared (MIR) Spectroscopy for Determination of Quality Parameters in Soybean Samples. Food Control 2014, 35(1), 227–232.
- Zhang, Z. Detection of Benzoyl Peroxide in Wheat Flour by NIR Diffuse Reflectance Spectroscopy Technique. Spectroscopy and Spectral Analysis 2011, 31(12), 3260–3263.
- Haughey, S.A. The Application of Near-Infrared Reflectance Spectroscopy (NIRS) to Detect Melamine Adulteration of Soya Bean Meal. Food Chemistry 2013, 136, 1557–1561.
- Mouazen, A.M.; Al-Walaan, N. Glucose Adulteration in Saudi Honey with Visible and Near Infrared Spectroscopy. International Journal of Food Properties 2014, 17(10), 2263–2274.
- Peng, L.; Li, G.; Geng, X.; Wang, Z.; Jiang, J.; Liu, Q.; Jiang, W.; Chen, L.; Wang, S.; Cao, F.; Xie, X.; Kong, L. Determination of Benzoyl Peroxide in Wheat Flour-High Performance Liquid Chromatography; National Agricultural Standardization Monitoring and Research Center GB/T 22325-2008, Harbin, Heilongjiang Province, China.
- Zhu, S.; Wang, Y.; Wu, J.; Zhang, X. Outlier Sample Eliminating Criterions and Methods for Building Calibration Model of Near Infrared Spectroscopy Analysis. Transactions of the Chinese Society for Agricultural Machinery 2004, 35(4), 115–119.
- Wang, J.; Qiu, Q.; Liu, W. Quality Assessment of Tobacco Flavor by Classification of Principal Component Analysis-Mahalanobis Distance Combined with FTIR-ATR Fingerprint. Spectroscopy and Spectral Analysis 2007, 27(5), 895–897.
- Tian, H.; Wang, C.; Zhang, H.; Yu, Z.; Li, J. Outlier Sample Discriminating Methods for Building Calibration Model in Melons Quality Detecting Using NIR Spectra. Spectroscopy and Spectral Analysis 2012, 32(11), 2987–2990.
- Nicolai, B.; Beullens, K.; Bobelyn, E.; Peirs, A.; Saeys, W.; Theron, K.; Lammertyn, J. Nondestructive Measurement of Fruit and Vegetable Quality by Means of NIR Spectroscopy: A Review, Postharvest. Biology and Technology 2007, 46(2), 99–118.
- Qu, N.; Mi, H.; Wang, B.; Ren, Y. Application of GA-RBF Networks to the Nondestructive Determination of Active Component in Pharmaceutical Powder by NIR Spectroscopy. Journal of the Taiwan Institute of Chemical Engineers 2009, 40, 162–167.