
Abstract
This study focuses on the quantification of virgin olive oil phenolic compound while using mid-infrared spectroscopy with chemometrics. For that, 100 samples of virgin olive oils in phenolic compounds which varied between 1.04 and 10.33 g/L were picked up in Morocco’s regions and subjected to infrared analysis. The aim was to develop a calibration model for the prediction of phenolic compounds in olive oil by using Fourier transform-infrared spectroscopy. The spectral transmissions of all samples were obtained in the spectral range of 600–4000 cm–1. The values obtained for correlation coefficient and root mean square errors of prediction were 0.99 and 0.11, respectively. These results showed the capability of the Fourier transform-infrared spectroscopy and the chemometric in developing accurate models to predict the phenolic compounds in virgin olive oil.
Introduction
Phenolic compounds, usually termed as polyphenols, are important constituents in human diets.[Citation1] Their antioxidant properties and their positive role in the prevention of chronic diseases are well known.[Citation1,Citation2] Phenolic compounds are natural antioxidants and are considered key factors in evaluating the quality of an extra-virgin olive oil (VOO). They are partially responsible for its auto-oxidation stability and organoleptic characteristics.[Citation3] The phenolic content of a VOO is influenced by the cultivar location, degree of ripeness, storage conditions of olive fruits, as well as the procedure of oil extraction and the storage conditions.[Citation4]
Usually the determination of total polyphenol content is carried out by spectrophotometric, high-performance liquid chromatography, gas chromatography, and gas chromatography–mass spectrometry (GC–MS).[Citation5–Citation9] Most of these analyses are time-consuming, expensive, and involve a considerable amount of manual work. It requires complex chemical treatment of samples and the use of sophisticated instruments.[Citation10] Recently, Fourier transform infrared (FT-IR) spectroscopy emerged as a well-accepted analytical technique due to its simplicity and low sampling cost. In addition, this technique achieves high analysis speed and requires little or no sampling preparation. Until recently, much of the published studies on the use of near and mid FT-IR spectroscopy were focused on the authentication and the classification of many agro-foods, notably olive oils[Citation11,Citation12] and table olives[Citation13] by multi-variant statistical analysis on spectral data. Moreover, Fourier transform mid-infrared (FT-MIR) has been applied to analyze extra VOO adulterated with palm oil[Citation14] and the determination of quality parameters of VOO.[Citation15]
The aim of this study was to develop a direct and rapid test method using the FT-MIR spectroscopy associated with chemometric treatment to quantify total polyphenol content in olive oil. The approach can be considered as fast, clean, and affordable method.
Materials and methods
Olive Oil Sampling
One hundred samples of VOOs were collected for this study between December 2013 and January 2014 in the Beni Mellal area (center of Morocco). All samples were analyzed just after extraction by FT-IR in a range from 4000 to 600 cm–1. A set of 70 samples was selected randomly to build up the calibration model while the other 30 samples were used for the validation purpose.
FT-MIR Analysis
FT-IR spectra are obtained using a Vector 22 Bruker FT-IR Spectrophotometer equipped with an attenuated total reflectance accessory (ATR single-reflexion, Diamond, incident angle 45°), DTGS detector, Globar (MIR) source, and KBr Germanium separator with a resolution of 4 cm−1 at 98 scans. Spectra are scanned in the absorbance mode from 4000 to 600 cm−1 and the data are handled with OPUS logiciel. Analyses are carried out at room temperature. The background is collected before each sample and measured. Before the chemometric analyses (principal component analysis [PCA] and partial least square [PLS]), the data were pre-processed by taking first derivative of the absorbance spectra for the baseline removal using the Savitzoky-Golay method with a second order polynomial and 27 smoothing points. The PCA and PLS regression were performed using the Unscrambler version 10.1.
Determination of Total Polyphenols
The total polyphenols were determined by monitoring their ability to reduce acid phosphotungstic and phosphomolybdic contained in the Folin detungstène and molybdenum oxides. These present a bluish coloration measured at 760 nm.
The Folin–Ciocalteu method[Citation16] was used to determine total phenolic content. Thus, 1 mL of oil is mixed with 9 mL of a methanol/water mixture (25/75). Then, the mixture was placed on a vortex for 1 min for the extraction of polyphenols in methanolic medium. Afterward, 1 mL of dichloromethane was added to allow the oil to pass in the part of lower phase and facilitates the collection of 9 mL of methanolic supernatant. Then, we added 1 mL of Folin diluted 10-fold in water and we kept the mixture at room T°2 min before adding a 1 mL of sodium carbonate (75 g/L). The mixture is heated 15 min at 50°C and then analyzed at 760 nm.
The external calibration using gallic acid between 0 and 500 mg/L of methanol-water mixture (0, 100, 200, 300, 400, and 500 is directly mixed with the Folin).[Citation16] For the gallic acid, the curve absorbance versus concentrations is described by the equation:
PCA and PLS Regression
PCA was carried out to detect the presence of any spectral outliers in the spectral data prior to develop a prediction model using PLS regression. Primarily, PCA is a feature reduction mathematical procedure that can be useful to provide basis for the other multivariate linear regression analyses such as the PLS regression.[Citation17] It reduces the dimensionality of the data and forms a n×p covariance matrix, where n is the number of spectra of the soil samples analyzed and p represents the absorbance values. In PCA, the Eigen spectra and their respective eigenvalues are calculated. The numbers of components in the data are then reduced to a smaller group of principal components, termed as PCAs.[Citation18]
PLS is a supervised analysis. It is based on the relation between the signal intensity and the characteristics of the sample.[Citation19] Interference and overlapping of the spectral information may be overcome by using powerful multicomponent analysis such as PLS regression. PLS[Citation20] allows a sophisticated statistical approach using spectral region rather than unique and isolated analytical bands. The first step is to perform a calibration model. This involves collecting a set of reference calibration samples containing all expected chemical and physical variations that will be predicted later.
PLS attempts to maximize the covariance between two data blocks X and Y. PLS searches for the factor subspace most congruent to both data blocks, and its predictions are usually better than using other multilinear regressions (MLR) methods such as MLR, especially when a large number of collinear variables are present in the X data block. A new matrix of weights (reflecting the covariance structure between the X predictors and Y response variables) is calculated which provides rich factor interpretation and information for each latent variable independently.
The evaluation of the errors in the calibration is estimated by computing the standard error of calibration (SEC) after comparing the real concentration with the computed one for each component. The formula for the SEC is (reference):
where Ci coefficients are the known values, Cʹi are the calculated values, N is the number of samples, and p is the number of independent variables in the regression optimized by cross validation.
The standard error of prediction (SEP) gives an estimation of the prediction performance during the step of validation of the calibration equation:
where Ci are the known values, Cʹi are the values calculated by the calibration equation, and M is the number of samples in the prediction set. Another useful parameter is the relative error of prediction (REP %) that shows the predictive ability of the model. This is calculated from the equation:
Quality assessment of the obtained results is discussed by comparing predicted and measured values, both for calibration and validation data sets. All chemometrics calculations were performed using the Unscramble x software version 10.1 from CAMO (Computer Aided Modeling, Trondheim, Norway) was used for chemometric treatments of FTIR-ATR data spectra.
The predictive ability of the model is also expressed by the calculation of the bias and the square of correlation coefficient (R2) usually called Q2 in the prediction. Regression coefficients are the numerical coefficients expressing the link between the predictor variations and the response variations. The bias is the systematic difference between predicted and measured values. The bias is computed as average value of the residuals. The residual is the measure of the variation which is not taken into account by the model. The residual for a given sample and a given variable is computed as the difference between observed value and fitted (projected or predicted) value of the variable on the sample.
Results and discussion
Typical FT-IR Spectra of VOO
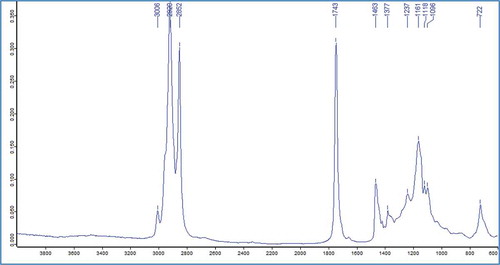
FT-IR spectra obtained for 100 samples of VOO are simulated by visual inspection. exhibits MIR spectra of VOO at frequency region of 4000–600 cm–1. The assignment of functional groups responsible for IR absorption is as follows: 3006 cm–1 (trans =C–H stretch), 2920 and 2852 (symmetrical and asymmetrical stretching of –CH2), 1743 (–C=O stretch), 1463 (–CH2 bending), 1377 (–CH3 bending), 1237 (–C–O stretch), 1161 (–C–O stretch; –CH2 bending), 1118 (–C–O stretch), 1096 (–C–O stretch).[Citation21,Citation22] The absorption bands of most important compounds of phenols and tocopherols was localized in the n 722 cm–1 wavelength (–(CH2)n– –HC=CH-bending out of plane).[Citation23]
Figure 1 The absorbance spectra of a virgin olive oil in the MIR spectral region (4000–600 cm–1).
PCA
Previous studies indicate that PCA is a useful tool for the identification of spectral outliers in the absorbance spectra of the samples and can be employed to increase the quality of the prediction-model.[Citation24] The PCA was performed on the (first derivative pretreated) absorbance spectra of all olive oil samples (n = 100) which enabled to detect two spectral outliers in the data (as circled in ). The absorbance spectra of these samples (spectral outlier) was included in the preliminary calibration model (not shown) but excluded from the PLS analysis performed to develop a final calibration model (as described next).
Figure 2 Principal component analysis (PCA) performed on the (first derivative pre-treated) absorbance spectra of all olive oil samples (n = 100). The red filled circles are the two spectral outliers in the olive oil samples. PC-1: principal component-1; PC-2: principal component-2.
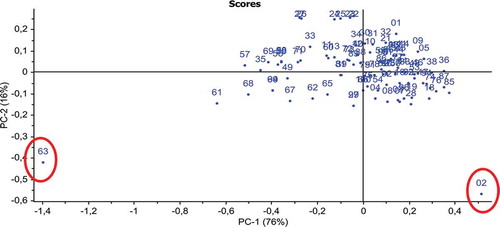
The data set contained 100 olive oil samples including two spectral outliers identified using PCA (). After excluding the spectral outliers, the remaining 98 samples were randomly split into two sets. One (calibration set) set of samples (n = 68) was used for constructing MIR-PLS calibration model and the second set (n = 30) was used for the validation of the calibration model (hereafter, referred as the validation set).
PLS Modeling
The PLS model is built by considering the spectra of VOO at frequency region of 3050–600 cm–1 where X variables and the Y variables are associated to the total polyphenol content. The PLSR models are evaluated using coefficient of determination (R2) in the calibration, root-mean-square error of calibration (RMSEC) and cross validation (RMSECV). The performance of the PLSR models on the independent validation set is evaluated using R2, root mean square errors of prediction (RMSEP) and the residual prediction deviation (RPD).
Here, the criteria of classifying RPD values[Citation25] is adopted as follows (reference):
RPD < 1.5: the calibration is not usable;
1.5 < RPD < 2.0 there is a possibility of differentiating between high and low values.
2.0 < RPD < 2.5: there is a possibility of making approximate quantitative predictions.
2.5 < RPD: The prediction is classified as good and excellent. Generally, a good model should have high values of R2 and RPD, and low values of RMSEC, RMSECV, and RMSEP
The results show the robustness of the model to determine the total polyphenol content for 68 samples of olive oils. As it can be seen in .
Figure. 3 Plot of the predicted and measured values for total phenolic content, obtained from the final PLS model developed from the MIR spectra.
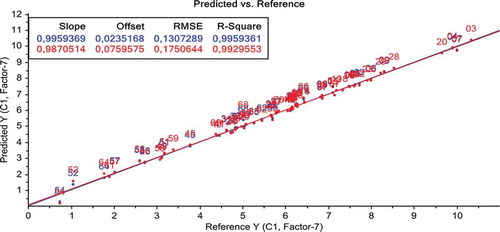
The PLS model is validated by a full cross validation. The obtained statistical parameters RMSEC, RMSECV, and R2 are summarized in . The coefficient of determination (R2) of 0.99, RMSEC of 0.13, and RMSECV of 0.17 can be considered satisfactory.
Seven VLs are necessary to have a good PLS performance. lists the explained variances from the developed model.
Table 1 Explained variances (%) of PCs used in the PLS model
Validation of MIR-PLS Model
The validity of the resulting preliminary and the developed calibration model based using the set of 68 samples, were tested using a validation set of the unknown olive oil samples (). The prediction equation obtained from the final calibration model (n = 68; ) was applied to the validation set in order to calculate the statistical parameters related to the estimation of total phenolic content in unknown olive oil samples. The obtained results are given in and .
Table 2 Prediction of total phenolic content of external validation
Table 3 Statistical parameters carried out by external validation on PLS
shows clearly that the FTIR-PLS method is an effective method for the determination of total polyphenol content in VOO. The results indicate that there is no significant difference between the reference methods and the proposed one. Therefore, the PLS model for the FT-IR data treatment appears to be an appropriate approach to predict the fraction phenolic in VOO.
Conclusion
PLS-R calibration models developed in the 1.04 and 10.33 g/L concentration calibration range w/w, gave less than 2% relative error for external validation samples. Therefore, we can conclude that the FT-IR spectra of olive oil can be properly modeled by PLSR using first the derivation of the absorbance spectra for the baseline removal using the Savitzoky-Golay method, with a second order polynomial and 27 smoothing points as initial data pretreatments. This study had also underlined that the spectral region 3050–600 cm–1 was useful for good predictions of total polyphenol content.
FT-IR spectroscopy coupled to chemometrics techniques is reported as an adequate method for the determination of total polyphenol content in olive oil, without any previous sample pretreatment and any destructive sampling manipulation.
Therefore, the proposed spectroscopic method provides a convenient alternative in terms of time and solvent saving for routine analysis of large number of VOO samples. This approach can be considered fast, clean, and affordable methodology.
Related Research Data
References
- Krystyna, P.; Aleksandra, S. Recent Developments in the HPLC Separation of Phenolic Food Compounds. International Journal of Food Properties 2015, 45, 41–51.
- Višnja, K.; Sonja, S.M.; Ivana, G.; Danijela, S.; Ivica, L.; Anja, K. Phenolic Profile, Antioxidant Capacity, and Antimicrobial Activity of Leaf Extracts from Six Vitis vinifera L. Varieties. International Journal of Food Properties 2013, 16, 45–60.
- Capannesi, C.; Palchetti, I.; Mascini, M.; Parenti, A. Electrochemical Sensor and Biosensor for Polyphenols Detection in Olive Oils. Food Chemistry 2000, 71, 553–562.
- Nergiz, C.; Unal, K. Effect of Method of Extraction on the Total Polyphenol, 1, 2-Diphenol Content, and Stability of Virgin Olive Oil. Journal of Science Food Agriculture 1991, 56, 79–82.
- Carrasco-Pancorbo, A.; Cerretani, L.; Bendini, A.; Segura-Carretero, A.; Gallina-Toschi, T.; Fernandez-Gutiérrez, A. Analytical Determination of Polyphenols in Olive Oils. Journal of Separation Science 2005, 28, 837–858.
- Montedoro, G.F.; Servili, M.; Baldioli, M.; Miniati, E. Simple and Hydrolysable Phenolic Compounds in Virgin Olive Oil. 1. Their Extraction, Separation, and Quantitative and Semi-Quantitative Evaluation by HPLC. Food Chemistry 1992, 40, 1571–1576.
- Mannino, O.S.; Cosio, M.S.; Bertulocci, M. High Performance Liquid Chromatography of Phenolic Compounds in Virgin Olive Oils Using Amperometric Detection. Italian Journal of Food Science 1993, 2, 150–157.
- Barták, P.; Frnková, P.; Cáp, L. Determination of Phenols Using Simultaneous Steam Distillation-Extraction. Journal Chromatography A 2000, 867, 281–287.
- Tasioula-Margari, M.; Okogeri, O. Isolation and Characterization of Virgin Olive Oil Phenolic Compounds by HPLC/UV and GC-MS. Journal of Food Sciences 2001, 66, 530–534.
- Hirri, A.; Bassbasi, M.; Oussama, A. Classification and Quality Control of Lubricating Oils by Infrared Spectroscopy and Chemometric. International Journal of Advanced Technology and Engineering Research 2013, 3, 359–362.
- Sinelli, N.; Cerretani, L.; Di Egidio, V.; Bendini, A.; Casiraghi, E. Application of Near (NIR) Infrared and Mid (MIR) Infrared Spectroscopy As a Rapid Tool to Classify Extra Virgin Olive Oil on the Basis of Fruity Attribute Intensity. Food Research International 2010, 43, 369–375.
- Terouzi, W.; De Luca, M.; Bolli, A.; Oussama, A.; Patumi, M.; Ioele, G.; Ragno, G. A Discriminant Method for Classification of Moroccan Olive Varieties by Using Direct FT-IR Analysis of the Mesocarp Section. Vibrational Spectroscopy 2011, 56, 123–128.
- Casale, M.; Zunin, P.; Cosulich, M.E.; Pistarino, E.; Perego, P.; Lanter, S. Characterization of Table Olive Cultivar by NIR Spectroscopy. Food Chemistry 2010, 122, 1261–1265.
- Rohman, A.; Che Man, Y.B. Fourier Transform Infrared (FTIR) Spectroscopy for Analysis of Extra Virgin Olive Oil Adulterated with Palm Oil. Food Research International 2010, 43, 886–892.
- Maggio, R.M.; Kaufman, T.S.; Del Carlo, M.; Cerretani, L.; Bendini, A.; Cichelli, A.; Compagnone, D. Monitoring of Fatty Acid Composition in Virgin Olive Oil by Fourier Transformed Infrared Spectroscopy Coupled with Partial Least Squares. Food Chemistry 2009, 114, 1549–1554.
- Vernon, L.; Singleton, R.O.; Lamuela-Raventós, R.M. Analysis of Total Phenols and Other Oxidation Substrates and Antioxidants by Means of Folin-Ciocalteu Reagent. Methods in Enzymology 1999, 299, 152–178.
- Forouzangohar, M.; Kookana, R.S.; Forrester, S.T.; Smernik, R.J.; Chittleborough, D.J. Mid-Infrared Spectroscopy and Chemometrics to Predict Diuron Sorption Coefficients in Soils. Environmental Science and Technology 2008, 42, 3283–3288.
- Haaland, D.M., Thomas, E.V. Partial Least-Squares Methods for Spectral Analyses. 2. Application to Simulated and Glass Spectral Data. Analytical Chemistry 2002, 16, 1202–1208.
- Beebe, K.R.; Kowalski, B.R. An Introduction to Multivariate Calibration and Analysis. Analytical Chemistry 1987, 59, 1007–1017.
- Fuller, M.P.; Griffiths, P.R. Diffuse Reflectance Measurements by Infrared Fourier Transform Spectrometry. Analytical Chemistry 1978, 50, 1906–1910.
- Guillen, M.D.; Cabo, N. Characterization of Edible Oils and Lard by Fourier Transform Infrared Spectroscopy Relationships Between Composition and Frequency of Concrete Bands in the Fingerprint Region. Journal of the American Oil Chemists Society 1997, 74, 1281–1286.
- Lerma-Garcia, M.J.; Ramis-Ramos, G.; Herrero-Martinez, J.M.; Simi-Alfonso, E.F. Authentication of Extra Virgin Olive Oils by Fourier-Transform Infrared Spectroscopy. Food Chemistry 2010, 118, 78–83.
- Cozzolino, D.; Murray, I.; Chree, A.; Scaife, J.R. Multivariate Determination of Free Fatty Acids and Moisture in Fish Oils by Partial Least-Squares Regression and Near-Infrared Spectroscopy. LWT–Food Science and Technology 2005, 38, 821−828.
- Pirie, A.; Singh, B.; Islam, K. Ultra-Violet, Visible, Near-Infrared, and Mid-Infrared Diffuse Reflectance Spectroscopic Techniques to Predict Several Soil Properties. Australian Journal of Soil Research 2005, 43, 713–721.
- Mouazen, A.M.; Baerdemaeker, J.D.; Ramon, H. Effect of Wavelength Range on the Measurement Accuracy of Some Selected Soil Constituents Using Visual-Near Infrared Spectroscopy. Journal of Near Infrared Spectroscopy 2006, 14, 189–199.