
 ?Mathematical formulae have been encoded as MathML and are displayed in this HTML version using MathJax in order to improve their display. Uncheck the box to turn MathJax off. This feature requires Javascript. Click on a formula to zoom.
Abstract
This study evaluated the effect of the thermal and high electric field stresses on the secondary structure conformation of peanut protein using Fourier transform infrared spectroscopy. The amide I region between the wavelengths 1700–1600 cm–1 of the spectra were studied for different thermal and high electric field treatments. Within thermal treatments, both hot air roasting and microwave processing treatments were evaluated. Hot air treatments were performed at temperatures of 50, 75, and 100°C from 15, 30, and 45 min while the microwave treatments were conducted at the same temperatures, but for 5, 10, 15, and 20 min. Three experimental conditions were evaluated for the electric field intensity of 10, 15, and 20 kV for 60, 120, and 180 min. Changes were observed at 1654–1650 cm–1, indicating conformational changes in the α-helix secondary structure. Similar changes were observed at various other wavelengths indicating changes in the 3/10 helix, β-sheets and random coils present in the protein. With an increase in the treatment time, the secondary structure reorganizations increased with the creation of new random coils and aggregated strands. Curve-fitting using Gaussian band shapes further supported the observations. In vitro protein digestibility studies were also performed and the protein changes also supported the observations from the spectra.
Introduction
Peanuts are considered as energy-dense foods and are consumed all over the world. They are also a rich source of proteins and fiber.[Citation1–Citation5] However, with the turn of the century, the peanut allergy has become one of the most important health concern in various developed countries primarily due to globalization and gene-related factors.[Citation6,Citation7] Apart from the peanut; wheat, tree nuts, fish, egg, soy, and shell fish account for most of the food allergies encountered around the world.[Citation8,Citation9] Allergic reactions have also been observed with consumption of few fruits and vegetables like apple,[Citation10–Citation12] cherry,[Citation13–Citation15] and celery.[Citation16–Citation18] Currently, about 2–8% of the infants and children in North America suffer from some type of food allergies, this is on an alarming rise and has to be addressed quickly.[Citation19–Citation21] For the food industries, it is important from a food safety perspective, to keep the allergy causing components at bay from the processing chain. Novel products and substitutes have to be developed which cater the needs of the allergen sensitive population; the thrust, therefore, should be toward commercialization of new and safe products.
Many physio-chemical properties of food are governed by their protein structure. Recent studies have provided a vital insight in to understanding the effects of specific changes in the protein secondary structures and their effect on the functional and chemical properties.[Citation22–Citation29] Though various analytical and modelling methods have been used to study changes in the protein structures, use of Fourier transform infrared spectroscopy (FTIR) is widely adopted and accepted in the scientific community.[Citation30] The repeating units in the protein normally give rise to nine characteristic IR absorption bands which are called A, B, and I–VII. The most important for studying the protein backbone among the above mentioned bands are I and II vibrational bands.[Citation31–Citation34] Among the two, the amide band I is the most sensitive, ranging between the wavelengths of 1700 to 1600 cm–1 that accounts for about 80% of the peptide linkages, i.e., C=O stretch. Thus, the frequency of the amide I region is highly associated with the secondary structures of the protein.[Citation31,Citation35] The amide II band deals primarily with the NH bending and CN stretching vibrations and is less sensitive when compared to the amide I region. Depending on the force fields, hydrogen bonds and the other vibrational bands are very complex to evaluate. They are used rarely in the protein conformation studies.[Citation36,Citation37]
Koppelman et al.[Citation38] studied the effects of thermal processing on the secondary, tertiary and quaternary structures of Ara h 1 (Arachis hypogaea–Ara h) which is a major peanut allergen. This study revealed that processing purified Ara h 1 between temperatures of 80 and 90°C resulted in irreversible changes within the secondary structures. But, it was also shown that the thermal processing method did not have any effect on the IgE binding capacity and thus, the allergenicity of the compound was similar to that of the native Ara h 1 allergen. Though considerable deviations were observed in the structural conformation, the allergic character of the Ara h 1 appears to be very stable. Digestion studies were performed on Ara h 1 by Maleki et al.[Citation39] which showed that the surface accessible hydrophobic amino acid residues are very stable and protected, thus remain unaffected by the processing.
Along with thermal processing evaluation, effect of high electric field on the protein structure has also been evaluated in this article. The use of this novel technology is on rise due to its inherent advantages over conventional processing techniques. Hence, it is necessary to understand how these novel processing techniques affect the protein secondary structures.[Citation30] To help us understand the impact of processing on peanut protein, this study uses FTIR to understand the changes in the secondary structure of the overall protein followed by an in vitro protein digestibility (IVPD) study to understand the structure and functional relation of various thermal and high electric field processing.
Materials and methods
Peanuts (Valencia variety) were bought from Kernal Peanuts, Ontario, which had an initial moisture content of 9.3% on a wet basis. The moisture was determined by drying the peanut powder in an oven at 105°C for 24 h, after which the weight became constant. Fresh peanut flour was prepared to facilitate the processing before subjecting it to thermal and high electric field treatments.
Solvents and Reagents
All reagents and solvents used were of high-performance liquid chromatography (HPLC) grade from Fisher Scientific (Ottawa, ON, Canada). The enzymes employed for the IVPD % determination were purchased from Sigma Aldrich (Oakville, ON, Canada).
Oven Roasting
For oven roasting, the peanut flour was evenly spread on aluminum dishes, and they were placed in the oven which was pre-set to the processing temperatures of 50, 75, and 100°C. The roasting was done for 15, 30, and 45 min in the oven. After cooling to room temperature, the samples were stored at 4°C until further analysis was conducted.[Citation38,Citation40] All the experiments were conducted in triplicate.
Microwave Heating
The peanut flour was placed in glass beakers and exposed to microwaves at a power density of 2 W/g for 5, 10, 15, and 20 min in a conventional microwave oven. The samples were processed at temperatures of 50, 75, and 100°C similar to the oven roasted samples. The temperature was maintained within the range of 2°C above or below the set values. The processed samples were then taken out and were cooled to room temperature. These were stored at 4°C in air-tight containers for further analysis.
Electric Field Treatment
The apparatus used consists of two parallel electrodes that are connected to a General Electric Ignition Transformer and a Superior Electric Co. Powerstat adjustable transformer. The required electric fields of 10, 15, and 20 kV between the two parallel electrodes was adjusted using the powerstat transformer which modulated the input AC voltage. A solid copper wire with a diameter of 0.05 cm was used as the top electrode and a copper plate was used as the ground electrode. A sample of about 5 g was placed in between the electrodes using specially designed sample box to hold it in place. These samples were exposed to the electric field strengths of 10, 15, and 20 kV for 60, 120, and 180 min. The distance between the electrodes (wire-to-plate configuration) was fixed to one centimeter. The wire electrode was placed about 0.8 cm from the surface of the sample. The samples were subjected to the electric field before they were analyzed further.
FTIR Spectroscopy
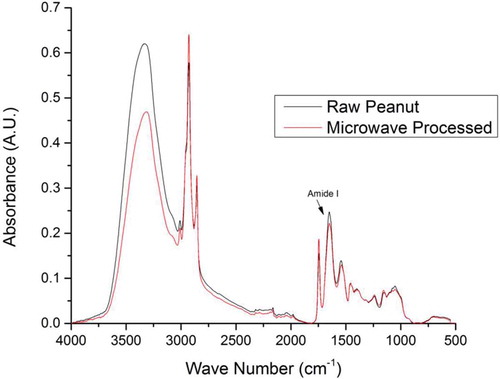
All the FTIR spectral analysis of the peanut samples was conducted using the Nicolet iS5 attenuated total reflectance (ATR)-FTIR spectrometer. The processed samples were kept on the diamond crystal and were secured tightly with a clamp for the IR analysis. For all the samples (thermal and high electric field), 32 spectra at 4 cm–1 resolution were averaged to give the final spectrogram. The spectra of an empty ATR diamond acted as the background reference. The spectra was analyzed using OMNIC software (version 8, Thermo Nicolet Instrument Corp., Madison, WI, USA) and OriginPro (Version 9, OriginLab Corporation, Northampton, MA, USA). The spectra of treated sample was compared to the spectra of untreated sample (as shown in ) highlighting the amide I region used in analysis.
FIGURE 1 FTIR spectrum of raw and microwave processed (100-15) peanut samples.
IVPD (Multi-Enzyme Method)
The IVPD of the peanut protein was evaluated using the three-enzyme method.[Citation41–Citation43] A multi-enzyme mixture was prepared, containing 1.6 mg/mL trypsin, 3.6 mg/mL chymotrypsin, and 1.3 mg/mL peptidase and its pH was adjusted to 8.0. This mixture was placed in an ice bath and continuously stirred. A working protein suspension was prepared by dissolving samples to yield about 312.5 mg of protein in 50 mL of distilled water whose pH was also adjusted to 8.0. The pH adjustments were done using 0.1N NaOH and 0.1N HCl. Five milliliters of the multi-enzyme solution was added to the samples which was maintained at 37°C in a water bath for digestion with continuous stirring. The pH was measured after about 10 min of digestion and the IVPD was calculated using the Eq. (1).[Citation41]
Statistical Analysis
The analyses of variance (ANOVA) of the samples were performed using JMP software (ver. 11, SAS Institute Inc., Cary, NC, USA). The fitness of each model for the full factorial design was carried out using Tukey HSD method at 95% confidence (p ≤ 0.05) level. The data is tabulated in accordance with Kalkan et al.[Citation44]
Experimental Design
Specific notations have been used in this manuscript to indicate the various processing methods. These notations have been tabulated below in , , and and the same format has been followed throughout the script. (Example: 50–15 represents processing of the sample at 50°C for 15 min).
TABLE 1 Notations for representing (a) the hot air roasting of peanut samples (b) the microwave roasting of peanut samples (c) the high electric field processing of peanut samples
Results and discussions
FTIR Analysis of Conformational Changes in Peanut Protein
FTIR spectroscopy was used to study the effects of thermal and high electric field processing on the peanut protein conformation. In this study, only the amide I region of the peanut protein is investigated which is one of the most sensitive and most useful for the interpretation of the secondary structures of the protein.[Citation31] presents the FTIR spectra obtained for the raw and microwave processed peanut samples between the regions of 4000 to 500 cm–1.
The amide I band lies between the wavelengths of 1700–1600 cm–1 and it includes component overlapping bands of various secondary structures including α-helices, β-sheets, turns, and randomly coiled conformations.[Citation31,Citation45] This is mainly related to the C=O stretching vibrations coupled with the in-plane NH bending. This region also influences the hydrogen bond patterns and thus primarily determines the backbone secondary structure of the protein.[Citation31,Citation46] Previous researchers have obtained the correlations between the amide I frequency and the secondary structures as shown in .
TABLE 2 Amide I band frequencies and corresponding protein secondary structure correlations (Adapted from [Carbonaro et al., 2008; Georget & Belton, 2006; Jackson & Mantsch, 1995; Kong & Yu, 2007; Menéndez et al., 1995])
The normalized spectra of hot air, microwave, and electric field processed samples of peanut protein amide I region, respectively (supplement materials). Distinct peaks were observed in the regions of 1633–1640 cm–1 (β-sheets), 1645–1647 cm–1 (random coils), 1652–1657 cm–1 (α helix), 1660 cm–1 (α helix), 1664–1667 cm–1 (turns), 1682–1696 cm–1 (anti parallel β-sheets). The bands at 1608 cm–1 have been excluded from our study to improve the clarity of the results as their absorbance band typically starts at 1595 cm–1 which falls outside the amide I region. The relocations of the structure at this band increased as the samples were processed for a longer time or at higher temperature. The data analysis showed that the maximum relocation in the secondary structure conformation at different wavelengths was observed in the samples that were subjected to longer processing time.
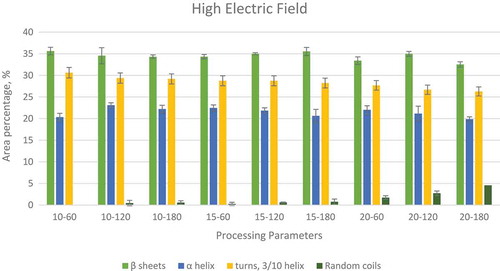
In order to understand the effects of various processing methods on the protein secondary structure conformation, a curve fitting procedure was applied using OriginPro (Version 9, Origin Lab Corporation, Northampton, MA, USA). The software was used to minimize the sum of squares of the differences between various experimental spectra and the calculated spectra created by the summation of the component curves. The second derivative spectra was created by the software, which was used in identification of the component bands which give the results in terms of the peak areas at corresponding wave lengths. Both the normalization and the curve fitting for finding the specific peaks were done separately for each of the processing methods. shows the changes in the peak areas as the processing time increases form 15 to 30 min and then to 45 min at three different temperatures. shows the peak areas for microwave processed samples at 50, 75, and 100°C for 5, 10, 15, and 20 min of processing. shows the peak areas for high voltage electric field processing at 10, 15, and 20 kV for processing times of 60, 120, and 180 min.
FIGURE 2 Variations in relative areas of the bands fitted to the normalized FTIR spectra of the Amide I region (1700–1600 cm–1) of hot air roasted peanuts.
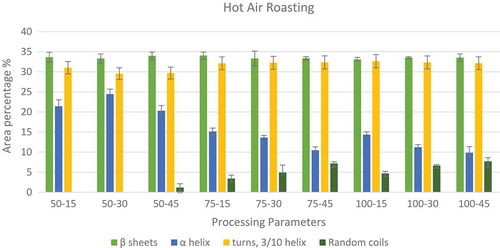
FIGURE 3 Variations in relative areas of the bands fitted to the normalized FTIR spectra of the amide I region (1700–1600 cm–1) of microwave roasted peanuts.
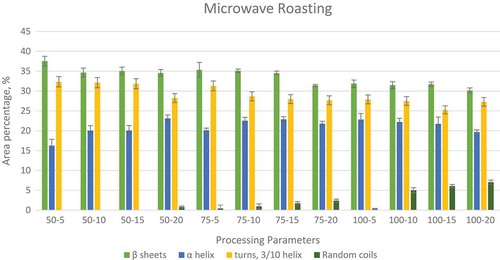
FIGURE 4 Variations in relative areas of the bands fitted to the normalized FTIR spectra of amide I region (1700–1600 cm–1) of high electric field processed peanuts.
From the data presented in , it is observed that for almost all of the experiments the β sheets and the α-helix are major secondary structures accounting for about 50–55% of the total secondary structure. The turns and the 3/10 helices together account for about another 30% which have overlapping wavelenghts between 1662–1672 cm–1 (as shown in ).
It was observed that as the processing time incresed from 15 to 45 min, there was a relocation in the α-helix structures with an exception of 50–30, where there was a slight rise in the area of the peaks assigned to α-helices. This reduction resulted in a growth of random coil secondary structures, which were absent initially in the 50–15 and 50–30 processing, but appeared later as both the temperature and the time of processing increased. There was also a slight relocation in the anti-parallel β sheets (not shown in ), which suggests that there was formation of protein aggregates with increasing temperature. Similar results were observed in wheat gliadin protein when processed at increasing temperatures.[Citation46,Citation47]
The data corresponding to the microwave processing of nuts in also showed that the major secondary structures in the peanut protein are β-sheets and α-helix accounting to approximately 55%. But unlike with hot air roasting, microwave roasted peanut proteins showed no particular trend in the areas of α-helix peaks. When processing time was increased from 5 to 20 min at 50°C, there was an increase in the α-helix from about 16.24 to 23.1% which is similar to that of the hot air roasting between 15 and 30 min at 50°C, which showed a rise in the α-helix from 21.41 to 24.43%. On processing peanuts at 100°C, there was again a relocation in α-helix peaks resulting in their peak areas falling from 22.83 to 19.86%. In , it was observed that microwave processing also resulted in an increase in random coils within the protein secondary structure similar to hot air roasting. This result was first observed in 50–20 samples, but with an increase in the processing time and temperature, there was a gradual rise observed in the random coils from 0.42 to 2.39% for samples processed at 75°C and from 0.34 to 7.03% for samples processed at 100°C in a microwave. This increase can be attributed to the relocations in the β-sheet and 3/10 helix secondary structures.
In the high voltage electric processing, a corona wind is generated by passing high voltage through a very thin electrode. This corona wind bombards charged particles onto the food material resulting in changes in their secondary structure.[Citation30,Citation48] This corona wind resulted in formation of random coils in the protein similar to microwave and hot air processing of peanut protein. In the case of α-helix, there is no particular trend in the case of 10 kV, but for 15 and 20 kV processing, it was observed that there is a slight decrease in the peak areas. A similar trend was also observed for turns and 3/10 helix at 10, 15, and 20 KV as shown in . The results indicate that electric field processing effects the turns and 3/10 helix compared to β-sheet and α-helix. But, further work has to be done to verify this observation. The authors predict that if samples are treated at higher voltage (>20kV) the effect will be more profound.
Effect of Processing on the Protein Digestibility
The effect of various processing methods on peanut protein digestibility has been summarized in , , and . The digestibility of the raw peanut protein (unprocessed peanut protein) was found to be around 81.22 ± 0.23%, which is significantly lower for all of the processed peanut protein samples. Similar values were reported by Bodwell et al.,[Citation42] on their analysis using the three enzyme method. In the case of hot air roasting of peanuts (), the protein digestibility incresed significantly with an increase in treatment temperature. With a rise in treatment time, a significant increase was observed in the digestibility from 15 to 30 min, but not from 30 to 45 min. When the combination of the parameters was considered, there was a significant rise in the protein digestibility as processing time increased from 15 to 45 min at 50°C. But no significant growth was observed as the processing time increased from 15 to 45 min in the case of 75 and 100°C treatments. Also it can be observed that the digestibility values were similar when peanuts were processed at 50–45 and 75–15. Irrespective of the processing time, the digestibility did not show a significant improvement when processed at 100°C.
TABLE 3 Effect of hot air roasting on protein digestibility (IVPD%) of peanut protein
TABLE 4 Effect of microwave roasting on protein digestibility (IVPD%) of peanut protein
The IVPD% of the microwave roasted peanuts is summarized in . Results were similar (in terms of the values) to that of the hot air roasted peanuts. There was an effect of time and temperature on the digestibilty. In combination, significant difference was observed in the case of 50°C with an increase in processing time. For the peanut samples that were processed at 75 and 100°C, a significant difference was only observed between the 5 and 20 min processing. The other levels showed no significant difference. In the case of the protein digestibility of samples treated with high electric field, there was a significant increase in the digestibility with temperature and time. There was also a significant difference observed in digestibility with increasing processing time at 10, 15, and 20 kV voltages ().
TABLE 5 Effect of high electric field roasting on protein digestibility (IVPD %) of peanut protein
Thus, increasing digestibility clearly suggests that there are structural rearrangements taking place within the protein conformation leading to change in their functional properties.[Citation49] Similar studies have been conducted to understand the structure and digestibility relation in dry beans (Phaseolus vulgaris), green peas (Pisum sativum),[Citation23] sorghum (Sorghum bicolor), maize (Zea mays),[Citation49,Citation50] and rice.[Citation51] Duodu et al.[Citation50] reported that an increase in antiparallel and intermolecular β-sheets resulting from reorganization of the α-helical structures could have revealed the binding sites for the enzymes to act on. But the same study also revealed that secondary structure changes can be less relevant compared to the invaginated structure of the protein body.
The protein digestibility has been directly related to the allergenicity and the solubility of the proteins.[Citation52,Citation53] Thus an increase in the protein digestibility should directly reduce the allergenicity. But, in the case of peanuts various studies have shown that their allergenicity increases with an increase in roasting time and temperature.[Citation21,Citation39,Citation54] In their studies, Davis et al.[Citation55,Citation56] and Beyer et al.[Citation54] reported that treating proteins over the temperature of 80°C results in loss of secondary and tertiary structures and the formation of random coils with fully unfolded configuration. In the present study, FTIR analysis also supported the above observations. With an increase in the treatment time in all the experimental cases (hot air roasting, microwave, and high electric field treatments) there was an increase in the percentage of random coils and turns as more stable structures like 3/10 helices and α-helices have opened up and relocated themselves. The random coils observed at 1645 cm–1 increased from 0–7.69% of area for hot air treatments 50–15 to 100–45. For microwave treatments, this was between 0–7.03% for treatments 50–5 to 100–20, and for high electric field processing it rose from 0% at 10–60 to 4.56% at 20–180. The increasing random coil structures in the protein conformation may have opened up new binding sites, resulting in an increased allergenicity of the protein as reported in various other studies.[Citation39,Citation54,Citation57] Furthermore, it has to be noted that secondary structure changes can increase the protein digestibility, but it also can result in increased allergenicity as observed in the case of the peanut. Further analysis of the proteins and their secondary structure changes using innovative technologies, like molecular modeling[Citation30,Citation58] and proteomics,[Citation59] can foster the understanding of the structure–function relationship of proteins in food.
Conclusion
The study conducted on the peanut protein clearly showed that tested external processing factors which included hot air roasting, microwave roasting, and high electric field processing can influence the conformational secondary structure. The Gaussian analysis of the FTIR spectra and the IVPD% have been conducted on the processed protein which conformed the changes within the protein structures as predicted by previous studies. It can also be observed that the high electric field processing at 20 kV has similar conformational changes as of thermal processing methods like hot air roasting and microwave processing. This study also reiterates the importance of processing methods and processing parameters influencing the nutritional factors present in food. Further studies need to be conducted at higher electric field intensities of 50–70 kV which are commonly used in various food processing techniques like pulse electric field processing to better evaluate their impact on proteins.
Acknowledgment
The authors would like to thank Ms. Brinda Harish Vagadia for her help in preparing the manuscript.
Funding
The authors are grateful to the Natural Sciences and Engineering Research Council of Canada (NSERC) for its financial support for this study.
IJFP_supp_material.docx
Download MS Word (600.1 KB)Additional information
Funding
References
- Burton-Freeman, B. Dietary Fiber and Energy Regulation. Journal of Nutrition 2000, 130(2 Suppl.), 272S–275S.
- Holt, S.H.A.; Brand Miller, J.C.; Petocz, P.; Farmakalidis, E.A. A Satiety Index of Common Foods. European Journal of Clinical Nutrition 1995, 49(9), 675–690
- Kirkmeyer, S.V.; Mattes, R.D. Effects of Food Attributes on Hunger and Food Intake. International Journal of Obesity 2000, 24(9), 1167–1175.
- Maleki, S.J.; Hurlburt, B.K. Structural and Functional Alterations in Major Peanut Allergens Caused by Thermal Processing. Journal of AOAC International 2004, 87(6), 1475–1479.
- Putnam, J.J.; Allshouse, J.E. Food Consumption, Prices, and Expenditures, 1970–1993; U.S. Department of Agriculture, Economic Research Service 1994.
- Arshad, S.H.; Stevens, M.; Hide, D.W. The Effect of Genetic and Environmental Factors on the Prevalence of Allergic Disorders at the Age of Two Years. Clinical & Experimental Allergy 1993, 23(6), 504–511.
- Ortolani, C.; Pastorello, E.A. Food Allergies and Food Intolerances. Best Practice and Research: Clinical Gastroenterology 2006, 20(3), 467–483.
- Dalal, I.; Binson, I.; Reifen, R.; Amitai, Z.; Shohat, T.; Rahmani, S. Food Allergy Is a Matter of Geography after All: Sesame As a Major Cause of Severe Ige-Mediated Food Allergic Reactions Among Infants and Young Children in Israel. Allergy: European Journal of Allergy and Clinical Immunology 2002, 57(4), 362–365.
- Sampson, H.A.; McCaskill, C.C. Food Hypersensitivity and Atopic Dermatitis: Evaluation of 113 Patients. Journal of Pediatrics 1985, 107(5), 669–675.
- Bucher, X.; Fichier, W.J.; Dahinden, C.A.; Helbling, A. Effect of Tree Pollen Specific, Subcutaneous Immunotherapy on the Oral Allergy Syndrome to Apple and Hazelnut. Allergy: European Journal of Allergy and Clinical Immunology 2004, 59(12), 1272–1276.
- Hansen, K.S.; Khinchi, M.S.; Skov, P.S.; Bindslev-Jensen, C.; Poulsen, L.K.; Malling, H.J. Food Allergy to Apple and Specific Immunotherapy with Birch Pollen. Molecular Nutrition and Food Research 2004, 48(6), 441–448.
- Zuercher, A.W.; Holvoet, S.; Weiss, M.; Mercenier, A. Polyphenol-Enriched Apple Extract Attenuates Food Allergy in Mice. Clinical and Experimental Allergy 2010, 40(6), 942–950.
- Gruber, P.; Vieths, S.; Wangorsch, A.; Nerkamp, J.; Hofmann, T. Maillard Reaction and Enzymatic Browning Affect the Allergenicity Of Pru Av 1, the Major Allergen from Cherry (Prunus Avium). Journal of Agricultural and Food Chemistry 2004, 52(12), 4002–4007.
- Scheurer, S.; Son, D.Y.; Boehm, M.; Karamloo, F.; Franke, S.; Hoffmann, A. Cross-Reactivity and Epitope Analysis of Pru A 1, the Major Cherry Allergen. Molecular Immunology 1999, 36(3), 155–167.
- Schweimer, K.; Sticht, H.; Nerkamp, J.; Boehm, M.; Breitenbach, M.; Vieths, S. NMR Spectroscopy Reveals Common Structural Features of the Birch Pollen Allergen Bet v 1 and the Cherry Allergen Pru a 1. Applied Magnetic Resonance 1999, 17(2–3), 449–464.
- Silverstein, S.R.; Frommer, D.A.; Dobozin, B.; Rosen, P. Celery-Dependent Exercise-Induced Anaphylaxis. Journal of Emergency Medicine 1986, 4(3), 195–199.
- Ortolani, C.; Pastorella, E.A.; Farioli, L.; Ipsano, M.; Pravettoni, V.; Berti, C. Ige-Mediated Allergy from Vegetable Allergens. Annals of Allergy 1993, 71(5), 470–476.
- Ballmer-Weber, B.K.; Hoffmann, A.; Wüthrich, B.; Lüttkopf, D.; Pompei, C.; Wangorsch, A. Influence of Food Processing on the Allergenicity of Celery: DBPCFC with Celery Spice and Cooked Celery in Patients with Celery Allergy. Allergy: European Journal of Allergy and Clinical Immunology 2002, 57(3), 228–235.
- Bock, S.A. Prospective Appraisal of Complaints of Adverse Reactions to Foods in Children During the First 3 Years of Life. Pediatrics 1987, 79(5), 683–688.
- Burks, A.W.; Sampson, H. Food Allergies in Children. Journal of Combinatorial Theory, Series A 1993, 23(6), 230–252.
- Burks, W.; Sampson, H.A.; Bannon, G.A. Peanut Allergens. Allergy: European Journal of Allergy and Clinical Immunology 1998, 53(8), 725–730.
- Anderson, O.D.; et al. HMW Glutenins: Structure Function Relationships Step by Step. Proc. 6 Intern. Workshop on Gluten Proteins 1996, September 4–6; 195–198 pp.
- Deshpande, S.S.; Damodaran, S. Structure-Digestibility Relationship of Legume 7S Proteins. Journal of Food Science 1989, 54(1), 108–113.
- Gross, M.; Jaenicke, R. Proteins Under Pressure. The Influence of High Hydrostatic Pressure on Structure, Function, and Assembly of Proteins and Protein Complexes. European Journal of Biochemistry 1994, 221(2), 617–630.
- Mozhaev, V.V.; Heremans, K.; Frank, J.; Masson, P.; Balny, C. High Pressure Effects on Protein Structure and Function. Proteins: Structure, Function, and Genetics 1996, 24(1), 81–91.
- Nakai, S. Structure-Function Relationships of Food Proteins with An Emphasis on the Importance of Protein Hydrophobicity. Journal of Agricultural and Food Chemistry 1983, 31(4), 676–683.
- Sorgentini, D.A.; Wagner, J.R.; Añón, M.C. Effects of Thermal Treatment of Soy Protein Isolate on the Characteristics and Structure-Function Relationship of Soluble and Insoluble Fractions. Journal of Agricultural and Food Chemistry 1995, 43(9), 2471–2479.
- Tatham, A.S.; Shewry, P.R. The Conformation of Wheat Gluten Proteins. The Secondary Structures and Thermal Stabilities of α-, β-, γ- and ω-Gliadins. Journal of Cereal Science 1985, 3(2), 103–113.
- Whisstock, J.C.; Lesk, A.M. Prediction of Protein Function from Protein Sequence and Structure. Quarterly Reviews of Biophysics 2003, 36(03), 307–340.
- Singh, A.; Orsat, V.; Raghavan, V. Soybean Hydrophobic Protein Response to External Electric Field: A Molecular Modeling Approach. Biomolecules 2013, 3(1), 168–179.
- Kong, J.; Yu, S. Fourier Transform Infrared Spectroscopic Analysis of Protein Secondary Structures. Acta Biochimica et Biophysica Sinica 2007, 39(8), 549–559.
- Surewicz, W.K.; Mantsch, H.H. New Insight into Protein Secondary Structure from Resolution-Enhanced Infrared Spectra. Biochimica et Biophysica Acta (BBA)/Protein Structure and Molecular 1988, 952(C), 115–130.
- Byler, D.M.; Susi, H. Examination of the Secondary Structure of Proteins by Deconvolved FTIR Spectra. Biopolymers 1986, 25(3), 469–487.
- Susi, H.; Byler, D.M. [13] Resolution-Enhanced Fourier Transform Infrared Spectroscopy of Enzymes. In C. Hirs, Serge Timasheff, Nathan Colowick, Nathan Kaplan (Eds.), Methods in Enzymology 1986, 290–311 pp. New York, NY: Elsevier.
- Haris, P.I.; Severcan, F. FTIR Spectroscopic Characterization of Protein Structure in Aqueous and Non-Aqueous Media. Journal of Molecular Catalysis—B Enzymatic 1999, 7(1–4), 207–221.
- Krimm, S.; Bandekar, J. Vibrational Spectroscopy and Conformation of Peptides, Polypeptides, and Proteins. Advances in Protein Chemistry 1986, 38, 181–364.
- Lee, D.C.; Haris, P.I.; Chapman, D.; Mitchell, R.C. Determination of Protein Secondary Structure Using Factor Analysis of Infrared Spectra. Biochemistry® 1990, 29(39), 9185–9193.
- Koppelman, S.J.; Bruijnzeel-Koomen, C.A.F.M.; Hessing, M.; De Jongh, H.H.J. Heat-Induced Conformational Changes of Ara H 1, a Major Peanut Allergen, Do Not Affect Its Allergenic Properties. Journal of Biological Chemistry 1999, 274(8), 4770–4777.
- Maleki, S.J., Kopper, R.A.; Shin, D.S.; Park, C.W.; Compadre, C.M.; Sampson, H. Structure of the Major Peanut Allergen Ara H 1 May Protect Ige-Binding Epitopes from Degradation. Journal of Immunology 2000, 164(11), 5844–5849.
- Alonso, R.; Aguirre, A.; Marzo, F. Effects of Extrusion and Traditional Processing Methods on Antinutrients and in Vitro Digestibility of Protein and Starch in Faba and Kidney Beans. Food Chemistry 2000, 68(2), 159–165.
- Hsu, H.; Vavak, D.; Satterlee, L.; Miller, G. A Multienzyme Technique for Estimating Protein Digestibility. Journal of Food Science 1977, 42(5), 1269–1273.
- Bodwell, C.; Satterlee, L.; Hackler, L. Protein Digestibility of the Same Protein Preparations by Human and Rat Assays and by in Vitro Enzymic Digestion Methods. The American Journal of Clinical Nutrition 1980, 33(3), 677–686.
- Astwood, J.D.; Leach, J.N.; Fuchs, R.L. Stability of Food Allergens to Digestion in Vitro. Nature Biotechnology 1996, 14(10), 1269–1273.
- Kalkan, F.; Singh, A.; Vanga, S.K.K.; Raghavan, V.; Kara, M. Effects of Tempering Moisture and Roll Differential on Wheat Size Reduction Process during the First Break Rollers. Transactions of the ASABE (American Society of Agricultural and Biological Engineers) 2014, 57(5), 1425–1429.
- Ahmed, J.; Ramaswamy, H.S.; Ayad, A.; Alli, I.; Alvarez, P. Effect of High-Pressure Treatment on Rheological, Thermal, and Structural Changes in Basmati Rice Flour Slurry. Journal of Cereal Science 2007, 46(2), 148–156.
- Singh, A. Electrohydrodynamic Drying (EHD) and Its Associated Effects on Conformation of Food Proteins Using Molecular Modeling Concept, (Unpublished doctoral dissertation) McGill University 2014.
- Mangavel, C.; Barbot, J.; Popineau, Y.; Gueguen, J. Evolution of Wheat Gliadins Conformation During Film Formation: A Fourier Transform Infrared Study. Journal of Agricultural and Food Chemistry 2001, 49(2), 867–872.
- Singh, A.; Orsat, V.; Raghavan, V. A Comprehensive Review on Electrohydrodynamic Drying and High-Voltage Electric Field in the Context of Food and Bioprocessing. Drying Technology 2012, 30(16), 1812–1820.
- Duodu, K.G.; Taylor, J.R.N.; Belton, P.S.; Hamaker, B.R. Factors Affecting Sorghum Protein Digestibility. Journal of Cereal Science 2003, 38(2), 117–131.
- Duodu, K.G.; Tang, H.; Grant, A.; Wellner, N.; Belton, P.S.; Taylor, J.R.N. FTIR and Solid State13C NMR Spectroscopy of Proteins of Wet Cooked and Popped Sorghum and Maize. Journal of Cereal Science 2001, 33(3), 261–269.
- Sagum, R.; Arcot, J. Effect of Domestic Processing Methods on the Starch, Non-Starch Polysaccharides and in Vitro Starch and Protein Digestibility of Three Varieties of Rice with Varying Levels of Amylose. Food Chemistry 2000, 70(1), 107–111.
- Bannon, G.; Fu, T.-J.; Kimber, I.; Hinton, D.M. Protein Digestibility and Relevance to Allergenicity. Environmental Health Perspectives 2003, 111(8), 1122.
- Sen, M.; Kopper, R.; Pons, L.; Abraham, E.C.; Burks, A.Q.; Bannon, G.A. Protein Structure Plays a Critical Role in Peanut Allergen Stability and May Determine Immunodominant IGe-Binding Epitopes. Journal of Immunology 2002, 169(2), 882–887.
- Beyer, K.; Morrow, E.; Li, X.M.; Bardina, L.; Bannon, G.A.; Burks, A.W. Effects of Cooking Methods on Peanut Allergenicity. Journal of Allergy and Clinical Immunology 2001, 107(6), 1077–1081.
- Davis, P.; Williams, S. Protein Modification by Thermal Processing. Allergy 1998, 53(s46), 102–105.
- Davis, P.J.; Smales, C.M.; James, D.C. How Can Thermal Processing Modify the Antigenicity of Proteins? Allergy: European Journal of Allergy and Clinical Immunology, Supplement 2001, 56(67), 56–60.
- Maleki, S.J.; Chung, S.Y.; Champagne, E.T.; Raufman, J.P. The Effects of Roasting on the Allergenic Properties of Peanut Proteins. Journal of Allergy and Clinical Immunology 2000, 106(4), 763–768.
- Vanga, S.K.; Singh, A.; Raghavan, V. Effect of Thermal and Electric Field Treatment on the Conformation of Ara h 6 Peanut Protein Allergen. Innovative Food Science and Emerging Technologies, 2015, 30, 79–88.
- Di Girolamo, F.; et al. Proteomic Applications in Food Allergy: Food Allergenomics. Current Opinion in Allergy and Clinical Immunology 2015, 15, 259–266.