
Abstract
The effect of a high electric field on secondary structure conformation of fully hydrated (45.65% wet basis) gluten protein was studied by Fourier transform infrared spectroscopy. Three experimental conditions were evaluated including electric field intensity of 0 kV (no treatment), 3.5 kV, and 7kV and treatment time of 30, 60, and 90 min. Fourier transform infrared spectra of treated and non-treated hydrated gluten protein revealed that high electric field treatment resulted in irreversible changes in the secondary structures. For the 30 min treatment no variation was observed for electric field intensities 0 and 7 kV; but at 3.5 kV it showed slight reorganization and structural conversion of secondary structures. No variation in spectral pattern was observed for all the high electric field treatments for 60 min but major secondary structure reorganization took place for high electric field treatment at 90 min. Curve-fitting using Gaussian band shapes and principal component analysis further supported the results.
Introduction
In the past few decades, food allergies have become a growing concern in the developed countries due to increasing globalization.[Citation1] A food allergy is defined as an adverse immune response to food proteins, it is different from food intolerance, which falls under the mechanisms involving non-immunological responses to food.[Citation1,Citation2] The immune response involves IgE-mediated reactions to food proteins and intolerances fall into categories involving enzymatic or transport deficiencies. One of the most common food-based intolerance and allergies can be associated to wheat gluten protein, which is a storage protein complex found in wheat and is of critical importance in determining its bread-making quality. It regulates viscosity, cohesivity, water absorption, and elasticity of the dough.[Citation3,Citation4] It can be divided into two major fractions on the basis of its solubility in aqueous alcohol, gliadin, which is the soluble fraction and plays an important role in the viscous flow behavior of the dough; whereas glutenin the insoluble fraction contributes to the elasticity of the dough. Both these protein fractions are characterized by their high content of proline and glutamine amino acids.[Citation5–Citation7] These amino acids not only determine the physical properties of wheat-based products but also play a major role in the patho-physiology of an autoimmune disorder called Coeliac disease.[Citation3] It is interesting to note that there is no single laboratory test available to diagnose Coeliac disease and most of the clinical diagnoses are based on the causal relation between the ingested food and subsequent reaction to it. This is commonly known as double-blind test or placebo-controlled food challenge.[Citation2] In recent years several attempts have been made by researchers all around the globe to determine the role of cereal proteins in Coeliac disease, and currently for patients suffering from this disorder a strict gluten-free diet is often the most recommended treatment.[Citation3] For the food industries involved in producing cereal or wheat-based food products, the adverse reactions to them comes as a nightmare, as it not only limits their ability to cater the affected population but also adds financial burden involving removal of causal agent and addition of substitutes that can provide similar physico-chemical properties to the developed food product.
It is well known that the structure of protein governs its physico-chemical properties, and in recent years significant understanding of this structure related functional relationship garnered through in vivo and in vitro studies, have provided means for defining the qualitative and quantitative effect of specific proteins on safety and quality of processed food products.[Citation8] Proteins are polymers made of amino acids and the arrangements of these monomeric amino acids define what spatial conformation a protein will fold into. There are four different levels of protein structure; primary (linear sequence of amino acids), secondary (highly regular local sub-structures including helices, beta-sheets, and turns), tertiary (the three-dimensional structure), and quaternary structure (three-dimensional structure of a multi-subunit protein). These levels of protein structure can be studied using spectroscopic techniques such as Fourier transform infrared (FTIR) spectroscopy, and recently several researchers have applied FTIR to study the secondary structures of gluten protein.[Citation5,Citation9–Citation11]
FTIR spectroscopy is the measurement of wavelength and intensity of the infrared (IR) radiation by a protein sample. The spectra obtained from FTIR are interpreted in terms of the vibrations of the structural repeat units such as polypeptides in proteins. In protein the polypeptide units give rise to nine distinct IR absorption bands namely, amide A, B, and I–VII.[Citation12] In proteins the most sensitive IR spectral region is the amide I region (1700–1600 cm–1) due to C=O stretch vibrations of the peptide linkages. The frequency of the amide I region can be closely correlated to the secondary structural elements of the proteins.[Citation13,Citation14] The amide II is the second most prominent spectral region and it arises mainly due to N-H bending and C-N stretching vibrations. This region of the spectra shows less conformational sensitivity as compared to amide I.[Citation5] The characteristic IR absorption bands of the protein are listed in . FTIR analysis of gluten protein has revealed how specific secondary structures, such as beta-sheets, helices, and turns, can determine its physical properties. Wang et al.[Citation11] reported how beta-sheet forms changes with change in hydration of gluten protein. In another study, Popineau et al.[Citation15] reported that in a hydrated gluten protein, containing increasing ratios of gliadins and glutenins, the interaction between glutenin subunits took place via intermolecular beta-sheets because the proportion of intermolecular beta-sheets and alpha-helices increased. In 1999, Belton et al.[Citation9] proposed a “loops-train” model to explain the elasticity of wheat gluten protein. They reported how moisture content determines the formation of secondary structures. In 2006, Georget and Belton[Citation5] studied the effect of temperature on secondary structures of gluten protein under various hydration conditions. They suggested that dry gluten protein, when exposed to high temperatures, does not show any change in its secondary structure, but as the protein is hydrated and heated, changes in the beta-sheet structure occur. They also reported that no permanent changes took place in prolamins at higher temperatures, but they concluded that gluten proteins are conformationally much more sensitive to hydration and heating than other proteins. In this study, we have evaluated the effect of an external high electric field on the secondary structure conformations of a fully hydrated wheat gluten protein using FTIR.
TABLE 1 Infrared absorption bands of peptide linkages (adapted from [Kong & Yu, 2007; Georget & Belton, 2006])
Experimental Section
Gluten Protein Sample
Wheat gluten protein was procured from Sigma-Aldrich Canada. The initial moisture content of gluten protein (7.6% [wet basis [w.b.]) powder was determined by drying in oven at 105°C for 4 h, after which the weight was constant. The protein sample was fully hydrated (45.65% moisture content [w.b.])[Citation5] to replicate the hydration conditions encountered in dough processing by manually mixing it with deionized water. This sample was later subjected to a static high electric field treatment.
Electric Field Treatment
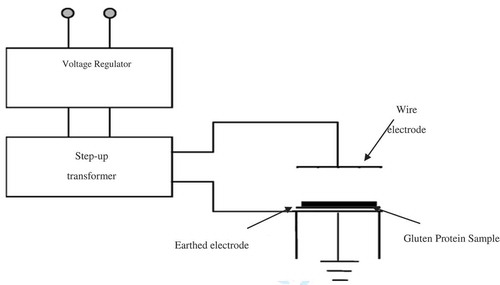
The apparatus utilized to apply the pre-treatment consisted of two parallel electrodes connected to a General Electric Ignition Transformer and a Superior Electric Co. Powerstat adjustable transformer (). The Powerstat transformer was used to modulate the input AC voltage of the ignition transformer in order to obtain the required electric field strengths of 3.5 and 7 kV/cm between the electrodes. A solid copper wire of diameter 0.05 cm was used as the top electrode and a copper plate was used as the ground electrode. The treatment consisted of placing approximately 1 g of the hydrated gluten protein between the electrodes and applying the desired electric field strength of 3.5 and 7 kV/cm for 30, 60 and 90 minutes. The distance between the electrodes was fixed at 1 cm and the wire electrode was suspended at approximately 0.8 cm above the sample surface. The samples were then removed and subjected to FTIR analysis to study the structural changes. Each treatment was conducted in triplicate to make a statistically viable observation.
FIGURE 1 Schematic of the static high electric field treatment system.
FTIR Spectroscopy
FTIR spectral analysis of treated gluten protein samples was conducted using Nicolet iS5 attenuated total reflectance (ATR)-FTIR spectrometer. The samples were directly applied to the single-reflection diamond ATR and pressed down to ensure good contact with the ATR diamond. For each sample, 30 spectra at 4 cm–1 resolutions were averaged and the spectra for the empty ATR diamond acted as the reference. The spectra was analyzed using OMNIC software (version 8, Thermo Nicolet Instrument Corp., Madison, WI) and Origin Pro (Version 9, OriginLab Corporation, Northampton, MA, USA).
Principal Component Analysis (PCA)
PCA is a widely used chemometric method for data reduction and transformation of data into a new form that helps to extract relevant information which is more explicit. PCA helps researchers to obtain a small set of principal components (PC) that can explain the most variability for high dimensional data sets. For this study the PCA with cross validation and cluster analysis (CA), which measures the similarity between samples, were carried out in Unscrambler version 10.3 (Camo Software, AS., Norway) to interpret the FTIR spectra.
Results and Discussion
FTIR Analysis of Conformational Changes in Gluten Protein
In proteins the amide I (1700–1600 cm–1) region of the IR spectrum is considered as the one of the most sensitive and most useful for secondary structure elucidation.[Citation12,Citation13] The amide I band () is the sum of several overlapping component bands including α-helices, β-sheets, β-turns, and randomly coiled conformations[Citation16] which are mainly related to C=O stretching vibrations coupled with the in-plane NH bending. The frequency of this region depends on the nature of the hydrogen bond formed between C=O and NH moieties, which in turn leads to determination of secondary structure, backbone configuration and hydrogen bonding patterns.[Citation12] The amide I band assignment of hydrated gluten protein are presented in , which are based on previous work.[Citation5,Citation12,Citation17,Citation18] represents a typical FTIR spectrum of a hydrated wheat gluten protein (4000–500 cm–1).
TABLE 2 Amide I band frequencies and assignment to protein secondary structure in H2O media (adapted from [Georget & Belton, 2006; Goormaghtigh et al., 1994; Kong & Yu, 2007; Pelton & McLean, 2000])
FIGURE 2 (a) Typical FTIR spectra of hydrated wheat gluten protein; (b) FTIR spectra of hydrated (H) gluten proteins treated with high electric field intensities (0, 3.5, and 7 kV/cm) for time (30, 60, and 90 min).
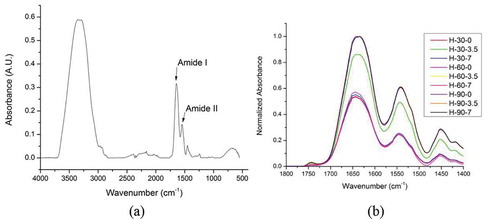
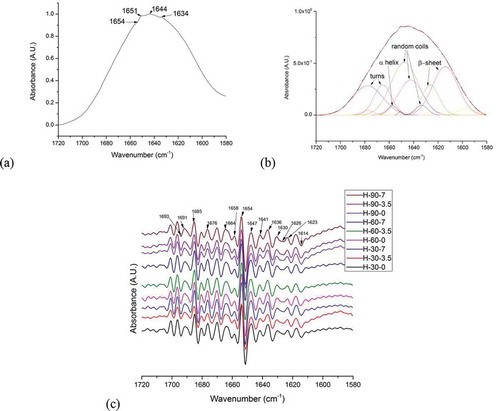
The normalized FTIR spectra of treated and non-treated hydrated gluten protein revealed that high electric field treatment resulted in irreversible changes in the secondary structures (). In the amide I region of the hydrated gluten protein broad shoulders were observed at 1654–1650 cm–1, indicating α-helix conformation. Similar shoulders and minor peaks were observed at 1644–1634 cm–1, indicating presence of random coils and β-sheets (). For a high electric field treatment of 30 min no variation was observed for electric field intensities 0 kV (no treatment) and 7 kV (highest electric field intensity), only at 3.5 kV a slight reorganization and structural conversion of secondary structures was observed. This reorganization may be due to transition of extended structures into α-helices and random coils. Similarly no variation in the spectral pattern was observed for all of the high electric field treatment at 60 min. Our observation of the spectral data revealed that major secondary structure reorganization took place for high electric field treatment at 90 min.
FIGURE 3 (a) Normalized spectra of the amide I region of hydrated gluten protein; (b) Normalized amide I band of hydrated gluten protein subjected to control conditions of 0 kV electric field intensity for 30 min fitted with sums of Gaussian bands; (c) Second derivative of normalized spectra showing the valleys and peaks associated with specific secondary structures for all experimental conditions.
In general, it can be expected that as the electric field intensity and treatment time increase, major variations in the secondary structures should normally take place, but this was not the case in the present study. One possible explanation for this observation lies in the effect of the electric field on the texture of the hydrated gluten protein. In the present study, the setup used to subject the hydrated gluten protein to electric field treatment was developed for electrohydrodynamic drying of food products. When high voltage is applied to an emitting wire electrode a corona wind is generated that leads to enhancement in drying of food products.[Citation19] For this setup the velocity of the corona wind is directly proportional to the applied electric field intensity, for example, the higher the intensity, the more intense is the corona wind; and the longer the sample is subjected to it, the higher the moisture loss would be. Hence, we can assume that as the hydrated protein was subjected to the electric field, some moisture will be lost leading to changes in the texture of the gluten protein, for example, it will hold less moisture than before, and this change in moisture content will also account for variations in the protein structural conformation.[Citation20,Citation21]
Hence, as noticed in this study, major structural variations were observed among treatment times; electric field treatment for 90 min had significant impact on the structural conformation as observed by the increase in absorbance intensity () as compared to those obtained for 30 and 60 min. The reason for minimal spectral absorbance variations between treatment times of 30 and 60 min at all electric field intensities with the exception of treatment at 3.5 kV for 30 min can be attributed to the influence of the electric field on the kinetics of folding and unfolding of the hydrated gluten protein. This theory is still subjected to validation and more intensive work is required to explain the dynamics of protein folding and unfolding under the influence of an external electric field.
To quantify the deviations in the secondary structures in the amide I band, which consist of overlapped bands, a curve-fitting procedure was applied using Origin Pro (Version 9, OriginLab Corporation, Northampton, MA, USA). Curve-fitting is based on the least-squares minimization procedure, where the software program used attempts to minimize the sum of squares of the difference between the experimental spectra and the computed spectra generated by summation of the component curves.[Citation14,Citation22] For this study Gaussian band shapes were used to perform the curve-fitting () and the component bands were determined by using the second derivatives () of the normalized FTIR spectra of the amide I region.
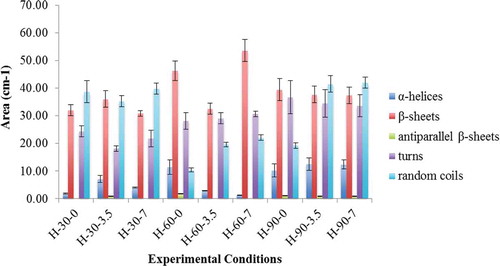
represents the relative area of the bands fitted to the normalized FTIR spectra of gluten protein as it was subjected to the varying experimental conditions. From , it was observed that for almost all the experiments conducted for 30 and 90 min, random coils and β-sheets were the major secondary structures representing almost 30–40% and 10–15% of the total protein secondary structures, respectively. Identification of antiparallel intermolecular hydrogen-bonded β-sheets (1693 cm–1) for the electric field treatment of 30 min at 3.5 kV; 60 min at 0 kV, and 90 min at 0–3.5–7 kV revealed the presence of protein aggregates.
FIGURE 4 Variations in relative areas of the bands fitted to the normalized FTIR spectra of amide I region (1720–1580 cm-1) of gluten protein. Error bars represent standard errors.
The 1662–1683 cm–1 bands, representing 25–30% of the total amount of structures, was assigned to secondary structure “turns.” The importance of these bands can be related to proline residues in the repetitive domains of the gliadins. In 2001, Mangavel et al.[Citation14] reported that the general features of gliadin film in an FTIR spectrum are very closely related to wheat gluten protein in its hydrated state. In their analysis of bands fitted to FTIR deconvoluted spectra of gliadins film dried at different temperatures, they observed bands at 1693 cm–1 associated to the presence of antiparallel β-sheets suggesting the presence of protein aggregates.
In the present study, varying influence of experimental conditions on the evolution of secondary structure was observed. For high electric field treatment of 30 min at 3.5 kV, the combination of bands at 1650 and 1657.5 cm–1, assigned α-helix, revealed higher relative area (7.12%) as compared to 1.86 and 4.91% obtained for 0 and 7 kV treatments. As the treatment time was increased to 60 min, no major difference was observed in the relative area of assigned secondary structures except for the presence of antiparallel β-sheets (1693 cm–1) at 0 kV.
With a further increase in treatment time to 90 min, a major variation in the content of α-helical structures of hydrated gluten protein were observed, the relative area obtained were significantly higher compared to treatments conducted for 30 and 60 min (10–14% as compared to 1–7%). It was observed that for high electric field treatment for 30 min at 3.5 kV the relative areas associated with α-helices and β-sheets were higher as compared to 0 and 7 kV suggesting that this experimental condition favored α-helices as well as hydrogen bonded β-sheets and antiparallel β-sheets at the expense of random structures and turns. Similar observations can be made for experiments conducted for 60 min at 0 kV, where, α-helices were favored more than other secondary structures. As the experimental treatment time was increased to 90 min, no major variations were observed between relative areas associated to α-helices and β-sheets but the area values obtained for α-helices were higher compared to other experimental conditions.
It is important to note that due to the complexity and amorphous nature of wheat gluten proteins, the understanding of its structural component has been an ongoing battle and only a part of its structural riddle has been solved.[Citation23] Gluten protein is composed of two component proteins, gliadin (monomeric) and glutenin (polymeric), and studies conducted using circular dichroism, IR spectroscopy, and X-ray scattering[Citation5,Citation24,Citation25] have suggested that the gluten protein presents a higher ratio of intrinsically disordered regions as compared to structurally organized regions.
In 2013, Singh et al.[Citation3] conducted a molecular dynamic (MD) study on the effect of external electric field on the conformation of gliadin protein. Within the limitation of the MD simulation they suggested that application of an external electric field resulted in changes in the hydrogen bond evolution of gliadin protein and since gliadin protein present similar structural conformation as a hydrated gluten protein, their result can be validated with the observations made in this study. Appearance of antiparallel β-sheets and increase in the relative areas of α-helices and β-sheets confirm that under the influence of an electric field and depending on the treatment time, the hydrogen bonding pattern of gluten protein leads to the formation of certain secondary structures at the expense of others.
PCA analysis
PCA analysis of the normalized spectral data within 1720–1580cm–1 amide I region supported the aforementioned findings. PCA was conducted to provide an interpretable overview of the information present in the multidimensional FTIR datasets. The PCA analysis suggested that principal component 1 (PC1) explained about 98% of the total variability among the samples and principal component 2 (PC2) explained 1%. No variability was observed between the experimental replicates. From the PCA score plot it was apparent that all nine sets of sample spectra clustered appropriately with only samples treated under high electric field intensity of 3.5 and 7kV for 60 min showing significant overlap. It was also observed that high electric field treatment for 90 min under all electric field intensities and one conducted for 30 min at 3.5 kV were grouped on the negative side of PC1 suggesting similarities among them and others were grouped along the positive side of PC1.
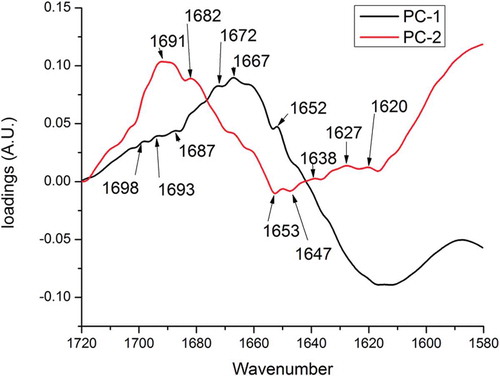
Analysis of the PCA loadings plot () indicated that maximum contribution to the spectral differences was due to the variability between α-helices (1652–1653 cm–1) and the presence of antiparallel β-sheets explained both by PC1 and PC2. PC2 alone was able to explain the variability in the absorbance of turns (1672 and 1667 cm–1) and β-sheets (1620, 1627, and 1633 cm–1). A significant limitation for this study was the strength of the electric field applied on the protein sample. Further studies are required with higher electric field intensities in the range of 50–60 kV for significant conformational changes in proteins.
FIGURE 5 PCA loadings plots of the FTIR spectra in the 1720–1580 cm-1 amide I region.
Conclusions
This study clearly showed that protein conformation is influenced by external factors including electric field and treatment time. As the treatment time increased the intensity of the amide I bands (1720–1580 cm–1) increased suggesting conformational changes. The results were further supported by band fitting using Gaussian band shapes and PCA analysis. The observations made in this study suggest that application of an external electric field stress influences the hydrogen bonding pattern of the protein resulting in the occurrence of intramolecular hydrogen-bonded antiparallel β-sheet aggregates. To improve our understanding on the effect of an electric field on gluten protein, further studies need to be conducted with application of higher electric field intensities in the range of 50–60 kV as they are widely applied in novel food processing techniques, such as pulsed electric field and electrohydrodynamic drying.
Funding
The authors are grateful to the Natural Sciences and Engineering Research Council of Canada (NSERC) for their financial support for this study.
LJFP_S_1076458.docx
Download MS Word (16.3 KB)Supplemental Material
Supplemental data for this article can be accessed on the publisher’s website
Additional information
Funding
References
- Ortolani, C.; Pastorello, E.A. Food Allergies and Food Intolerances. Best Practice & Research Clinical Gastroenterology 2006, 20(3), 467–483.
- Eigenmann, P.A. Mechanisms of Food Allergy. Pediatric Allergy and Immunology 2009, 20(1), 5–11.
- Singh, A.; Munshi, S.; Raghavan, V. Effect of External Electric Field Stress on Gliadin Protein Conformation. Proteomes 2013, 1(2), 25–39.
- Gulia, N.; Khatkar, B.S. Quantitative and Qualitative Assessment of Wheat Gluten Proteins and their Contribution to Instant Noodle Quality. International Journal of Food Properties 2014, 18(8), 1648–1663.
- Georget, D.M.R.; Belton, P.S. Effects of Temperature and Water Content on the Secondary Structure of Wheat Gluten Studied by FTIR Spectroscopy. Biomacromolecules 2006, 7(2), 469–475.
- Patil, V.R.; Talati, J.G.; Singh, C.; Parekh, V.B.; Jadeja, G.C. Genetic Variation in Glutenin Protein Composition of Aestivum and Durum Wheat Cultivars and Its Relationship with Dough Quality. International Journal of Food Properties 2015, 18(11), 2393–2408.
- Barak, S.; Mudgil, D.; Khatkar, B.S. Effect of Compositional Variation of Gluten Proteins and Rheological Characteristics of Wheat Flour on the Textural Quality of White Salted Noodles. International Journal of Food Properties 2013, 17(4), 731–740.
- Singh, A.; Orsat, V.; Raghavan, V. Soybean Hydrophobic Protein Response to External Electric Field: A Molecular Modeling Approach. Biomolecules 2013, 3(1), 168–179.
- Belton, P.S. On the Elasticity of Wheat Gluten. Journal of Cereal Science 1999, 29(2), 103–107.
- Belton, P.S.; Colquhoun, I.J.; Grant, A.; Wellner, N.; Field, J.M.; Shewry, P.R.; Tatham, A.S. FTIR and NMR Studies on the Hydration of a High-Mr Subunit of Glutenin. International Journal of Biological Macromolecules 1995, 17(2), 74–80.
- Wang, Y.; Belton, P.S.; Bridon, H.; Garanger, E.; Wellner, N.; Parker, M.L.; Grant, A.; Feillet, P.; Noel, T.R. Physicochemical Studies of Caroubin: A Gluten-Like Protein. Journal of Agricultural and Food Chemistry 2001, 49(7), 3414–3419.
- Kong, J.; Yu, S. Fourier Transform Infrared Spectroscopic Analysis of Protein Secondary Structures. Acta Biochimica et Biophysica Sinica 2007, 39(8), 549–559.
- Haris, P.I.; Severcan, F. FTIR Spectroscopic Characterization of Protein Structure in Aqueous and Non-Aqueous Media. Journal of Molecular Catalysis—B Enzymatic 1999, 7(1–4), 207–221.
- Mangavel, C.; Barbot, J.; Popineau, Y.; Guéguen, J. Evolution of Wheat Gliadins Conformation During Film Formation: A Fourier Transform Infrared Study. Journal of Agricultural and Food Chemistry 2001, 49(2), 867–872.
- Popineau, Y.; Bonenfant, S.; Cornec, M.; Pezolet, M. A Study by Infrared Spectroscopy of the Conformations of Gluten Proteins Differing in their Gliadin and Glutenin Compositions. Journal of Cereal Science 1994, 20(1), 15–22.
- Ahmed, J.; Ramaswamy, H.S.; Ayad, A.; Alli, I.; Alvarez, P. Effect of High-Pressure Treatment on Rheological, Thermal, and Structural Changes in Basmati Rice Flour Slurry. Journal of Cereal Science 2007, 46(2), 148–156.
- Goormaghtigh, E.; Cabiaux, V.; Ruysschaert, J.M. Determination of Soluble and Membrane Protein Structure by Fourier Transform Infrared Spectroscopy. III. Secondary Structures. Sub-Cellular Biochemistry 1994, 23, 405–450.
- Pelton, J.T.; McLean, L.R. Spectroscopic Methods for Analysis of Protein Secondary Structure. Analytical Biochemistry 2000, 277(2), 167–176.
- Singh, A.; Orsat, V.; Raghavan, V. A Comprehensive Review on Electrohydrodynamic Drying and High-Voltage Electric Field in the Context of Food and Bioprocessing. Drying Technology 2012, 30(16), 1812–1820.
- Ansari, A.; Jones, C.; Henry, E.; Hofrichter, J.; Eaton, W. The Role of Solvent Viscosity in the Dynamics of Protein Conformational Changes. Science 1992, 256(5065), 1796–1798.
- Halle, B. Protein Hydration Dynamics in Solution: A Critical Survey. Philosophical Transactions B 2004, 359, 1207–1224.
- Jackson, M.; Mantsch, H.H. The Use and Misuse of FTIR Spectroscopy in the Determination of Protein Structure. Critical Reviews in Biochemistry and Molecular Biology 1995, 30(2), 95–120.
- Rasheed, F.; Newson, W.R.; Plivelic, T.S.; Kuktaite, R.; Hedenqvist, M.S.; Gällstedt, M.; Johansson, E. Structural Architecture and Solubility of Native and Modified Gliadin and Glutenin Proteins: Non-Crystalline Molecular and Atomic Organization. RSC Advances 2014, 4(4), 2051–2060.
- Field, J.M.; Tatham, A.S.; Shewry, P.R. The Structure of a High-Mr Subunit of Durum-Wheat (Triticum durum) Gluten. Biochemical Journal 1987, 247(1), 215–221.
- Tatham, A.S.; Shewry, P.R. The Conformation of Wheat Gluten Proteins. The Secondary Structures and Thermal Stabilities of α-, β-, γ-, and ω-Gliadins. Journal of Cereal Science 1985, 3(2), 103–113.