
 ?Mathematical formulae have been encoded as MathML and are displayed in this HTML version using MathJax in order to improve their display. Uncheck the box to turn MathJax off. This feature requires Javascript. Click on a formula to zoom.
Abstract
The fatty acid profile of crevalle jack was compared with that of Atlantic bluefin tuna, Atlantic Spanish mackerel, red snapper, and Nile tilapia. Crevalle jack and Atlantic Spanish mackerel showed similarities in their fatty acid profiles, with the saturated fatty acid > monounsaturated fatty acid > polyunsaturated fatty acid pattern. Atlantic bluefin tuna and red snapper followed a similar pattern to each other, with the polyunsaturated fatty acid > saturated fatty acid > monounsaturated fatty acid pattern, and the pattern for Nile tilapia was saturated fatty acid > monounsaturated fatty acid ≈ polyunsaturated fatty acid. In winter, the DHA+EPA content of crevalle jack (493.2 mg/100 g fillet) was 37% lower than Atlantic bluefin tuna and Atlantic Spanish mackerel, 35% higher than for the red snapper, and 2.8 fold higher than for the Nile tilapia. The best nutritional indices were for Atlantic bluefin tuna > red snapper > Atlantic Spanish mackerel > crevalle jack > Nile tilapia.
INTRODUCTION
Fish consumption is recommended because of several nutritional benefits[Citation1]—low in total fat and rich in protein, contains a number of essential minerals (selenium, iodine, magnesium, zinc, calcium, iron, phosphorous, potassium, sodium, cobalt, and fluorine) and several beneficial vitamins (B1, B2, B6, B12, A, D, E). Specifically, fish contains a higher amount of polyunsaturated fatty acids (PUFA), especially n-3 PUFA, compared with other protein sources, such as milk, meat and eggs, that have a high content of saturated fatty acids (SFA) or n-6 PUFA. The consumption of n-3 PUFA aids in the reduction of plasma cholesterol and triacylglycerol levels,[Citation2] which suggests that it can also serve as a mechanism in the protection against cardiovascular disease (CVD), such as the prevention of cardiac arrhythmias, decrease in platelet aggregation, stabilization of atherosclerotic plaque, decrease in thrombosis, and reduction of blood pressure.[Citation3] Despite the fact that CVD is a multifactor disease, fish consumption could have a beneficial effect against CVD risk factors, such as atherosclerosis, thrombosis and high plasma cholesterol. Furthermore, n-3 PUFA are essential for mental and visual function; their intake has been associated with a decreased risk of Alzheimer’s disease, dementia, depression, and attention deficit hyperactivity disorder.[Citation4] For that reason, it is necessary to describe the fatty acid (FA) composition of fish products.
Some health effects of fish species can be discerned by investigating the quality indices in relation to the type and content of FAs (e.g., the index of atherogenicity [IA], the index of thrombogenicity [IT] and the hypocholesterolemic to hypercholesterolemic FAs ratio [HH]).[Citation5Citation6] These indices provide an overview of the fat nutritional quality when considering groups of FAs and their relationship to different diseases.
Although fish products are well known for their health value, not all fish species offer the same benefits. In Mexico, there is a large variety of marine and freshwater fish species, but not all are exploited, because of ignorance of their features. Specifically, the crevalle jack (Caranx hippos) is a specie of interest because of the lack of analytical data for FA composition, as indicated following a review of the Mexican food composition tables.[Citation7]
Crevalle jack is a coastal species found in tropical and subtropical zones worldwide. It is distributed in the eastern Atlantic, from Portugal to Angola, including the western Mediterranean. It is also distributed in the western Atlantic, from Nova Scotia, Canada, and the northern Gulf of Mexico to Uruguay, including the Greater Antilles.[Citation8] It is a cheap species that is commonly used as a game fish, in public aquariums, and human consumption, but the FA profile during different seasons and its nutritional indices have not yet been reported. In this work, the FA composition of crevalle jack was compared over three seasons with Atlantic bluefin tuna (AB tuna) and Atlantic Spanish mackerel (AS mackerel), which are good sources for n-3 PUFA; in the second part of the work, the last species were compared in winter with Nile tilapia and red snapper, which are important commercial fish species in Mexico. Data were analyzed to evaluate the fat nutritional quality of the five fish species by calculating the PUFA to SFA ratio, the IA, the IT, and the HH ratio. Additionally, a comparison of nutritional indices was also conducted between the Mexican species with other important species from around the world, in order to show nutritional characteristics of Mexican species.
MATERIALS AND METHODS
Biological Fish Material
Crevalle jack (Caranx hippos), AB tuna (Thunnus thynnus), AS mackerel (Scomberomorus maculatus), red snapper (Lutjanus campechanus), and Nile tilapia (Oreochromis niloticus) were purchased at La Nueva Viga Market in Mexico City, which is one of the largest fish markets in the world. Nile tilapia (average mass, 495.6 ± 27.0 g) were obtained from a farm; crevalle jack (average mass, 758.2 ± 73.5 g), AB tuna (average mass, 146.1 ± 28.4 kg), AS mackerel (average mass, 582.5 ± 44.3 g), and red snapper (average mass, 1013.3 ± 143.1 g) were from the Gulf of Mexico. AB tuna and AS mackerel are pelagic species, whereas red snapper is a reef-associated species that remains within a relatively small area.[Citation9]
Whole specimen with excellent physical properties were acquired from various vendors. The quality of chilled fish was assessed by a visual inspection of eyes, gills, skin, and scales. All samples were immediately placed on ice, kept cold, transported in polystyrene boxes, and maintaining at 0.0 ± 0.5°C until analysis. A total of 11 fillets per species per season were analyzed. Crevalle jack, AB tuna, and AS mackerel fillets were sampled during the summer (June to August 2011), autumn (October to December 2011), and winter (February and March 2012); 11 fillets of red snapper and Nile tilapia were sampled in winter (February 2012). A total of 121 samples were analyzed. Each fillet from an individual specimen was ground in a food processor; the obtained homogeneous mass was used for the analyses described below.
Fat Content
Total lipid content was extracted from the ground fillet according to Folch et al.[Citation10] using a chloroform–methanol solution (2:1, mL:mL) and recovering the lipids in a Rotavapor at 43°C. The extract was used to quantify both the total fat and the FA composition.
FA Analysis
Aliquots of the total lipid extract were used to prepared fatty acid methyl esters (FAMEs) by method 2.301 of IUPAC.[Citation11] The FAMEs profile was determined in triplicate for each sample and was based on the experimental procedure described by Hernández-Martínez et al.[Citation12] using a PerkinElmer Clarus 500 gas chromatograph equipped with a flame ionization detector and a Rtx-2330 capillary column (105 m length; 0.25 mm internal diameter; 0.20 mm film thickness; Restek, Bellefonte, USA).
Data were processed using the TotalChrom Software of PerkinElmer. The FAMEs were identified by comparison of their retention time with those of a marine standard mix (Restek 35066). FA quantification was carried out by calculating the percentage peak area to obtain the percentage of FAMEs, then to calculate the percentage of total FAs the conversion factors of the AOAC 996.06 method were used.[Citation13] The amount of FA in mg/100 g of edible portion (fillet) was also calculated.
The estimated limits of detection (LOD) and limits of quantification (LOQ) for the individual FAMEs components on the gas chromatography were between 0.093 and 1.669 mg/mL, and 0.309 and 5.565 mg/mL, respectively, and they were calculated according to Miller and Miller.[Citation14] The LOD of an analyte may be described as that concentration which gives an instrument signal significantly different from the “blank” or “background” signal. The LOQ is the lower limit for precise quantitative measurements.[Citation14]
Fat Nutritional Indices
The FA composition was used to determine three nutritional indices, which attributed different weights to FAs depending on the different contribution of these to the promotion or prevention of pathological phenomena. The IA and the IT were calculated according to Ulbricht and Southgate,[Citation5] and the HH ratio, according to Santos-Silva et al.[Citation6] using the following formulae:
To calculate the nutritional indices, the FAs concentrations were expressed as mg/100 g of fillet. The values of HH are expected to be as high as possible, and IA and IT as low as possible.
Statistical Analysis
Significant differences between FAs and nutritional indices among species and seasons were determined by one-way analysis of variance (ANOVA) at a 5% significance level (p < 0.05) using Tukey’s test. The analyses were performed with Minitab Statistical Software, version 16.1.0 (State College, PA, USA).
RESULTS AND DISCUSSION
Chemical Composition
The mean lipid content of crevalle jack, AB tuna, AS mackerel, red snapper, and Nile tilapia was 3.25, 3.32, 6.60, 1.64, and 1.03 g/100 g of fillet, respectively. The complete chemical composition of crevalle jack, AB tuna, and AS mackerel can be seen in the work of Hernández-Martínez et al.[Citation15]
FA Content
Twenty FAs in fish fillets were identified and compared among different species. The most abundant FA identified in fish species were: palmitic acid (C16:0), stearic acid (C18:0), palmitoleic acid (C16:1 n-7), oleic acid (C18:1 n-9), eicosatrienoic acid (C20:3 n-3), eicosapentaenoic acid (EPA, C20:5 n-3), and docosahexaenoic acid (DHA, C22:6 n-3), these seven FA were in the highest proportions of total FA. The average percentage of main FAs in crevalle jack, AB tuna, AS mackerel, red snapper, and Nile tilapia was 88.65, 92.88, 87.53, 77.21, and 94.86%, respectively. The less abundant FAs (C14:0, C14:1, C18:1 n-7, C18:2, C18:3, C20:0, C20:1, C20:2, C22:1, C22:0, C24:0, C20:4, C24:1) individually had a percentage between 0.02 to 4.97% of total FAs.
The FA profile of crevalle jack, AB tuna, and AS mackerel is shown in . The total SFA in marine species ranged from 33.77 to 46.95% of total FAs. Similar results were reported for 12 marine fish species from the Black Sea.[Citation16] In all species, SFA was mainly composed of C16:0 (20.73–31.93%) and C18:0 (7.22–13.66%).
TABLE 1 Fatty acid composition (% of total fatty acids) in crevalle jack, AB tuna, and AS mackerel fillets by season
The total SFA showed significant differences (p < 0.05) between the seasons only for crevalle jack and AS mackerel. Crevalle jack showed statistically the same SFA percentage as AS mackerel in autumn and winter. The SFA values could be explained by the metabolic necessities of crevalle jack and AS mackerel; Murillo et al.[Citation17] suggest that SFA and MUFA are used as metabolic sources of energy for related species as Caranx caballus and Scomberomorus sierra.
The monounsaturated fatty acids (MUFA) ranged from 14.47 to 36.22%. The major MUFA was the oleic acid (C18:1 n-9). It ranged from 17.98 to 25.96% of the total FAs in the crevalle jack and AS mackerel and in lower proportions, from 10.16 to 20.74%, in the AB tuna. The total MUFA showed significant differences (p < 0.05) between the seasons in all species. Among the species, the AS mackerel showed the highest MUFA contents throughout seasons (33.06–36.22%) followed by the crevalle jack (27.64–30.33%).
The total PUFA ranged from 17.42 to 50.76% of total FAs. The PUFA was mainly composed of C20:3 n-3, EPA and DHA. The DHA and EPA were predominant (67.05–88.25%) among the total PUFA. The AB tuna showed the highest PUFA content (50.76–34.45%) followed by the crevalle jack (26.05–28.06%). These marine species showed an EPA+DHA content greater than 13.2% of the total FAs.
Among the n-6 PUFA, linoleic acid (C18:2 n-6) was the most abundant, ranging from 0.72 to 1.86% of total FAs and arachidonic acid (C20:4 n-6) was the next most abundant, ranging from 0.17 to 0.53%. The n-6 PUFA were very low compared with n-3 PUFA. Percentages of PUFA and n-3 PUFA showed no significant differences (p < 0.05) among studied seasons for crevalle jack, whereas significant differences were observed for AB tuna and AS mackerel. These differences could be due to the intake and accumulation of FAs which depend upon multiple factors, such as diet, accumulation, and distribution of FA among fish tissues, the consumption of FA during spawning season, and migration.[Citation18]
Results showed that PUFA concentrations for crevalle jack were constant probably due to a constant FAs sources and geographic location, even though the analysis was carried out in samples collected during the spawning season (March–September).[Citation19] In the case of AS mackerel, the higher percentage of DHA+EPA was found in summer which is the spawning season (July–September)[Citation20] and the lower percentages were found in autumn and winter seasons. These latter results can be attributed to the reduction of FAs reservoirs after the spawning. Similar results can be observed in other fish species.[Citation21] These results can also be due to migration behavior, since AS mackerel migrates from south to north in spring–summer and in opposite direction in autumn–winter.[Citation20]
In the case of AB tuna, results showed significant differences (p < 0.05) of DHA+EPA among the studied seasons, with the higher percentage in winter. These differences can be attributed to multiple factors: (1) n-3 PUFA are constituents of the cellular membrane phospholipids, which are needed especially during the low temperature season to maintain the membrane fluidity and membrane protein function;[Citation17Citation21] (2) due to the intake of phytoplankton and carnivorous diet of the fish;[Citation22] another less important factor is the spawning season which occurs for each individual every 2 to 3 years, but for the specie as a whole, every year.[Citation23]
Regarding red snapper and Nile tilapia, the percentage of SFA, MUFA, PUFA, n-3 PUFA, n-6 PUFA, and DHA+EPA based on the total FA were 40.06, 13.43, 46.51, 45.61, 0.90, and 40.26% and 51.29, 24.37, 24.33, 19.97, 4.37, and 12.93%, respectively. Red snapper and Nile tilapia were sampled in winter only, because more levels of PUFA were expected since fish in a cold region or season have higher amounts of PUFA to provide the lower water temperature adaptation.[Citation21Citation24] However, results in show that for crevalle jack and mackerel, winter was not the season with the highest percentage of PUFA, as was expected, indicating that cold temperature season is not the only factor for the increase of n-3 PUFA concentration in these species.[Citation21Citation25] Mourete et al.[Citation22] mentioned that the most important factor for the increase of PUFA is the fish diet.
When FA results are expressed as mg/100 g of fillet instead of the percentage of total FA, a rather different pattern emerges. Thus, shows the winter FA content of crevalle jack, AB tuna and AS mackerel, red snapper, and Nile tilapia, as mg/100 g of fillet. It is observed in that the crevalle jack and the AB tuna statistically had the same PUFA content; also no significant differences were observed (p < 0.05) in the n-3 PUFA and DHA+EPA contents for AS mackerel and AB tuna.
TABLE 2 Fatty acid composition (mg/100 g of fillet) in crevalle jack, AB tuna, AS mackerel, red snapper, and Nile tilapia fillets in winter
The n-3 PUFA amount increased, respectively, in the AS mackerel, AB tuna, crevalle jack, and red snapper, which are marine species, unlike the Nile tilapia that showed a lower content. The marine fish species exhibit an EPA+DHA content as high as 364.88 mg/100 g of fillet. Because of the high fat content of the AS mackerel (5.62 g/100 g of fillet), it provided statistically the same DHA+EPA content, approximately 0.8 g/100 g fillet, as the AB tuna whose fat content was lower (2.17 g/100 g fillet), although it had the highest DHA+EPA percentage of the total FAs. The red snapper, which has a similar PUFA percentage as AB tuna, in the quantitative analysis (mg per 100 g of fillet) showed a smaller PUFA content because of its low fat content (1.64 g/100 g fillet). The results confirm the importance of analyzed total lipid content and the FA composition in the evaluation of nutritional quality.
The winter DHA+EPA content of the crevalle jack was approximately 37% lower than for the AB tuna and AS mackerel species, which are best known for their high n-3 PUFA content. However, the crevalle jack was 35% higher than for the red snapper, and it was 2.8 fold higher than for the Nile tilapia (), although the last two species are more popular for consumption than crevalle jack.
Fat Nutritional Indices
There is a large variety of consumable fish species that provide different health benefits. These benefits can be evaluated using the fat quality indices. For example, foods that have a PUFA to SFAs (P/S) ratio above 0.45 are considered desirable,[Citation26] because of their potential to reduce cholesterol in the blood. In this study, the P/S ratios ranged from 0.59 in the Nile tilapia to 1.40 in the AB tuna (). This ratio can be used as an indicator to compare the fat nutritional quality of fish. However, other nutritional indices calculated for the five species may better emphasise the nutritional quality of lipids because they take into account the functional effects of the different FAs.[Citation27] The indices were calculated for FA content per 100 g of fillet. shows the comparison of the fat quality index per species for each season.
FIGURE 1 A: IA, index of atherogenicity; IT, index of thrombogenicity; B: HH, hypocholesterolemic to hypercholesterolemic fatty acid ratio; P/S, polyunsaturated to saturated fatty acids ratio from Crevalle jack (CJ), Atlantic bluefin tuna (ABT) and Atlantic Spanish mackerel (ASM), Nile tilapia (NT) and red snapper (RN), in summer (S), autumn (A), or winter (W). Values are expressed as the mean ± SD (n = 11). Bars represent standard deviation (n = 11). Mean values with different letters differ significantly in the Tukey’s test (p < 0.05).
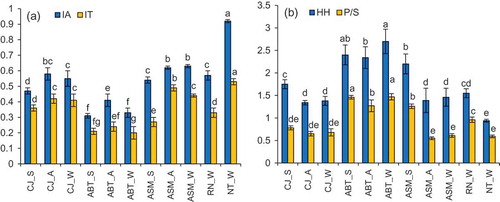
The HH ratio considers the specific effects of FAs on cholesterol metabolism. Higher values of this ratio are desirable. The IA and IT indices are related to pro- and antiatherogenic and pro- and antithrombogenic FAs;[Citation27] the lower the values of both indices, the better the protective potential for CVDs. In a global assessment, crevalle jack, AB tuna, and AS mackerel had their best fat nutritional indices in the summer (). The lowest AI were for AB tuna < crevalle jack < red snapper < AS mackerel < Nile tilapia; the lowest TI were for AB tuna < red snapper < crevalle jack, AS mackerel < Nile tilapia; and the highest HH were for AB tuna < AS mackerel < red snapper < crevalle jack < Nile tilapia.
The average nutritional indices for all seasons (summer, autumn, and winter) for Crevalle jack, AB tuna, and AS mackerel, and those for red snapper and nile tilapia for winter (only season considered for these two species) are shown in . To compare the average nutritional quality of the studied species with respect to other reported species,[Citation27–Citation35] in this work the (IA+IT) to HH ratio was introduced as a general index; the lowest values expressed a better balance between nutritional indices (). summarize all data available in the literature concerning nutritional indices regardless the season. It is worth mentioning that some nutritional indices in were calculated from the original data reported by the different authors. According to , AB tuna showed the best nutritional indices followed by red snapper, AS mackerel, crevalle jack, and Nile tilapia. Other marine and freshwater samples analyzed by several authors are shown in ; in overall terms, the nutritional indices of marine fish were better than freshwater species, and the analyzed oceans offer species with diverse nutritional quality. It is observed that the same species can produce different nutritional indices. Many researchers have reported that the amounts and types of FAs are affected by seasonal changes, species, gender, size, feed intake, geographic location, sexual changes, water temperature, and salinity.[Citation21Citation25] Comparing the crevalle jack with other species, it was evaluated in an acceptable manner. Additionally, crevalle jack is an economical species. Among all the species studied, it is the cheapest, with an average monthly wholesale cost of $1.40 USD per kg, whereas the AB tuna, red snapper, AS mackerel, and Nile tilapia have costs of $14.95, $6.92, $3.55, and $2.08 USD per kg,[Citation36] respectively. There is a relationship between cost and fat nutritional indices; however, in terms of the DHA+EPA content, there is no relationship because AS mackerel had the highest content followed by AB tuna, crevalle jack, red snapper, and Nile tilapia (). According to the recommended daily EPA + DHA intake of 500 mg[Citation37] or 250 mg,[Citation38] for the primary prevention of CVDs, the consumption of 120 g of fresh crevalle jack provides 592 mg, which exceeds both recommendations.
TABLE 3 Comparison of nutritional quality indices in fillet of freshwater and marine fish species
CONCLUSION
The present study showed that AB tuna and red snapper had the best nutritional values of P/S ratio, IA, IT, and HH. However, in terms of the DHA+EPA content, AB tuna and AS mackerel were better options, followed by crevalle jack, red snapper, and Nile tilapia. The nutritional indices indicated that crevalle jack is an adequate source of “healthy” FAs because it is an economical source of DHA+EPA, with 592 mg/120 g of fresh fillet in winter. Additionally, it has an advantage over other species because it has a stable chemical composition of PUFA throughout the analyzed seasons.
FUNDING
The financial support from the Research and Graduate Studies Secretariat of the National Polytechnic Institute of Mexico (SIP-IPN) and the National Council for Science and Technology (CONACyT) is greatly appreciated.
REFERENCES
- Ruxton, C.H.S. The Benefits of Fish Consumption. Nutrition Bulletin 2011, 36, 6–19.
- Shearer, G.C.; Savinova, O.V.; Harris, W.S. Fish Oil—How Does It Reduce Plasma Triglycerides? Biochimica Biophysica Acta 2012, 1821, 843–851.
- Calder, P.C. Very Long Chain Omega-3 (n-3) Fatty Acids and Human Health. European Journal of Lipid Science and Technology 2014, 116, 1280–1300.
- Burri, L.; Berge, K. Recent Findings on Cardiovascular and Mental Health Effects of Krill Oil and Omega-3 Phospholipids. In Omega-6/3 Fatty Acids. Functions, Sustainability Strategies, and Perspectives; De Meester, F.; Watson, R.R.; Zibadi, S.; Eds.; Humana Press-Springer: New York, NY, 2013; 179 pp.
- Ulbricht, T.L.V.; Southgate, D.A.T. Coronary Heart Disease: Seven Dietary Factors. Lancet 1991, 338, 985–992.
- Santos-Silva, J.; Bessa, R.J.B.; Santos-Silva, F. Effect of Genotype, Feeding System, and Slaughter Weight on the Quality of Light Lambs. II. Fatty Acid Composition of Meat. Livestock Production Science 2002, 77, 187–194.
- Muñoz, C.M.; Chávez, V.A.; Ledesma, S.J.A.; Mendoza, M.E.; Calvo, C.C.; Castro, G.M.I.; Ávila, C.A.; Sánchez-Castillo, C.P.; Pérez-Gil, R.F. Tablas de Uso Práctico de los Alimentos de Mayor Consumo; 3rd Ed; McGraw-Hill: Mexico City, Mexico, 2013; 130–138 pp.
- FishBase. Database of Fish Species; Froese, R.; Pauly, D.; Eds.; 2014. Retrieved from http://www.fishbase.org/summary/Speciessummary.php?id=71
- Topping, D.T.; Szedlmayer, S.T. Home Range and Movement Patterns of Red Snapper (Lutjanus Campechanus) on Artificial Reefs. Fisheries Research 2011, 112, 77–84.
- Folch, J.; Lees, M.; Stanley, G.H. A Simple Method for Isolation and Purification of Total Lipids from Animal Tissues. Journal of Biological Chemistry 1957, 226, 497–508.
- IUPAC. Standard Methods for the Analysis of Oils, Fats, and Derivatives, 7th Ed; Paquot, C.; Ed.; Pergamon Press: Oxford, UK, 1992; Method 2.301; 96–98 pp.
- Hernández-Martínez, M.; Gallardo-Velazquez, T.; Osorio-Revilla, G.; Almaraz-Abarca, N.; Ponce-Mendoza, A.; Vásquez-Murrieta, M.S. Prediction of Total Fat, Fatty Acid Composition, and Nutritional Parameters in Fish Fillets Using MID-FTIR Spectroscopy and Chemometrics. LWT–Food Science Technology 2013, 52, 12–20.
- AOAC. Association of Official Analytical Chemists. Official Methods of Analysis of the AOAC International, 17th Ed; AOAC International: Gaithersburg, MD, 2002; Method 996.06.
- Miller, J.N.; Miller, J.C. Statistics and Chemometrics for Analytical Chemistry, 5th Ed; Pearson Education Limited: Essex, UK; 2005; 121–124 pp.
- Hernández-Martínez, M.; Gallardo-Velazquez, T.; Osorio-Revilla, G.; Almaraz-Abarca, N.; Castañeda-Pérez, E. Application of MIR-FTIR Spectroscopy and Chemometrics to the Rapid Prediction of Fish Fillet Quality. CyTA- Journal of Food 2014, 12, 369–377.
- Huang, L.T.C.; Bülbül, U.; Wen, P.C.; Glew, R.H.; Ayaz, F.A. Fatty Acid Composition of 12 Fish Species from the Black Sea. Journal of Food Science 2012, 77, C512–C518.
- Murillo, E.; Rao, K.S.; Durant, A.A. The Lipid Content and Fatty Acid Composition of Four Eastern Central Pacific Native Fish Species. Journal of Food Composition and Analysis 2014, 33, 1–5.
- Budge, S.M.; Iverson, S.J.; Bowen, W.D.; Ackman, R.G. Among- and Within-Species Variability in Fatty Acid Signatures of Marine Fish and Invertebrates on the Scotian Shelf, Georges Bank, and Southern Gulf of St. Lawrence. Canadian Journal of Fisheries and Aquatic Sciences 2002, 59, 886–898.
- Perrotta, T. Florida Museum of Natural History (FLMNH). Crevalle Jack; 2015. Retrieved from http://www.flmnh.ufl.edu/fish/ Gallery/Descript/ CrevalleJack/CrevalleJack.html
- DOF. Diario Oficial de la Federación (Official Journal of the Federation). Agreement which discloses updating the National Fisheries Charter. Secretariat of Agriculture, Livestock, Rural Development, Fisheries and Food (SAGARPA, México) Agosto 24 de 2012.
- Celik, M. Seasonal Changes in the Proximate Chemical Compositions and Fatty Acids of Chub Mackerel (Scomber Japonicus) and Horse Mackerel (Trachurus Trachurus) from the North Eastern Mediterranean Sea. International Journal of Food Science and Technology 2008, 43, 933–938.
- Mourente, G.; Quintero, O.; Cañavate, J.P. Trophic Links of Atlantic Bluefin Tuna (Thunnus Thynnus L.) Inferred by Fatty Acid Signatures. Journal of Experimental Marine Biology and Ecology 2015, 463, 49–56.
- Fromentin, J.M. Description of Atlantic Blue Tuna. International Commission for the Conservation of Atlantic Tunas (ICCAT) Manual, Ch 2.1.5; ICCAT Publications: Madrid, Spain, 2010; 93–111 pp.
- Çelik, M.; Diler, A.; Küçükgülmez, A. Comparison of the Proximate Compositions and Fatty Acid Profiles of Zander (Sander Lucioperca) from Two Different Regions and Climatic Conditions. Food Chemistry 2005, 92, 637–641.
- Huss, H.H. Quality and Quality Changes in Fresh Fish; FAO: Rome, Italy; Fisheries technical paper No. 348. 1995. Retrieved from http://www.fao.org/docrep/v7180e/V7180E05.htm
- HMSO. Department of Health and Social Security. Nutritional Aspects of Cardiovascular Disease (Report on Health and Social Subjects No. 46); Her Majesty’s Stationer Office: London, UK, 1994; 178 pp.
- Ramos, F.M.M.; Lima, R.M.I.; Hiane, P.A.; Talá, S.E.M. Nutritional Value of Seven Freshwater Fish Species from the Brazilian Pantanal. JAOCS 2010, 87, 1461–1467.
- Cladis, D.P.; Kleiner, A.C.; Freiser, H.H.; Santerre, C.R. Fatty Acid Profiles of Commercially Available Finfish Fillets in the United States. Lipids 2014, 49, 1005–1018.
- Afonso, C.; Lourenço, H.M.; Cardoso, C.; Barranda, N.M.; Carvalho, M.L.; Castro, M.; Nunes, M.L. From Fish Chemical Characterisation to the Benefit-Risk Assessment—Part A. Food Chemistry 2013, 137, 99–107.
- Martelli, R.; Zotte, A.D.; Bonelli, A.; Lupi, P.; Franci, O.; Parisi, G. Macronutrient and Fatty Acid Profiles of Meagre (Argyrosomus Regius) Fillets As Influenced by Harvesting Time and Boiling. Italian Journal of Animal Science 2013, 12, 538–545.
- Misir, G.B.; Tufan, B.; Köse, S. Monthly Variation of Total Lipid and Fatty Acid Contents of Atlantic Bonito, Sarda Sarda (Bloch, 1793) of Black Sea. International Journal of Food Science Technolgoy 2014, 49, 2668–2677.
- Al-Busaidi, M.; Poulose, Y.; Al-Rabhi, W.; Al-Harthy, K.; Al-Waili, A.; Al-Mazrooei, N.; Al-Habsi, S. Fatty Acid Profile and Selected Chemical Contaminants in Yellowfin Tuna from the Arabian Sea. International Journal of Food Properties 2015, 18, 2764–2775.
- Fernandes, C.E.; Da Silva, V.M.A.; De Almeida, R.M.; Sarubbo, L.A.; Cardoso, A.S.A.; De Melo, F.A.B. Nutritional and Lipid Profiles in Marine Fish Species from Brazil. Food Chemistry 2014, 160, 67–71.
- Khan, A.J.; Al-Oufi, H.; McLean, E.; Goddard, S.; Srikandakumar, A.; Al-Sabahi, J. Analysis of Fatty Acid Profiles of Kingfish (Scomberomorus Commerson) from Different Coastal Regions of Sultanate of Oman. International Journal of Food Properties 2003, 6, 49–60.
- Aziz, N.A.; Azlan, A.; Ismail, A.; Alinafiah, S.M.; Razman, M.R. Quantitative Determination of Fatty Acids in Marine Fish and Shellfish from Warm Water of Straits of Malacca for Nutraceutical Purposes. BioMed Research International Volume 2013, 284329, 12 pages.
- CONAPESCA. Comisión Nacional de Acuacultura y Pesca (National Commission of Aquaculture and Fisheries). Monthly Average Wholesale Price and Level of Presence at Market “La Nueva Viga;” Retrieved from http://www.conapesca.sagarpa.gob.mx/wb/cona/cona_vi_precio_promedio_mensual_al_mayoreo_y_nivel
- ISSFAL. International Society for the Study of Fatty Acids and Lipids. Recommendations for Intake of Polyunsaturated Fatty Acids in Healthy Adults; Retrieved from http://www.issfal.org/statements/pufa-recommendations/statement-3
- EFSA. European Food Safety Authority. Scientific Opinion on Dietary Reference Values for Fats, Including Saturated Fatty Acids, Polyunsaturated Fatty Acids, Monounsaturated Fatty Acids, Trans Fatty Acids, and Cholesterol. EFSA Journal 2010, 8, 1461–1568.