
 ?Mathematical formulae have been encoded as MathML and are displayed in this HTML version using MathJax in order to improve their display. Uncheck the box to turn MathJax off. This feature requires Javascript. Click on a formula to zoom.
Abstract
The present study investigated effects of total solids content of honey maltodextrin systems and the component ratio on water sorption isotherm and water plasticization behavior of the vacuum-dried solids. The Guggenheim, Anderson, and de Boer model fitted well to the water sorption data with monolayer water contents over the range of 4.8–6.2 g water/100 g of solids. Water plasticization of the powder followed the Gordon–Taylor equation, with the Tg of dry solids of 30–43°C depending on composition. The critical water content of dried honey at 25°C was lower than the monolayer water content. A maltodextrin ratio more than 50% decreased water plasticization sensitivity to the highest extent.
Introduction
Honey contains up to 65% (w/w) sugars, primarily fructose (35.7–41.7%, w/w) and glucose (29.7–34.9%, w/w).[Citation1] The ratio of fructose to glucose is in an average 1.2:1.[Citation1] Because of the high glucose content and its lower solubility glucose crystallization is common during storage of honey, and is known as honey granulation. The granulation of honey accelerates with increasing glucose content.[Citation2] Honey granulation reduces the sensory acceptability of honey. One alternative to honey liquid with improved shelf life is conversion of honey into honey powder. The production of honey powder could also use crystallization of glucose to stabilize honey powders.
Production of stable solid particles from honey cannot be completed at normal ambient condition because of the low glass transition temperatures, Tg of fructose and glucose, i.e., 5 and 31°C, respectively.[Citation3] The water content of fresh honey can exceed 20% (w/w) and honey is physically a viscous but fluid syrup because of the significant plasticization of the component sugars by water. The reported Tg of honey are low and vary according to several studies: –46 to –40°C,[Citation4] –47 to –34°C,[Citation5] and –51 to –35°C.[Citation6]
Honey powder is commercially produced with drying aids by spray drying and drum drying.[Citation7] The use of high molecular weight drying aids to enhance dehydration is necessary. Starch, modified starch, maltodextrins, and Arabic gum are some of the available filler materials for drying of honey. Nurhadi et al.[Citation8] developed a vacuum oven drying method for honey using starch, pre-gelatinized starch, maltodextrin, and Arabic gum. In vacuum drying, the drying rate was higher compared to conventional drying (cabinet drying). A combination of the high drying rate (low temperature at low absolute pressure) and use of the filler materials enabled the production of powder with a high level of natural solids.
Shi and Bhandari[Citation9] and Nurhadi et al.[Citation8] used water as an aid to enhance homogenous mixing of honey and maltodextrin. The amount of water added affected total solid content of the liquid (liquid honey mixture). The total solids content of the liquid being dried is an important factor in determining the success of the drying process. In producing honey powder by spray drying, the total solids content of the liquid was set up to 10[Citation9] or 25% (w/w).[Citation8] In addition, we successfully produced honey powder by freeze drying at total solids content of 20% (w/w) but freeze drying was not successful at 40% (w/w) of solids. In vacuum oven drying, different total solids content of honey’s mixture, maltodextrin ratio, and maltodextrin types might affect the drying process and result in various powder properties of the dried honey. Thus, the present study aimed to investigate the effects of water (total solids content), and added maltodextrin type and ratio on dehydration and water sorption and water plasticization behavior of the resultant solids (honey powder) produced using vacuum drying.
Materials and Methods
Materials, Processing, and Treatments
Honey Boyne Valley Honey (500 g) was purchased from a local supermarket in Cork, Ireland. Maltodextrins with various dextrin equivalent values; M 150 (DE 15), M 100(DE 10), and M 40 (DE 4) were from Grain Processing Corp, IA, USA. The water content of honey and maltodextrins was determined by vacuum drying (Pabs < 100 mbar) at 70°C for about 6 h.[Citation10] Honey powder was prepared using formulation given in by dissolving maltodextrin in water using a stirrer at 40°C until a clear solution was obtained and then finally mixed with honey and stirred for about 10 min until the mixture was homogenous. Samples of 10 g honey mixture were then prepared on petri dishes which were closed with a cover (the cover was perforated to allow water evaporation). Treatment 1 (H:M:W 6:4:0) had a different preparation. The honey and maltodextrin were mixed by spoon manually and maltodexrin was added to honey gradually. The solution and the mixture from treatment 1 were dried using a vacuum oven (Pabs < 10 mbar, T = 60°C) for 3 h. After 3 h of drying, the material was cooled in a desiccator with P2O5 to room temperature (about 30 min), the dried solids were grinded using mortar and pestle, and filled into a vial for storage in a desiccator with P2O5 until further analysis. The experimental setup had seven solid compositions listed in .
TABLE 1 Solids compositions of honey powder formulations
Water Sorption Isotherm
The water sorption isotherm data were obtained from gravimetric water content measurements of steady state water contents at various water activities. Samples of 1 g of honey powder were prepared in glass vials and stored in vacuum desiccators over various saturated salt solutions. (LiCl, CH3COOK, MgCl2, K2CO3, NaNO2, and NaCl gave water activities, 0.11, 0.23, 0.33, 0.44, 0.66, and 0.76, respectively). The samples were weighed at 24-h intervals for 14 days (for aw 0.11, 0.23, 0.33, 0.44) and for 21 days for samples stored at aw 0.66 and 0.76. The original water contents of the honey powder were determined by dehydration in vacuum oven at 100°C for 6 h. The equilibrium water content of each sample at various water activity was taken from the weight showing less than 0.001 g difference of consecutive measurements.[Citation11] Analyses were carried out in triplicate. The relationship of water activity and the corresponding equilibrium water content was modeled using the Brunauer, Emmet, and Teller (BET) (Eq. 1) and Guggenheim, Anderson and de Boer (GAB) relationships (Eq. 2).
where X is water content (g water/ g dry solid), aw is water activity, Xm is monolayer water content, and Xm, C, and K are constants. The goodness-of-fit of the models was evaluated with the relative percentage square (% RMS; [Eq. Citation3]), where the value less than 10% indicated a very good fit.[Citation12]
Glass Transition Temperature
The glass transition temperature was measured with differential scanning calorimetry (DSC, Mettler Toledo Schwerzenbach, and Switzerland). Honey powder, 10–20 mg of was prepared in a standard 40 μL aluminum pan and equilibrated at desiccators over various saturated salt solutions (with various water activity of 0.11, 0.23, 0.33, and 0.44) for 1 week and then hermetically sealed and analyzed with DSC. Samples were first analyzed from –40 to 70°C at a heating rate of 5°C/min, cooled from 70 to –40°C at 10°C/min and reheated from –40 to 70°C at 5°C/min. The glass transition temperature was determined using the STARe software version 8.10 (Mettler Toledo Schwerzenbach, Switzerland). The first heating scan was intended to erase thermal history effect that might affect the Tg determination.[Citation13] The second heating scan was used for Tg analysis. The relationship between water content and glass transition was modelled with Gordon–Taylor Eq. (4).
Tg1 is glass transition temperature of dry solid honey powder, Tg2 is glass transition temperature of water, X is fraction of water, kG-T is constant.
Results and Discussion
Vacuum Drying
All formulations could be used to produce honey powder successfully. Contrast to honey powder production by spray drying which needs total solids content of honey mixture of 10–25% (w/w) and ratio honey’s solid to total solid less than 50% (w/w),[Citation8,Citation9] the vacuum drying was more effective. Formulations with total solids contents up to 87% (w/w) or formulations with maltodextrin ratio to total solid up to 33% (w/w) could produce honey powder successfully. Honey cannot be dehydrated into powder without the addition of other materials (filler materials of a high glass transition temperature). The glass transition temperatures were from –47 to –34°C,[Citation5] or –51 to –34°C[Citation6] and its value was dependent on the water content and composition. The main factor that enabled dehydration of honey by vacuum drying was the addition of a filler material such as maltodextrin and the use of a vacuum. The addition of maltodextrin provided a solids composition with a higher glass transition temperature which could form a solid structure at room temperature.[Citation14,Citation15] The second main factor was the use of a low pressure. At low pressure, water could evaporate at low temperature. The present study used an oven temperature of 60°C and pressure ≤100 mbar. The vapor pressure of water at 60°C was 199.2 mbar,[Citation16] which enhanced evaporation water from honey.
Evaporation of water from honey in the vacuum oven produced a foam () and an increase of the evaporation surface. All materials except the formulations H:M:W 6:4:0 with the highest solid fraction (87%, w/w) did not produce foam-like appearance (). From , it can be seen that foaming started after 15 min of drying. The vigorous boiling of water and bubbling made accelerated the drying process. As a result, a mixture of amorphous and crystalline states of sugars co-existed in the powder.
FIGURE 1 The honey mixture appearance during drying by vacuum oven; A: the formulation of H:M:W 6:4:0; B: the formulation of H:M:W 6:4:10.
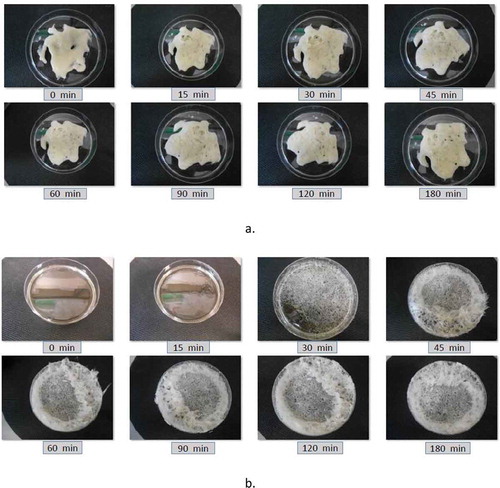
FIGURE 2 Water activity and experimental and GAB calculated water content of honey powder; A: at different total solid content of honey mixture; B: at different DE value of maltodextrin; C: at different maltodextrin ratio.
Water Sorption Isotherm
The water content of honey powder stabilized at different times in a series of water activity experiments. It was found that at a lower water activity (up to 0.44), the water content of the honey powder stabilized in less than 2 weeks, while at higher water activities it took almost 3 weeks (data not shown). The BET and GAB models are the main fundamental models relating water content and water activity.[Citation17,Citation25] The BET model is backed up by strong theoretical basis for the use in determining stability,[Citation18] but the model is used over more narrow range water activities (0–0.5).[Citation17] The weakness of BET model is overcome by GAB model which could fit to experimental data over a wider range of water activities (0–0.95).[Citation17] The fitness of model was analyzed by the % RMS value (rather than R2 value), where a value less than 10%, showed a good fit to water sorption data.[Citation12] As presented in , the GAB model showed much lower % RMS than the BET model. The GAB model gave a better fit than BET to water sorption data of honey powder. Based on the value of C of the BET model (), all the sorption isotherms of honey powder followed the type II of Brunauer water sorption isotherm classification with value in the range of 2–50.[Citation17] However, the sorption isotherm shape was less sigmoidal and this phenomenon is common for materials with high sugar contents.[Citation19] This type II water sorption of honey powders was similar to other foods with high sugar contents, such as strawberry[Citation20] and raspberry.[Citation11]
TABLE 2 The BET and GAB model parameters of honey powder and its corresponding fit parameter
The monolayer water content (Xm) was considered as an indicator of stability of low moisture foods.[Citation12] A food with a higher monolayer water content is considered as more stable in storage than a food with lower monolayer water content especially in term of microbial deterioration.[Citation11] As given in , the monolayer water content (Xm) of both models showed similar trend for each treatment and showed no significant differences in agreement with Rizvi,[Citation12] who stated that the monolayer water content of BET and GAB model were not significantly different. A comparison of formulations 1, 2, and 3, showed that the addition of water to lower total solids content might increase the monolayer water content. The addition of water made foam formed more easily as a result the drying rate is getting faster and amorphous component was formed preferably instead of crystalline component. Vallenbroek et al.[Citation21] showed that the amorphous ratio of lactose was proportional to the monolayer water content of the mixture of amorphous and crystalline lactose.
Maltodextrin is a hydrolysis product of starch and the extent of hydrolysis is given by the dextrose equivalent (DE) value. The higher the DE value of maltodextrin, the lower is the average molecular weight of the maltodextrin resulting in a lower the glass transition temperature. Maltodextrin is added to honey to increase its glass transition temperature to enable honey solids formed to remain stable at room temperature. Thus the addition of maltodextrin gave positive impact to the stability of honey powder (). According to , the lower the DE value of maltodextrin and the higher ratio of maltodextrin used, the higher was the monolayer water content resulting in more stable honey powder formed.
Water Plasticization Behavior
The honey powder produced by vacuum oven drying gave a mixed structured powder with amorphous and less portion of crystalline components. The crystalline fraction might be glucose monohydrate which showed a melting endotherm peak at 71–78°C (data not shown) which was very close with melting temperature of glucose monohydrate 83°C.[Citation22] Water is the main plasticizer in food solids. The function of water as a plasticizer is related to complex mechanism that involved hydrogen bond formation between water and food component and change of the matrix free volume.[Citation23] The effect of water as plasticizer in the honey powder would reduce its glass transition temperature ().
FIGURE 3 Water content and glass transition temperature of vacuum dried honey powder; A: at different total solid content of honey mixture; B: at different DE value of maltodextrin; C: at different maltodextrin ratio.
Honey powder from highest total solid fraction of the honey mixture (H:M:W 6:4:0) had the lowest glass transition at each water content, followed by two other formulations of lower total solid fraction H:M:W 6:4:5 and H:M:W 6:4:10, respectively. The honey powder from highest total solid fraction of mixture might contain more crystalline components and this result was backed up by the result that honey powder produced from highest total solid content (H:M:W 6:4:0) which had the lowest ΔCp value then followed by honey powder H:M:W 6:4:5 and H:M:W 6:4:10 (). This result complied with Lehto et al.[Citation13] finding that the amorphous content (amorphicity) is proportional to the value of ΔCp of DSC analysis. From , it can be seen that the honey powder from highest solid fraction formulation had lowest temperature. It can be understood that the decrease in amorphous phase in honey powder with high solid content (H:M:W 6:4:0) affected the increasing water ratio to amorphous phase, thus it decreased the glass transition temperature. The effect of maltodextrin ratio on glass transition temperature can be seen in . The glass transition of honey powder increased as the ratio of maltodextrin increase from 33 to 44% and 54%. However, different DE values of maltodextrin had minor effects on the glass transition temperature of the honey powders ().
Table 3 The Gordon-Taylor model parameters based on data of onset, midpoint and endpoint glass transition temperature and the average of Δcp values and standard deviations
The Gordon–Taylor model is often used to relate the water content and glass transition temperature of amorphous solid. The equation contains two constants (Tg1 or dry solid glass transition temperature) and a constant, K value, while the Tg of water of –135°C may be used. The Gordon–Taylor model related well the water content and glass transition temperature data of honey powders with R2 value more than 0.9 (). The value of glass temperature of dry solids of honey powder was in the range of 30 to 38°C being very close to the onset glass transition temperature of amorphous glucose.[Citation14] The significantly highest value of the glass transition of honey powder dry solid was obtained for formulation with the highest maltodextrin ratio (H:M:W 5:5:10). It was suggested that the solid ratio of maltodextrin to total solid 54% (or honey to total solid 46%) affected significantly the glass transition temperature of the system. It complied with Roos,[Citation14] who stated that the minimum amount ratio of maltodextrin to sugar more than 50% would increase the glass transition temperature of the mixture significantly.
Water Sorption and Water Plasticization Relationship
Along with water activity, glass transition temperature is used as an indicator for predicting food stability. It is suggested that a product stored at a temperature lower than its glass transition temperature, will be stable better because all chemical and physical change occurred slowly below the glass transition temperature.[Citation14] The correlation between water sorption isotherm and water plasticization of honey powder can be found in . The storage temperature chosen was 25°C and the water content and its corresponding water activity of honey with glass transition temperature at 25°C is called critical water content and critical water activity, respectively.[Citation14]
TABLE 4 The critical water content and water activity of honey powder based on the onset, midpoint, endpoint glass transition temperature, and monolayer water content and corresponding water activity
The critical water content and critical water activity of honey powder based on the onset, midpoint, and endpoint glass transition temperature were lower than the monolayer water content and its corresponding water activity. The same result was obtained for products with high sugar contents such as strawberry,[Citation23] kiwifruit,[Citation26] raspberry,[Citation27] and grapefruit.[Citation24] Sablani et al.[Citation21] explained that for high sugar food, the effect of water in depressing glass transition temperature is more significant than the effect of sugar in reducing the water activity. Thus critical water content and corresponding water activity of honey powder is more appropriate to use as a parameter of stability than the monolayer water contents. As presented in , honey powder with the highest ratio of maltodextrin (formulation 7) gave significantly the highest critical water content and water activity to other honey powders. It was suggested that the ratio maltodextrin higher than 50% played more significant effect on honey powder’s stability than the treatment of DE value and solid content.
Conclusions
The treatments of solid content and DE value less significantly affected the water sorption isotherm and water plasticization behavior of the resulted honey powder. However, the treatment of maltodextrin ratio affected more significantly the properties of honey powder. The honey powder from maltodextrin ratio more than 50% had the highest critical water content and critical water activity at storage temperature of 25°C. The critical water content of honey powder at 25°C was lower than that of their monolayer water content, thus the critical water content was more appropriate as an indication of honey powder stability during storage
References
- Chmielewska, H.R. Honey. In Chemical and Fuctional Properties of Food Saccharides; Tomasik, P.; Ed.; CRC Press: Boca Raton, FL, 2004.
- Ram, A.K. Production of Spray Dried Honey Powder and Its Application in Bread. A Thesis in Louisiana State University and Agricultural and Mechanical College, USA. http://etd.lsu.edu/docs/available/etd-07052011-085925/unrestricted/kasalRam_Thesis.pdf ( accessed August 12, 2014).
- Roos, Y.H. Melting and Glass Transition of Low Molecular Weight Carbohydrates. Carbohydrate Research 1993, 238, 39–48.
- Sopade, P.A.; Haley, P.; Bhandari, B.; D’Archy, B.; Doebler, C.; Coffin, N. Application of The Williams-Landel-Ferry Model to The Viscosity-Temperature Relationship of Australian Honeys. Journal of Food Engineering 2002, 56, 67–75.
- Lehto, V.P.; Tenho, M.; Heikkila, K.V.; Harjunen, P.; Peallysho, M.; Valissari, J.; Niemela, P.; Jarvinem, K. The Comparison of Seven Different Methods to Quantify the Amorphous Content of Spray Dried Lactose. Powder Technology 2006, 167, 85–93.
- Ahmed, J.; Prabhu, S.T.; Raghaven, G.S.V.; Ngadi, M. Physico-Chemical, Rheological, Calorimetric, and Dielectric Behaviour of Selected Indian Honey. Journal of Food Engineering 2007, 79, 1207–1213.
- Cui, Z.-W.; Juan Sun, L.; Chen, W.; Sun, D.W. Preparation of Dry Honey by Microwave-Vacuum Drying. Journal of Food Engineering 2008, 84, 582–590.
- Nurhadi, B.; Andoyo, R.; Mahani, R.; Indiarto, R. Study the Properties of Honey Powder Produced from Spray Drying and Vacuum Drying Method. International Food Research Journal 2012, 19(3), 849–854.
- Shi, Q.; Fang, Z.; Bhandari, B. Effect of Addition of Whey Protein Isolate on Spray Drying Behaviour of Honey with Maltodextrin as a Carrier Material. Drying Technology 2013, 31, 1681–1692.
- Park, Y.W.; Bell, L.N. Determination of Moisture and Ash Content of Foods. In Handbook of Food Analysis, 2nd Ed; Nollet, L.M.L.; Ed.; Marcel Dekker Inc.: New York, NY, 2004.
- Sablani, S.S.; Kasapis, S.; Rahman, M.S. Evaluating Water Activity and Glass Transition Concepts for Food Stability. Journal of Food Engineering 2007, 78, 266–271.
- Rizvi, S.S.H. Thermodynamic Properties of Foods in Dehydration. In Engineering Properties of Foods, 3rd Ed; Rao, M.A.; Rizvi, S.S.H.; Datta, A.K.; Eds.; CRC Press: Boca Raton, FL, 2005.
- Liu, Y.; Bhandari, B.; Zhou, W. Glass Transition and Enthalpy Relaxation of Amorphous Food Saccharides: A Review. Journal of Agricultural and Food Chemistry 2006, 54, 5701–5717.
- Roos, Y.H. Phase Transition in Foods; Academic Press: San Diego, CA, 1995.
- Adhikari, B.; Howes, T.; Bhandari, B.R.; Langrish, T.A.G. Effect of Addition of Proteins on the Production of Amorphous Sucrose Powder through Spray Drying. Journal of Food Engineering 2009, 94, 144–153.
- Toledo, R.T. Fundamentals of Food Process Engineering, 3rd Ed; Springer: New York, NY, 2007.
- Lazaridou, A.; Biliaderis, G.G.; Bacandritsos, N.; Sabatini, A.G. Composition, Thermal, and Rheological Behaviour of Selected Greek Honeys. Journal of Food Engineering 2004, 64, 9–21.
- Rahman, M.S. State Diagram of Foods: Its Potential Use in Food Processing and Product Stability. Trends in Food Science and Technology 2006, 17, 129–141.
- Guizani, N.; Al-Sardi, G.S.; Rahman, M.S.; Barnaz, S.; Al-Alawi, A.A. State Diagram of Dates: Glass Transition, Freezing Curve, and Maximal-Freeze-Concentration Condition. Journal of Food Engineering 2010, 99, 92–97.
- Moraga, G.; Martinez-Novarrete, N.; Chiralt, A. Water Sorption Isotherm and Glass Transition in Strawberries: Influence of Pretreatment. Journal of Food Engineering 2004, 62, 315–321.
- Vollenbroek, J.; Hebbink, G.A.; Ziffles, S.; Steckel, H. Determination of Low Levels of Amorphous Content in Inhalation Grade Lactose by Moisture Sorption Isotherms. International Journal of Pharmaceutics 2010, 395, 62–70.
- Foster, K.D. The Prediction of Sticking in Dairy Powders. Thesis in Massey University. New Zealand. http://mro.massey.ac.nz/bitstream/handle/10179/1782/02_whole.pdf?squence=1 ( accessed on August 12, 2014).
- Mrad, N.D.; Bonazzi, C.; Boudhrioua, N.; Kechaou, N.; Curtois, F. Influence of Sugar Composition on Water Sorption Isotherms and On Glass Transition in Apricots. Journal of Food Engineering 2012, 111, 403–411.
- Fabra, M.J.; Tolens, P.; Moraga, G.; Martinez-Navarrete, N. Sorption Isotherm and State Diagram of Grape Fruit as a Tool to Improve Product Processing and Stability. Journal of Food Engineering 2009, 93, 52–58.
- Labuza, T.P.; Altunakar, B. Water Activity Prediction and Moisture Sorption Isothermal. In Water Activity in Foods. Fundamentals and Applications; Cannovas, G.V.B.; Fontana Jr., A.F.; Schmidt, S.J.; Labuza, T.P.; Eds.; IFT Press: Ames, Iowa, 2007.
- Moraga, G.; Martinez, N.; Chiralt, A. Water Sorption Isotherms and Phase Transitions in Kiwi Fruit. Journal of Food Engineering 2006, 72, 147–156.
- Syamaladevi, R.M.; Sablani, S.S.; Tang, J.; Powers, J.; Swanson, B.G. State Diagram and Water Adsorption Isotherm of Raspberry (Rubus Idaeus). Journal of Food Engineering 2009, 91, 460–467.