
Abstract
Fruit properties, including ripeness, are still being measured destructively in most countries. Recently, an increased attention has been given to non-destructive methods, such as ultrasonic techniques, for quality assessment of food commodities. The aim of this study was to evaluate the feasibility of ultrasonic spectroscopy to monitor the changes of mechanical properties (rupture force and modulus of elasticity) and chemical properties (soluble solids content) in two cultivars of persimmons (Karaj and Shomali) during 3 weeks of storage. Samples’ ultrasonic properties such as ultrasonic velocity and attenuation coefficient were analyzed with transducers, and their textural properties were obtained using destructive compression test and their refractometric properties were measured from its fresh-squeezed juice in laboratory. Mechanical and chemical properties were statistically modeled from ultrasonic parameters. The results showed that our proposed model could predict persimmons’ mechanical and chemical properties well, i.e., rupture force (R2 = 0.893/0.837; RMSE = 3.683/3.849 for Shomali and Karaj cultivars, respectively), modulus of elasticity (R2 = 0.826/0.861; RMSE = 0.231/0.217 for Shomali and Karaj cultivars, respectively) and soluble solids content (R2 = 0.931/0.987; RMSE = 0.519/0.851 for Shomali and Karaj cultivars, respectively).
INTRODUCTION
The persimmon (Diospyros kaki L.) is a fruit native to China, but now cultivated in warm regions of the world. This fruit is a good source of bioactive compounds, such as ascorbic acid, condensed tannins, and carotenoids. These compounds are related to beneficial health effects mainly due to their antioxidant properties.[Citation1] The persimmon industry in Iran has been expanding due to domestic demand and export market opportunities for persimmon fruits. However, limited studies have yet been conducted on postharvest characteristics of this fruit even in main producing countries.[Citation2]
Monitoring the ripening process and qualifying the ripeness level of product are helpful to distributors and consumers in determining when to ship and when to eat.[Citation3] An important criterion in determining ripeness in fruits is measuring their soluble solids contents (SSC).[Citation4] Therefore, the use of advanced technology for ripening control based on SSC is advantageous. On the other hand, during postharvest handling, packing, transportation, distribution, and storage, agricultural produce are very frequently subjected to mechanical loadings. The fruits may be subjected to compression applied by the bulk of overhead fruits in storage bins or when operators force fruits into small and tight room or overfilled cartons shut.[Citation5] If these forces are more than what fruit tissue can tolerate, fruit is failed, and mechanical damages occur.[Citation6] Mechanical damages cause both immediate and subsequent physiological responses in wounded and adjacent tissues, leading to complex physiological, metabolic, and enzymatic changes. The changes include increased respiration at the injured regions, enhancing general deterioration, excessive tissue softening, tissue browning, wilting, discoloration, development of off-flavors, texture breakdown, and, as a consequence, affecting negatively the products’ visual aspects and their commercial value, and overall, the quality of end products.[Citation6–Citation8] It is also well known that knowledge of textural properties of biomaterials is essential to genetic improvement,[Citation6] product quality monitoring, and control, ranging from decision upon from readiness to harvest to assessment of impacts caused by postharvest handling and processing operations on product shelf life and consumer preference and acceptability.[Citation9]
A wide range of destructive and non-destructive methodologies and relevant instruments have been used to quantify and measure the quality attributes of fresh and processed foods. Destructive techniques for measuring textural and chemical parameters have the advantage of being highly accurate, but as negative aspects of these tests the samples are destroyed and wasted.[Citation10] Hence, currently, a fundamental challenge in postharvest technology is non-destructive characterization of fruits in order to maximize the accuracy of measurements while reducing waste.[Citation4] Most of the non-destructive techniques invented by researchers are mainly used for research purposes and laboratory analyses, but rarely they have been used in industrial food environments. The reason of this limitation stems from the fact that these technologies are time consuming, expensive, and they require sophisticated experimental devices and software applications.[Citation11,Citation12] Among the indirect methods for food quality measurement, ultrasound technology has high potential because it is non-destructive, rapid, and reliable.[Citation9] In addition, this technology is easy to use, inexpensive, and precise, which requires no sample withdrawing and can be utilized as in-line and online measurement tools for probing on physicochemical and rheological properties of food products.[Citation13–Citation15]
Ultrasonic waves have been used to determine mechanical and chemical properties of foodstuffs such as avocados,[Citation11] apples, pears, peaches,[Citation16] and tomatoes.[Citation17] A review on different ultrasonic techniques used for determining food properties during the last two decades can be found in Awad et al.[Citation15] Although the ultrasonic technique can be useful for evaluating the mechanical and chemical properties of biological materials,[Citation16] most ultrasonic transducers used in prior studies were designed for objects with flat surfaces, which are mostly found in industrial applications. These transducers were not yet well-suited to fruits with uneven surfaces. Therefore, in some cases, the fruits were required to be sliced uniformly to make a complete contact with the surface of the ultrasonic transducers.[Citation10,Citation18] Also, in another method, which has been successful in performing ultrasonic measurements on fruit, two fine-tipped ultrasonic transducers were angled toward each other, close together (5–18 mm) on the surface of the sample, and the attenuation and velocity of propagation were measured between them. The disadvantage of this method is that the transducers must be properly angled at 120°, making this method difficult to apply automatically or in a non-laboratory environment.[Citation19] Non-contact ultrasonic transducers are not practically suitable for very high acoustic impedance materials, such as fruits and vegetables, either.[Citation20] Recently, to solve these problems, an ultrasonic transducer for fruit has been successfully developed by Kim et al.[Citation10] Their transducer had a Teflon-made curved front matching layer that matches the surfaces of fruits. The matching layer acts also as an acoustic lens that maximizes transmission of ultrasound from the piezoelectric to the fruit. Based on the above mentioned considerations, the objective of the present study was to investigate the capability of ultrasonic spectroscopy for evaluating and modeling the changes in textural and chemical properties (i.e., rupture force, modulus of elasticity, and SSC) of persimmon fruit during postharvest ripening.
MATERIALS AND METHODS
Persimmon Samples
In this study, two cultivars of persimmon, Karaj (astringent) and Shomali (non-astringent), were used. These cultivars are widely planted in Iran for fresh consumption. Visually observed fruits’ external color indicate the right time for harvesting.[Citation21] Accordingly, the sample fruits were hand harvested from a commercial orchard in Tehran when the entire fruits were unripe and mostly yellow with a little green at the stylar end side. Karaj persimmons were harvested in early October, approximately 2 weeks prior to when the Shomali cultivars were harvested. After harvest, the fruits were transported to a laboratory in where the study samples were carefully selected to be of almost uniform appearance (i.e., in terms of their size, shape, and color) and free from any decay or visible physiological damage. After completing the naked-eye inspection, the physical and morphological properties of these samples were measured. These properties included mass (m), length (l), fruit equatorial diameter (d), and shape index (SI) defined as l/d. The samples were then placed in warehouse for 21 days under controlled conditions (at ~20°C, ~50% relative humidity), in order to have variations in ripening stage among samples. Spoiled fruits during storage were removed and finally a total number of 320 persimmons (160 from each cultivar) were used for experimentation. During the 21-day ripening process (from unripe to over-ripe stage) ultrasonic measurements were conducted on 20 randomly chosen persimmons, which were code-labeled for identification, every 3 days. Then, the fruits were subjected to both textural analysis by the flat plate compression and chemical analysis by SSC determination test. All experiments were carried out in a laboratory where room temperature and RH were in the range of 20 ± 1°C and 45–50%, respectively.
Ultrasonic Measurement
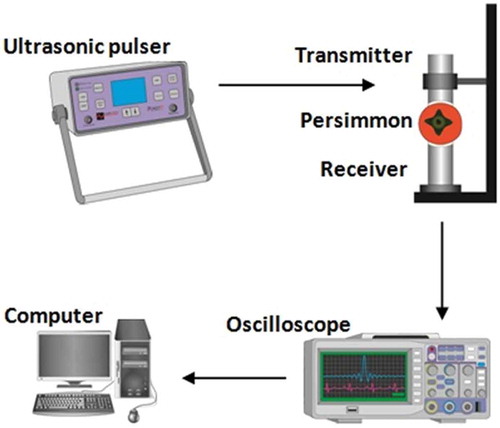
In order to measure the ultrasonic wave velocity and attenuation coefficient in persimmon samples, we followed the method described in Kim et al.[Citation16] by using two ultrasonic transducers in attenuation (or through-transmission) mode. The ultrasonic measurements were taken by using the experimental set-up consisted of a pair of ultrasonic transducers, an ultrasonic pulser (PUNDIT 7, CNS FARNELL Inc., USA), a digital oscilloscope (5020, Protek, Korea), and a desktop computer. The set-up is schematically shown in . In this system the ultrasonic transducer had a curved Teflon-coated plate (front matching layer) to follow the fruit surface and make direct contact to it and furthermore to operate as an acoustic lens. The central frequency, diameter of the ultrasonic transducer, curvature of the front matching layer, and its thickness at center were 100 kHz, 30 mm, 35 and 4.3 mm, respectively. Vacuum grease was used to fill the gap between sensors and specimen to avoid high frequency attenuations by air in gaps.[Citation22] Ultrasonic waves are attenuated very rapidly in fruits[Citation16,Citation18] and ultrasonic frequencies less than 200 kHz yield best results when applied to fruit. This is because the lower frequency minimizes the effect of wave scattering caused by resonance of inter-cellular voids in the fruit’s flesh.[Citation19] Accordingly, also in this research, a high-power and low-frequency ultrasonic pulser was connected to the ultrasonic transmitter to generate ultrasonic waves. The waves passed through the whole fruit and output electrical signals, received by the ultrasonic receiver, were monitored on a digital oscilloscope screen. The oscilloscope was connected through a Universal Serial Bus (USB) port to a personal computer (PC). A program was written in Matlab to analyze the signal data collected at the end of transmission. The surface of each sample was gently cleaned with a paper towel and then the transmission was carried out in a direction perpendicular to the fruit’s stylar-calyx axis. Probes were placed on a holder and relatively constant contact pressure was applied on the samples. For each ultrasonic measurement, five signal acquisitions were taken and the time of flight was computed from the averaged signal. The ultrasonic transmission velocity was estimated according to the following equation:[Citation10]
FIGURE 1 Diagram of the ultrasonic measuring system.
where V is the ultrasonic velocity in the fruit (m/s), d is the thickness of the fruit (m), t is the time of flight (s). The attenuation coefficient as an indicator of attenuated ultrasound energy through the sample was calculated by using the following equation:[Citation10]
where α is the apparent attenuation coefficient of the material (dB/mm), d is the distance traveled by the wave (mm), A0 is the initial amplitude of the signal measured as the peak-to-peak voltage (V), A is the amplitude of the signal at distance d (V).
Texture and Chemical Measurements
Once the samples were measured ultrasonically, they were used in compression test using a universal testing machine (STM-5, Santam, Iran). This instrument was equipped with a load cell of 1 kN capacity. The measurement accuracy was ±0.001 N for force and 0.0001 mm for deformation. The samples were placed on the center of a stationary plate so that its stylar end-calyx end axis was horizontal. The samples were then pressed by the moving parallel stainless steel circular flat plate (150 mm in diameter) at a loading speed of 10 mm/min.[Citation6] As the test proceeded on a sample, its force-displacement curve was generated and displayed on a connected PC monitor simultaneously up to the point of sample failure. Subsequently, rupture force, which was the load peak at failure time, and modulus of elasticity, which was the slope of the straight-line region of the curve, were measured from the curve. After the ultrasonic and mechanical measurements were completed, SSC was determined. The SSC value of the juice extracted from each sample fruit was measured using a manual refractometer (ATC-1E, ATAGO, Japan) with a working range of 0–32°Brix.
Regression Models
The modulus of elasticity, rupture force and SSC were modeled as linear and non-linear functions of ultrasonic velocity and attenuation. The general forms of these regression functions are given in Eqs. 3–5:
where E is apparent modulus of elasticity (MPa), Fr is rupture force (N), SSC is soluble solids content (°Brix), k1, k2, and k3 are model constants.
Statistical Analysis
All statistical analyses were performed with the SPSS 20.0 software (IBM SPSS Statistics, IBM Corporation, USA). Data were subjected to the analysis of variance (ANOVA) to determine the statistical significance. Also, multiple comparisons between means were determined by the least significant difference test (p ˂ 0.05). The collected data were also subjected to regression analysis to describe the relationship between samples’ ultrasonic parameters and their mechanical and chemical properties. Coefficient of determination (R2), root mean square error (RMSE) and mean percentage error (MPE) were used to evaluate the regression models. The RMSE and MPE were calculated from the following equations:[Citation14]
where t is the predicted target value, a is the actual output value, n is the number of observations. It is evident that models with higher value of R2 and lower value of RMSE represent as better predictive models.
RESULTS AND DISCUSSION
summarizes the morphological properties of the persimmon fruits examined immediately after harvest and used for this research. The effect of ripening on the modulus of elasticity and rupture force of the persimmon cultivars is shown in and . As shown in this figure, the modulus of elasticity and rupture force for both cultivars decreased steadily with storage time. The average values of modulus of elasticity and rupture force decreased by 83.74 and 82.70% for Karaj, by 77.42 and 82.43% for Shomali, respectively, within 21-day storage period. This indicated that the intercellular adhesiveness and tissue rigidity due to enzymatic activities had diminished significantly over 21 days of storage, and thus the fruit structure became increasingly soft at the end of the storage period. In reality, the textural changes during fruit ripening are accompanied by loss of cell wall integrity due to the decline in chain length of the pectin polymers and the subsequent increase in water soluble pectin.[Citation23] According to the results of analysis, storage duration from just before storage (day 0) to day 15 had a high statistically significant effect (p < 0.01) on both modulus of elasticity and rupture force for both cultivars. Similar results were reported by Kim et al.[Citation10] who showed a decrease in apparent elastic modulus and rupture force for apples stored at 19–23°C for 25 days.
TABLE 1 Morphological properties of the tested persimmon samples
FIGURE 2 Changes of modulus of elasticity and rupture force in “Shomali;” A: and “Karaj;” B: persimmons during storage time. Error bars show one standard deviation from the mean.
High-quality persimmons have a rupture force of 14.7 to 24.5 N, fruits firmer than 24.5 N are too hard and do not have a jelly like texture, whereas fruit with a rupture force <14.7 N are too soft to tolerate the physical handling associated with marketing. Therefore, it is useful to determine fruit rupture force according to the needs of the persimmons industry.[Citation24] In addition, knowing the modulus of elasticity of plant materials is also important for monitoring the elastic or permanent deformation occurred on samples being compressed. Excessive and particularly permanent deformation influence on products quality, their marketing, and economic value.[Citation25] Therefore, the information on the rupture force and modulus of elasticity for a fruit are beneficial and good to be known.
The mean values of the modulus of elasticity and rupture force for non-astringent samples were higher than those for the astringent ones. One reason is that the non-astringent fruits have a higher proportion of intercellular spaces filled with liquid, forming firmer tissues than that in the astringent samples with air-filled spaces.[Citation21] Therefore, larger applied force is required to break down the cell wall of Shomali persimmon fruit than that of Karaj persimmon fruit during compression. For the same reason, the modulus of elasticity of fruit tissues was significantly different between two cultivars. It should be noted that the other reasons for these differences could be related to the mechanical strength of the skin, the viscosity of the juice, the strength of the bond among neighboring cells, and the turgor pressure in cells in the two cultivars.[Citation23] The effect of turgor pressure can be explained as follows: as water enters into the cell, the cell starts to swell, and a pressure is applied on the cell wall.[Citation26] High cell turgor pressure causes cell wall failure and weakens the gross tissue mechanical properties. Highly turgid fruits are more bruise-susceptible than those with lower turgor and at high turgor pressure, the amount of additional stress required to induce wall fracture is reduced.[Citation27] Therefore, the difference in the volume of water entering the cell can effect the contact area between turgid cells. However, ANOVA results showed that the cultivar type had no significant effect (p > 0.05) on the rupture force and modulus of elasticity.
The results of the ultrasonic experiments conducted on persimmon cultivars are presented in and . According to the results, the velocity of the ultrasonic waves for Karaj persimmons decreased consistently with storage time; the average value of this parameter changed from 245 to 163 m/s over 21 days of storage. Similar changes (except for day 9) were also observed on the ultrasonic velocity for Shomali persimmons, as this parameter decreased significantly from 258 to 161 m/s with the increase in storage time. The effect of storage time on ultrasonic velocity for both cultivars was found to be highly significant (p < 0.01). The explanation for this behavior may be related to the fact that the volume fraction of intercellular spaces of the fruit flesh tended to decrease as the storage time increased.[Citation28] This can be because the ultrasonic velocity is very sensitive to molecular organization and intermolecular interactions.[Citation15] In other words, air content in plant tissues has been found to be an important factor influencing ultrasonic velocity. It has an indirect effect on velocity through affecting elastic modulus, in which greater air content could reduce the ratio of cell area to cell contact, resulting in decreased elastic modulus and velocity.[Citation28] The ultrasonic velocity of biological materials seems to be dependent on their physical and chemical properties such as elastic modulus, density, and composition. It is necessary to mention here that, the increase in ultrasonic velocity on the 9th day of storage for Shomali cultivar can be due to the changes in the water content[Citation29] and intercellular air space volume of the tissue during ripening.[Citation28] However, further study, such as microstructural evaluation with the help of scanning electron microscopy, is required to have a better understanding of this behavior. No significant difference for ultrasonic velocity was observed among Karaj and Shomali cultivars of persimmon. Our results, with regard to ultrasonic velocity, are in agreement with those from Kim et al.[Citation10] who reported a reduction in ultrasonic velocity for apple stored at 19–23°C for 25 days.
FIGURE 3 Changes of ultrasonic velocity and attenuation in “Shomali;” A: and “Karaj;” B: persimmons during storage time. Error bars show one standard deviation from the mean.
Changes in the attenuation coefficient for Shomali and Karaj cultivars are shown in and , respectively. Results showed that the values of attenuation were different among the cultivars. The attenuation coefficients for Karaj cultivar increased from 1.03 to 1.77 dB/mm. For Shomali cultivar this parameter increased from 1.19 to 1.91 dB/mm, during the postharvest ripening until the fruit became over-ripe and very soft. This trend demonstrated that the transmitted ultrasonic signals were generally attenuated for longer storage time. The reason for this increase can be explained as follows: As an ultrasonic wave propagates through a material, the amplitude of the wave changes because of absorption and scattering phenomena. Absorption is caused by molecular processes that convert ultrasound energy into heat, while sound scattering occurs in a part of the wave that changes its initial direction and propagates separately from the original incident wave, distorting and interfering with the initial wave.[Citation20] The various physiological and physiochemical changes that have happened during storage have great effect on attenuation.[Citation15] Therefore, as the persimmons are stored for a longer time, the structural changes in fruit were accompanied by the increase in absorption and scattering of ultrasonic waves, resulting in the reduction of wave power. Similar to these findings, increases in attenuation coefficients during storage have been previously reported by Flitsanov et al.[Citation30] for avocado fruit.
The changes in the attenuation characteristics were found to be strongly correlated with ripening stages, i.e., storage time (p < 0.01) for both studied cultivars. Also, the effect of cultivar on the attenuation was significant (p < 0.05). The attenuation characteristic for Shomali cultivar was significantly higher than that of Karaj, and this difference is possibly due to the variation in histological, anatomical, and biochemical specifications of the cells in these two cultivars.
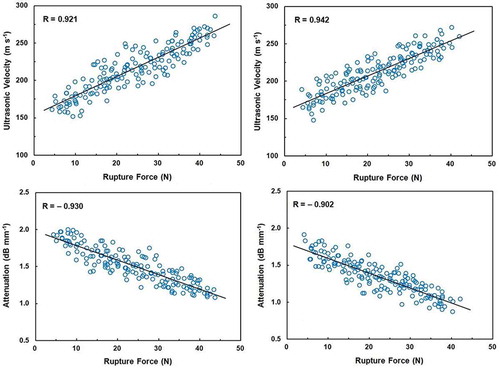
The relationships of ultrasonic velocity and attenuation with modulus of elasticity are shown in . The correlation coefficients (R) between modulus of elasticity and ultrasonic velocity were found to be 0.896 and 0.883 for Shomali and Karaj cultivars, respectively. However, negative correlation was observed between modulus of elasticity and attenuation for Shomali (R = –0.916) and Karaj (R = –0.925) cultivars. The relationships of ultrasonic velocity and attenuation with rupture force are shown in . This figure shows that the correlation coefficients between rupture force and both ultrasonic velocity and attenuation were relatively higher than those of the modulus of elasticity for Shomali cultivar; i.e., rupture force were correlated with ultrasonic velocity and attenuation with coefficients of 0.921 and –0.930, respectively. For Karaj cultivar, these correlation coefficients were found to be 0.942 and –0.902, respectively.
FIGURE 4 Correlations between ultrasonic velocity and modulus of elasticity for Shomali (top left) and Karaj (top right) cultivars and between attenuation and modulus of elasticity for Shomali (bottom left) and Karaj (bottom right) cultivars. The solid line is the regression line.
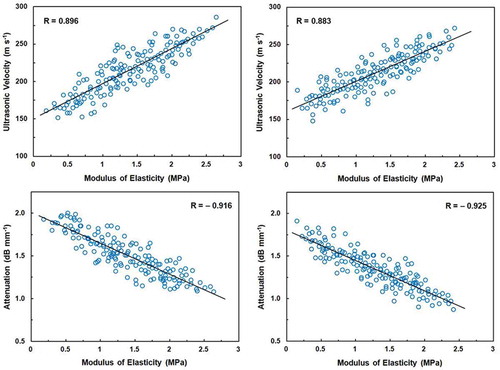
FIGURE 5 Correlations between ultrasonic velocity and rupture force for Shomali (top left) and Karaj (top right) cultivars and between attenuation and rupture force for Shomali (bottom left) and Karaj (bottom right) cultivars. The solid line is the regression line.
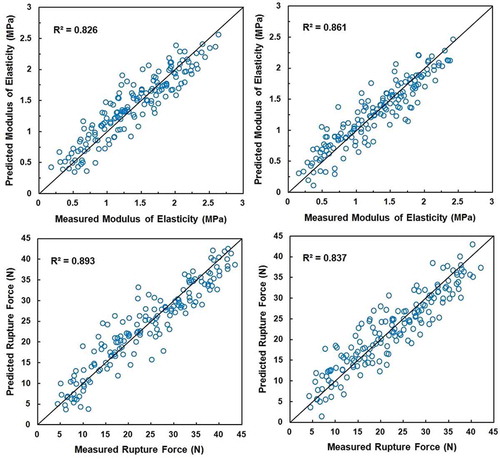
Four mathematical models between ultrasonic and mechanical parameters are shown in . These four equations were found acceptable for predicting rupture force and modulus of elasticity from ultrasonic waves for both cultivars as their coefficients of determination (R2) were higher than 0.8. In , the predicted mechanical properties (rupture force and modulus of elasticity) of the persimmon fruits are plotted against their actual values. The measured modulus of elasticities for Shomali cultivar were generally less than the predicted values with an average difference of 0.033 MPa (see , top left) while the measured rupture force data for Shomali cultivar in 48.13% of the cases were less than the predicted values with an average difference of 1.160 N. The measured rupture force data for Karaj cultivar were generally higher than the predicted values with an average difference of 0.804 N (see , bottom right) while the model predicted modulus of elasticity for Karaj cultivar in 47.50% of the cases less than the experimental values with an average difference of 0.018 MPa. shows good mathematical models with R2 values of 0.893 and 0.826 for predicting rupture force and modulus of elasticity, correspondingly, in Shomali cultivar, and R2 of 0.837 and 0.861 for predicting these mechanical parameters, respectively, in Karaj cultivar.
TABLE 2 Regression equations for predicting the mechanical and chemical properties of persimmon fruits from ultrasonic velocity and attenuation
FIGURE 6 Scatter plots of measured versus predicted values of mechanical properties obtained by linear model: modulus of elasticity of Shomali (top left) and Karaj (top right) cultivars; rupture force of Shomali (bottom left) and Karaj (bottom right) cultivars. The diagonal black line represents the perfect prediction line.
presents the mean and standard deviation values of SSC of persimmon fruits during ripening. SSC increased continuously over storage time (p < 0.01) from 15.77 to 21.63 for Karaj cultivar and from 16.32 to 21.81 (°Brix) for Shomali cultivar. This finding is similar to those reported by Wei et al.[Citation24] and Mohammadi et al.[Citation31] It was also found that the cultivar type had no significant effect on SSC (p > 0.05). The results confirm the fact that during fruit development there are changes in the concentration of soluble solids in fruit’s flesh.[Citation31] Samples can be grouped into three classes of ripening stage as “unripe,” “ripe,” and “overripe.” These classes can be distinctively defined according to the trend by which the samples’ SSC change (See ). For Karaj cultivar, these classes correspond to 0–6, 6–12, and more than 12 days after storage begins, respectively. For Shomali cultivar, however, these classes correspond to 0–9, 9–15, and more than 15 days after storage, respectively. The results of statistical analysis showed that for both persimmon cultivars SSC had a significant effect (p < 0.01) on the ultrasonic velocity. The reason behind this finding can be understood from the fact that SSC has a direct effect on fruit juice viscosity and thus, on the ultrasonic velocity.[Citation32] Nevertheless, no meaningful correlation was detected between attenuation coefficient and SSC. The best equations for predicting fruit’s SSC from its ultrasonic velocity for each cultivar are given in . As it can be seen in this table, there is a quadratic relationship with very high correlation value between SSC and independent variable (ultrasonic velocity) for both persimmon cultivars. Overall, these results appear to explain why ultrasonic can be useful as non-destructive method in predicting chemical and mechanical properties of the fruit. Nonetheless, there are still many opportunities for further research.
FIGURE 7 Changes in soluble solids content in persimmons during storage time. Error bars show one standard deviation from the mean.
CONCLUSION
In this research, we studied the capability of ultrasonic technique for predicting persimmon’s rupture force, modulus of elasticity, and SSC as a function of attenuation coefficient and velocity of ultrasonic waves passing through the whole fruit. It was found that for two persimmon types studied in this research, modulus of elasticity and rupture force decreased as they stored longer. In contrast, for both cultivars SSC increased in a quadratic manner with storage time. The modulus of elasticity and rupture force values of Shomali cultivar (non-astringent) were higher than those obtained for Karaj persimmon cultivar (astringent). In addition, for both cultivars, ultrasonic velocity decreased, whereas the attenuation coefficient increased with the increase in storage time. The attenuation for Shomali cultivar had higher values than for Karaj cultivar but in the case of ultrasonic velocity, at some storage times this factor had higher values for Shomali cultivar than for Karaj cultivar. Finally, mechanical properties were modeled for both cultivars from the values of the ultrasonic velocity and the measured attenuation coefficient and the coefficients of determination for the models were found to be higher than 0.825. Chemical properties, i.e., SSC data, were also accurately fitted in a quadratic function of ultrasonic velocity. These models allow non-destructive measurement of mechanical and chemical properties of persimmons. To the best of our knowledge, this is the first attempt to characterize chemical and mechanical properties of persimmon with the ultrasonic technique. Further works are needed to be conducted on this method at other frequencies to develop a more reliable prediction of chemical and texture properties of persimmon fruits during postharvest storage.
REFERENCES
- Karaman, S.; Toker, O.S.; Çam, M.; Hayta, M.; Doǧan, M.; Kayacier, A. Bioactive and Physicochemical Properties of Persimmon As Affected by Drying Methods. Drying Technology 2014, 32, 258–267.
- Khademi, O.; Zamani, Z.; Poor Ahmadi, E.; Kalantari, S. Effect of UV-C Radiation on Postharvest Physiology of Persimmon Fruit (Diospyros Kaki Thunb.) cv, “Karaj” During Storage at Cold Temperature. International Food Research Journal 2013, 20, 247–253.
- Taniwaki, M.; Hanada, T.; Sakurai, N. Postharvest Quality Evaluation of “Fuyu” and “Taishuu” Persimmons Using a Nondestructive Vibration Method and An Acoustic Vibration Technique. Postharvest Biology and Technology 2009, 51, 80–85.
- Beghi, R.; Giovanelli, G.; Malegori, C.; Giovenzana, V.; Guidetti, R. Testing of a VIS-NIR System for the Monitoring of Long-Term Apple Storage. Food and Bioprocess Technology 2014, 7, 2134–2143.
- Kitthawee, U.; Pathaveerat, S.; Srirungruang, T.; Slaughter, D. Mechanical Bruising of Young Coconut. Biosystems Engineering 2011, 109, 211–219.
- Sirisomboon, P.; Tanaka, M.; Kojima, T. Evaluation of Tomato Textural Mechanical Properties. Journal of Food Engineering 2012, 111, 618–624.
- Khodabakhshian, R.; Emadi, B. Development of a Finite Element Method Model to Determine Mechanical Behavior of Pumpkin Seed. International Journal of Food Properties 2015, 18, 231–240.
- Hu, W.; Jiang, A.; Tian, M.; Liu, C.; Wang, Y. Effect of Ethanol Treatment on Physiological and Quality Attributes of Fresh-Cut Eggplant. Journal of the Science of Food and Agriculture 2010, 90, 1323–1326.
- Chen, L.; Opara, U.L. Texture Measurement Approaches in Fresh and Processed Foods—A Review. Food Research International 2013, 51, 823–835.
- Kim, K.B.; Lee, S.; Kim, M.S.; Cho, B.K. Determination of Apple Firmness by Nondestructive Ultrasonic Measurement. Postharvest Biology and Technology 2009, 55, 44–48.
- Gaete-Garretón, L.; Vargas-Hernndez, Y.; León-Vidal, C.; Pettorino-Besnier, A. A Novel Noninvasive Ultrasonic Method to Assess Avocado Ripening. Journal of Food Science 2005, 70, 187–191.
- Soltani, M.; Alimardani, R.; Omid, M. Evaluation Banana Ripening Status from Measuring Dielectric Properties. Journal of Food Engineering 2011, 105, 625–631.
- Singh, A.P.; McClements, D.J.; Marangoni, A.G. Solid Fat Content Determination by Ultrasonic Velocimetry. Food Research International 2004, 37, 545–555.
- Telis-Romero, J.; Váquiro, H.A.; Bon, J.; Benedito, J. Ultrasonic Assessment of Fresh Cheese Composition. Journal of Food Engineering 2011, 103, 137–146.
- Awad, T.S.; Moharram, H.A.; Shaltout, O.E.; Asker, D.; Youssef, M.M. Applications of Ultrasound in Analysis, Processing and Quality Control of Food: A Review. Food Research International 2012, 48, 410–427.
- Kim, K.B.; Jung, H.M.; Kim, M.S.; Kim, G.S. Evaluation of Fruit Firmness by Ultrasonic Measurement. Key Engineering Materials 2004, 270–273, 1049–1054.
- Mizrach, A. Nondestructive Ultrasonic Monitoring of Tomato Quality During Shelf-Life Storage. Postharvest Biology and Technology 2007, 46, 271–274.
- Kim, K.B.; Kim, M.S.; Lee, S.D.; Choi, M.Y. Consideration of Design Parameters of Ultrasonic Transducer for Fruit. In International Conference on Review of Progress in Quantitative Nondestructive Evaluation, Golden, CO, July 25–30, 2004, 1047–1053.
- Morrison, D.S.; Abeyratne, U.R. Ultrasonic Technique for Non-Destructive Quality Evaluation of Oranges. Journal of Food Engineering 2014, 141, 107–112.
- Cho, B.K. Ultrasonic Technology. In Nondestructive Evaluation of Food Quality: Theory and Practice; Jha, S.N.; Ed.; Springer-Verlag: Berlin, Germany, 2010; 219–230.
- Vázquez-Gutiérrez, J.L.; Hernández-Carrión, M.; Quiles, A.; Hernando, I.; Pérez-Munuera, I. Impact of High Hydrostatic Pressures on the Structure, Diffusion of Soluble Compounds and Textural Properties of Persimmon “RojoBrillante.” Food Research International 2012, 47, 218–222.
- Esehaghbeygi, A.; Raghami, N.; Kargar, A. Detection of Internal Defects in Potato Based on Ultrasonic Attenuation. American Journal of Potato Research 2011, 88, 160–166.
- Ekrami-Rad, N.; Khazaei, J.; Khoshtaghaza, M.H. Selected Mechanical Properties of Pomegranate Peel and Fruit. International Journal of Food Properties 2011, 14, 570–582.
- Wei, X.; Liu, F.; Qiu, Z.; Shao, Y.; He, Y. Ripeness Classification of Astringent Persimmon Using Hyperspectral Imaging Technique. Food and Bioprocess Technology 2014, 7, 1371–1380.
- Shirvani, M.; Ghanbarian, D.; Ghasemi-Varnamkhasti, M. Measurement and Evaluation of the Apparent Modulus of Elasticity of Apple Based on Hooke’s, Hertz’s, and Boussinesq’s Theories. Measurement 2014, 54, 133–139.
- Singh, F.; Katiyar, V.K.; Singh, B.P. Analytical Study of Turgor Pressure in Apple and Potato Tissues. Postharvest Biology and Technology 2014, 89, 44–48.
- Grotte, M.; Duprat, F.; Loonis, D.; Piétri, E. Mechanical Properties of the Skin and the Flesh of Apples. International Journal of Food Properties 2001, 4, 146–161.
- Stevenson, D.G. Role of starch structure in texture of winter squash (Cucurbita maxima D.) fruit and starch functional properties. PhD Thesis, Iowa State University, Ames, IA, 2003.
- Self, G.K.; Ordozgoiti, E.; Povey, M.J.W.; Wainwright, H. Ultrasonic Evaluation of Ripening Avocado Flesh. Postharvest Biology and Technology 1994, 4, 111–116.
- Flitsanov, U.; Mizrach, A.; Liberzon, A.; Akerman, M.; Zauberman, G. Measurement of Avocado Softening at Various Temperatures Using Ultrasound. Postharvest Biology and Technology 2000, 20, 279–286.
- Mohammadi, V.; Kheiralipour, K.; Ghasemi-Varnamkhasti, M. Detecting Maturity of Persimmon Fruit Based on Image Processing Technique. Scientia Horticulturae 2015, 184, 123–128.
- Kuo, F.J.; Sheng, C.T.; Ting, C.H. Evaluation of Ultrasonic Propagation to Measure Sugar Content and Viscosity of Reconstituted Orange Juice. Journal of Food Engineering 2008, 86, 84–90.