
Abstract
The concentrations of Na, Mg, K, Ca, Cr, Fe, Ni, Cu, Zn, As, Se, and Pb in various tissues of Pangasius sp. were determined using microwave-assisted digestion/inductively coupled plasma–mass spectrometry. The clustering tendency related to elemental patterns associated with tissue variants and fish habitats were explored using hierarchical cluster analysis and principal component analysis. The results revealed that the general elemental accumulation pattern was strongly dependent on the type of tissue, whereas latent deviations within particular tissue samples can be linked to the natural variability between wild-caught and farmed fish. The inherent elemental patterns allowed us to differentiate between those wild-caught and farmed fish through linear discrimination analysis with 100% precision. In terms of food safety, the elemental concentrations in edible muscle were found to be far below the legal limits, as the associated health risks at the 90th percentile were well within tolerable regions, although wild-caught fish were found to pose a higher risk.
Keywords:
Introduction
Owing to the anthropogenic impact on the freshwater aquatic ecosystem, there has been growing awareness about the contaminant levels in fishery production.[Citation1,Citation2] In this regard, the main concern is always to address the associated potential human health risks due to bioaccumulation and biomagnification through the food chain.[Citation3] In other words, a fish that occupies the highest trophic level at the end of the aquatic food chain may be concentrated with a substantial amount of hazardous chemical species, which could be passed to human beings.[Citation1,Citation4–Citation6] This accumulation pattern not only depends on the bioavailability and chemical characteristics of the contaminants, but also other conditions such as feeding habits, age, size, duration of exposure, and homeostatic regulation activity.[Citation7,Citation8]
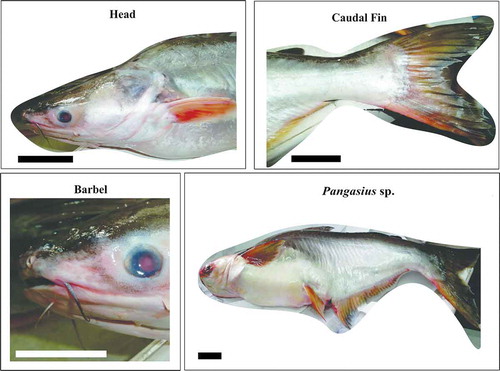
In developing countries, aquaculture is a fast-expanding industry, because of the importance of fish as a source of protein. In Malaysia, this industry shows a growing economy as well as nutritional and social importance. Among the food supply from freshwater aquaculture fisheries, Pangasius sp. () is one of the major market demands.[Citation9] On the other hand, the nature of being able to accumulate biologically available forms of pollutants, particularly heavy metals that are highly toxic and have long-term persistence, have raised potential food safety issues in fishery supplies.[Citation10] One of the concerns is regarding the variations in the accumulation patterns between wild-caught and farmed fish. Accumulation patterns in naturally grown and aquaculture produce may differ considerably, owing to many factors that are related to variations in environmental conditions.[Citation11,Citation12] It has been suggested that wild fish accumulate metal elements from their ambient habitat, whereas farmed fish mainly accumulate metals through their diet, that is, through commercial feeding pellets. The elemental content may subsequently be altered in cases of effluent feeders.[Citation13] Although farmed fish are generally perceived to be less susceptible to pollution, the overall consumer preference was in favor of wild-caught fish, as its safety is already presumed.[Citation14] As the chemical differences among them are not visible to the naked eye; unscrupulous producers try to gain economic advantage from mislabeling and misleading claims, which are detrimental to other producers and consumers. Referring to previously published scientific reports, only a limited number of studies have addressed such issues;[Citation15] moreover, no data have been published for Pangasius sp. Knowledge about elemental accumulation patterns not only help in communicating the health risks associated with their consumption, but could also be useful for differentiating between wild-caught and farmed fish.
FIGURE 1 Basic Pangasius sp. anatomy. Note: Scale = 5 cm.
One focus of this study is on the elemental accumulation patterns of Pangasius sp. gills and liver, which have been considered as target organs for assessing bioaccumulation; including muscles, which are of most concern to humans because it is the main tissue that is consumed as food. Elemental concentrations in the gills reflect the availability of the related elements in the ambient water, whereas concentrations in the liver indicate the accumulation as a consequence of substantial exposure.[Citation16] It is generally agreed that elemental uptake in fish is mainly through food, water, and sediment. The efficiency of the uptake may differ as a function of the ecological needs, metabolism, and concentration gradient of water, food, and sediments.[Citation17] This suggests that accumulation patterns in fish species associated with elemental exposure can also provide useful information that could be correlated to its habitats.[Citation18]
In the context of fishery food supply, elemental compositions are mainly investigated for food-safety purposes and are rarely explored from the perspective of chemometrics. In the present study, the concentration of Na, Mg, K, Ca, Cr, Fe, Ni, Cu, Zn, As, Se, and Pb were measured in the gills, liver, and muscle tissues of wild-caught and farmed Pangasius sp. By inductively coupled plasma–mass spectroscopy (ICP-MS). The ICP-MS data were evaluated with hierarchical cluster analysis (HCA) and principal component analysis (PCA). The main idea behind HCA and PCA is to reveal the underlying patterns in elemental compositions in order to express them in a reduced dimension, so as to highlight the similarities and differences. The feasibility of distinguishing the identities of unknown samples based solely on elemental composition was further demonstrated using linear discrimination analysis (LDA).
Materials and Methods
Sampling Sites
Briefly, the Selangor River originates at an attitude of 1500 m in a naturally vegetated area and flows in a south-westerly direction before discharging into the Straits of Malacca at Kuala Selangor. It is a source of raw water supply that serves and sustains the needs of agricultural activities nearby the river, for instance, the aquaculture fish farming located at Taman Agroteknologi Pertanian Bistari Jaya, Kuala Selangor. Inevitably, the river also exposed to industrial discharges and agriculture runoffs.[Citation19]
Sample Collection
The slaughtered Pangasius sp. (which were killed before the research process began) were donated by local fishermen and fish farmers in Kuala Selangor during June 2012. These samples were either wild-caught fish from the Selangor River (depth: ~3–3.5 m) or aquaculture produce based on pool practices from the earthen pond (depth: ~0.5–1 m) located at Taman Agroteknologi Pertanian Bistari Jaya.
Sample Preparation
The specimens were first wrapped into polyethylene plastic, and packed samples were cooled with blue ice packets in an insulated box immediately and then transported to the laboratory on the same day. The total fish length and weight were measured before being stored at –20°C until dissection was performed. Tissues of the muscle, gills, and liver were removed and cleaned several times with ultrapure water (UPW). These tissue samples were freeze-dried (CHRiST, Germany) and homogenized with a mortar and pestle. Dried samples were kept in amber jars in a desiccator before undergoing microwave digestion.
Reagents and Standard Material
UPW with resistivity of more than 18 MΩ cm was obtained from a PURELAB® UHQII system (ELGA®, UK). Solutions of 65% nitric acid and 30% hydrochloric acid were of Surprapur® quality (Merck, Germany). Fresh calibration standards were prepared by an appropriate dilution of the ICP multi-element standard stock (Agilent Technologies, USA) that consists of 1000 mg L–1 of Fe, Ca, K, Mg, Na and 10 mg L–1 of As, Cd, Cr, Cu, Ni, Pb, Se, and Zn in 5% HNO3. The purities of the argon plasma gas and helium collision gas were higher than 99.999%. DORM-3 and DOLT-4 (National Research Centre, Canada) certified reference materials (CRMs) for trace metals were used to validate the methods. All apparatus were soaked overnight in 10% nitric acid in order to avoid possible cross-contamination. In addition, they were thoroughly rinsed with UPW and dried prior to use.
Sample Analysis
Tissue samples were analyzed according to the method described by Low, Zain, and Abas,[Citation20] in which microwave-assisted digestion (MAD) was carried out in a CEM Mar Xpress Microwave-Accelerated Reaction System (USA). Approximately 0.25 g of dried sample was weighted directly into a 55 mL self-regulating control PFA® vessel and digested with a reagent consisting of 10 mL HNO3:HCI:H2O at the ratio of 5:1:14 (v/v). The microwave temperature was ramped to 185°C in 10.5 min and held there for 14.5 min under a microwave power of 800 W. A blank sample was prepared in the same way. After digestion, the sample was cooled before being transferred to a 50.0 mL polypropylene volumetric flask, and the volume was made up to the mark with UPW. Diluted sample solutions were refrigerated in polyethylene vials and were analyzed within 5 days by an Agilent Technology 7500 ce ICP-MS integrated with an octopole reaction system and an ASX-500 autosampler (Agilent Technologies, Japan). In order to remove possible interferences due to polyatomic ions, the acquisition mode was carried out under helium collision and kinetic energy discrimination.[Citation21,Citation22]
Data Analysis
Statistical analysis of the data was performed using the JMP version 9.0 software package. The whole ICP-MS data matrix is composed of 120 samples (20 samples of each tissue from each habitat) and 12 variables (concentrations of 12 elements). This matrix was systematically split into a training set (84 × 12) and a test set (36 × 12).
For unsupervised study, HCA and PCA were conducted on the training set to obtain an overview of the natural clustering and multivariate elemental distribution pattern in the studied samples. HCA converted the original ICP-MS data into one-dimensional dendrograms by developing sample clusterings through a Ward algorithm and Euclidean distance. In order to eliminate variance differences between variables, PCA was performed on the correlation matrix of the original variables. PCA linearly transformed the training set into a product of two matrices, one which contained information about the metal concentrations (loadings) and the other provided information of the samples (scores). Each PC value was associated with an eigenvalue, where PC1 had the largest eigenvalue and carried the most variance of the original data compared to other PCs, which then decreased in the order of variation. These manageable dendrograms and score-loading biplots improve the interpretability of the ICP-MS results.[Citation23,Citation24]
For supervised pattern recognition, LDA models were constructed using the training set, which were validated by the test set. LDA minimizes the variance within clusters while maximizing the variance between the predefined clusters.[Citation25] This procedure facilitates mathematical discrimination between the clusters by derived the linear functions.
Results and Discussion
An effort was taken to collect Pangasius sp. from two different habitats; their morphometric data and physico-chemical parameters of water are summarized in . The condition factor (CF) was calculated by the ratio of the weight to length, which is commonly used as a general index of fish health, whereas the hepatosomatic index (HSI) is defined as the ratio of liver weight to body weight, which reflects the status of fish energy reserves.[Citation26] Despite the fact that the samples that originated from the aquaculture pond were generally smaller in size compared to those from the Selangor River, there were no significant differences observed between their HSI and CF values. This provides a sensible comparison of the elemental compositions among the samples. In fact, there has rarely been any significant correlation reported between elemental accumulation patterns and fish size or sex.[Citation2]
TABLE 1 Biometric and water quality information related to farmed and wild-caught Pangasius sp.
The analytical performance of the MAD/ICP–MS method was checked using the CRMs of dogfish muscle (DORM-3) and liver (DOLT-4). As can be seen in , there is a good agreement between the measured and certified values for all cases (p > 0.05). presents the elemental concentrations found in various tissues of wild-caught and farmed Pangasius sp. Independent of the sample origins, the accumulation order for macro-elements was found to be K > Na > Mg > Ca, which is in good agreement with the sequence reported by Łuczyńska, Tońska, and Łuczyński;[Citation27] except for gills, which shows an order of Ca > K > Na > Mg. Gills are expected to contain higher concentrations of Ca,[Citation28] because Ca is a major component of the gill arches; moreover, gill epithelium has been demonstrated to be the main site of Ca uptake from fresh water in order to sustain the Ca requirement of the fish.[Citation29] On the other hand, there is no particular trend observed in the accumulation of trace elements. Yet, the overall concentrations are generally found to be higher in the liver compared to the gills and muscle tissues, regardless of the sample origin. In particular, concentrations of bioactive elements such as Fe, Cu, Zn, Se, and Pb are significantly higher (p < 0.001) in liver tissues in fish from both habitats. These elements tend to accumulate in high-metabolic-rate organs such as the liver rather than other tissues, due to their capacity to induce metal-binding proteins such as metallothioneins.[Citation30–Citation33]
TABLE 2 Analysis of certified reference materials
TABLE 3 Metal concentrations in freeze-dried Pangasius sp.
To ease the interpretation, HCA and PCA were conducted to explore elemental distribution patterns in the studied samples. From the PCA model, the first two PCs accounted for about 83% of the total variability of the associated elemental concentrations in all tissues. shows that three major distinct clusters were revealed by both the score-loading biplot and the dendrogram. The identities of these clusters are perfectly matched with the types of sample tissues, regardless of the habitat of the fish. For instance, cluster I is made up of the PC scores associated with elemental variations in the liver tissues. Cluster II composes of the scores of gills, whereas the scores of muscle tissues are grouped in cluster III. It is clearly demonstrated that variations in elemental content caused by the variance in the different tissues are greater than those caused by the habitat. In other words, variation in the elemental accumulation pattern is strongly dependent on the type of tissue being investigated.[Citation18,Citation20] Based on the findings, the elemental accumulation patterns should be able to infer the identities of unknown Pangasius sp. tissues. To test this hypothesis, an LDA model was calibrated using the training set and validated by the remaining test set. The results showed 100% “correct” classification ().
TABLE 4 Detailed discrimination results from LDA model
FIGURE 2 PC2 versus PC1 score-loading biplot and dendrogram for training set (84 × 12). The letters W and A donate to wild-caught and farmed Pangasius sp.
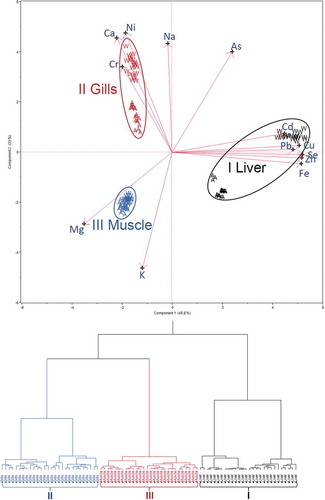
From the PC1 axis in , it can be seen that scores of the liver samples (cluster I) were dispersed in the region with high positive loadings of Cu, Pb, Se, Zn, Fe, and As. This can be interpreted to indicate that the liver tissues normally contain higher amounts of such elements, making them stand out more from those on the right-hand side of the score plot. Analyzed together, the results from and suggest that the total elemental accumulation is in the order liver > gills > muscle. This trend is consistent with previously published reports.[Citation20] Higher accumulation ratios are found in the fish liver tissues, which are associated with the tendency of chemical interactions between elements and oxygen carboxylates, amino groups, nitrogen, and/or sulfur of the mercapto group in metallothionein proteins.[Citation34]
Gill samples in cluster II are distinguished from the others, as they have negative scores on PC1 and high positive scores on PC2 (). Referring to the biplot, all gill samples are located in the upper-left quadrant, which is associated with significant positive loadings of Na, Ni, Ca, and Cr. As the elemental concentrations in the gills are directly dependent on the ambient conditions, they are noteworthy candidates for tracing the habitat of Pangasius sp. In fact, it can be observed that cluster II mainly consisted of two subclusters, which can easily be distinguished by the magnitude of the scores on PC2 that explained approximately 36% of the total variance. Subcluster II-W, with higher PC2 scores, was donated from the gill samples from wild-caught Pangasius sp., which commonly contain greater concentrations of Na, Ni, Ca, and Cr, whereas subcluster II-A corresponded to farmed fish, which generally have lower scores. Elemental exposure is a potential reason for these variations. Based on previous studies conducted in the Selangor River, such elemental inputs could be attributed to industrial effluents and agricultural runoffs in that area.[Citation19]
In the same way, cluster I, which consisted of liver samples, can also be divided into subcluster I-W (wild-caught) and subcluster I-A (farmed), which were partitioned by the axis of PC1 (). Likewise, liver samples with positive scores on PC2 belonged to wild-caught Pangasius sp. from the Selangor River, which could be associated with a higher content of Na, Ni, Ca, and Cr, whereas those corresponding to negative scores are aquaculture produce associated with Mg and K. It is suspected that variations in the accumulation of Mg and K in the livers of cultivated samples were probably caused by aquaculture practices, such as the utilization of metal-enriched fish feeds, metal-based antifoulants, and so forth.[Citation35] Considering the results from and , it can be said that the wild Pangasius sp. generally accumulated higher concentrations of metals compared to the farmed fish, as subjected to elemental bioavailability. Variations are very clear when referring to liver tissues (p < 0.001), which are capable of storing high amounts of the elements.
To visualize the accumulation patterns claimed above, further HCA and PCA were performed on each type of tissue, exclusively (). For the sub-training set comprising entirely liver samples, the dendrogram and biplot are shown in . It clearly demonstrates two discrete clusters, which are partitioned by the PC2 axis in the biplot. The livers of wild-caught fish have positive scores on PC1 (which explained ca. 70% of the total variance) and have high positive loadings of Na, Mg, K, Ca, Cr, Fe, Ni, Cu, Zn, As, Se, and Pb, and vice versa. A similar pattern was observed in the subset consisting only of gills, as also indicates two separable clusters. Again, these results emphasized that wild Pangasius sp. from the Selangor River accumulate higher concentrations of elements than those from the nearby freshwater aquaculture pond. This is in complete agreement with the findings of Kalantzi, Black[Citation15] in a study that was conducted on marine fish in the Mediterranean. Such findings provided a solid basis for quantitative discrimination between wild-caught and farmed fish through the elemental compositions of the tissues, as 100% discrimination and predictive rates were achieved when using the LDA algorithm.
FIGURE 3 Biplots and dendrograms using subset comprising entirely: A: liver; B: gills; C: muscle samples. The letters W and A donate to wild-caught and farmed Pangasius sp.
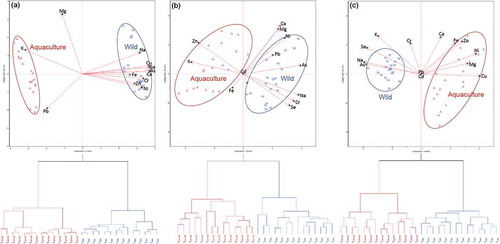
The biplot in also indicates that the muscle samples (cluster III) are isolated from other tissues, with high and negative scores on both PCs. This quadrant is primarily loaded with Mg and K; thus, it is suggested that muscle tissues exhibit lower metal concentrations than other tissues, except for Mg and K elements. This is consistent with the accumulation trends shown in . Mg and K are macro-elements that are needed for survival (as they play vital roles as enzyme co-factors and are important structural components of cell membranes and extracellular fluids), where the dietary requirement of the fish is 1–3 g kg–1 and 500 mg kg–1 for K and Mg, respectively. According to the National Research Council, fish are capable of extracting Mg from the environment; about 40% of the body’s Mg is distributed throughout the organs and muscle tissues.[Citation36]
In addition, the scores of muscle tissues do not disperse in the same way as those for the liver or gills samples (), as no linearly separable cluster was observed between the wild-caught fish and those that were farmed. One reason for this could be that the muscle tissues have a weak accumulating potential, so the variation caused by the difference in habitat is masked by the variance described by the tissue types.[Citation37,Citation38] Another reason could be that PC1 and PC2 in were inadequate factors to fully resolve the elemental variations associated with the muscle tissues of wild-caught and farmed fish. To resolve this issue, another set of HCA, PCA, and LDA models was constructed, solely for the muscle samples. The dendrogram and biplot (explaining 69% of the total variance) in disclose the evident variations between muscle samples from both habitats, as the LDA accomplished 100% precision. In this case, PC1 (associated with significant positive loadings of Mg, Fe, Ni, Cu, and Zn as well as considerable negative loadings of Na, K, As, and Se) is responsible for the discrimination between the habitats, whereas PC2 describes the variability within the habitat. Based on these additional results, the muscle tissues from wild-caught fish show a tendency to exhibit higher concentrations of As, Na, K, and Se, whereas aquaculture fish generally show higher concentrations in Mg, Fe, Ni, Cu, and Zn.
Another noteworthy finding under the experimental conditions of this work was that the LDA model constructed using the training set (84 × 12) allowed differentiation between the wild-caught and farmed Pangasius sp with 100% precision, without knowing the identities of the tissue types. This implied that there could be some common elemental patterns shared among each cluster of wild-caught fish or farmed fish, regardless of the type of tissue being investigated.
Owing to the function of muscle tissues as part of the human diet, the tendency to accumulate measurable amounts of toxic elements such as As in wild-caught Pangasius sp. brings about public awareness. According to the Malaysian Food Act 1983 and Food Regulations 1985, the permissible level is defined on the basis of wet weight.[Citation39] To ease the comparison purposes, the metal concentrations in the edible muscle, which had been corrected for wet weight, are summarized in . It clearly indicates that the total arsenic concentrations for the wild-caught and farmed fish were 0.03 ± 0.01 and 0.07 ± 0.01 mg kg–1, respectively, which are far below the legal limit. Similarly, other concentration values are also lower than the prescribed allowance. Basically, these concentrations are in the same range as most of the previously reported values for cultured Pangasius sp.[Citation40–Citation42] The deviations that were noted could be associated with variations in aquaculture practices and geographical origins, which make traceability feasible.
TABLE 5 Comparison of metal concentrations in Pangasius sp. on weight wet basis
To quantify the health risks associated with the consumption of the Pangasius sp. for local residents, both the levels of exposure and doses that lead to adverse effects need to be considered. As macro-elements such as Na, Mg, K, and Ca do not normally approach a level of toxicological concern, the hazard quotient (HQ) associated with lifelong exposure of a trace element is estimated by:[Citation43]
where C is the targeted elemental concentration in edible muscles (), FIR is the mean daily fish ingestion rate (0.018 kg day–1),[Citation44] BW is the average body weight (62.56 kg),[Citation45] and RfD is the targeted oral reference dose.[Citation46] summarizes the chronic health risks estimated for the consumption of wild-caught and farmed Pangasius sp. It can be noted that the all of the estimated HQ values are lower than 0.2, even for the total HQ based on the 90th percentile of individual elemental concentrations. This implies that the consumption of both wild-caught and farmed Pangasius sp. Is unlikely to cause chronic health effects for local residents over a lifetime; although, the risk associated with the consumption of wild-caught fish was found to be approximately twice that of the farmed fish. Other noteworthy observations showed that Se always contributes more than 50% of the total HQ when considering the mean concentrations, whereas considering the 90th percentile of the concentrations shows that both Se and As together expressed more than 50% of the total HQ. These observations reveal that the inorganic As could be another potential hazard that requires monitoring (besides the Se), owing to its extremely low RfD (3 × 10⁻⁴ mg kg–1 day–1), which corresponds to there being no observed adverse-effect level and the certain degree of uncertainty.[Citation46]
TABLE 6 The HQ values associated with consumption of Pangasius sp.
Conclusion
HCA and PCA improve the interpretability of multivariate data by providing pictorial evidence, whereas LDA supports the inferences from previous exploratory analysis. Based on the biplot, the elemental accumulation pattern in Pangasius sp. is strongly associated with the type of tissue. For a particular tissue, its elemental distribution pattern provides a solid basis for distinguishing between wild-caught and farmed fish under the present experimental conditions. This facilitates fish authentication using elemental composition information from whichever tissue. In the aspect of food safety, trace-metal concentrations found in edible muscles were far below the legal limits. Results from a preliminary health-risk assessment showed that As and Se were the major risk contributors. Consumption of Pangasius sp. is well within tolerable regions, although the wild-caught fish were found to pose a higher risk.
FUNDING
The authors gratefully acknowledge the financial assistance for this work from the Ministry of Science, Technology and Innovation, Malaysia (ER010-2011A).
Additional information
Funding
References
- Mansour, S.A.; Sidky, M.M. Ecotoxicological Studies. 3. Heavy Metals Contaminating Water and Fish from Fayoum Governorate, Egypt. Food Chemistry 2002, 78(1), 15–22.
- Fabris, G.; Turoczy, N.J.; Stagnitti, F. Trace Metal Concentrations in Edible Tissue of Snapper, Flathead, Lobster, and Abalone from Coastal Waters of Victoria, Australia. Ecotoxicology and Environmental Safety 2006, 63(2), 286–292.
- Eisler, R. Zinc Hazards to Fish, Wildlife, and Invertebrates: A Synoptic Review. In Contaminant Hazard Reviews; U.S. Fish and Wildlife Service: Laurel, MD, 1993; 106 pp.
- APHA. Standard Methods for the Examination of Water and Wastewater; American Public Health Association: Washington, DC, 1981.
- Pourang, N. Heavy Metal Bioaccumulation in Different Tissues of Two Fish Species with Regards to Their Feeding Habits and Trophic Levels. Environmental Monitoring and Assessment 1995, 35(3), 207–219.
- Adeyeye, E.I.; Akinyugha, N.J.; Fesobi, M.E.; Tenabe, V.O. Determination of Some Metals in Clarias Gariepinus (Cuvier and Valenciennes), Cyprinus-Carpio (L), and Oreochromis-Niloticus (L) Fishes in a Polyculture Fresh Water Pond and Their Environments. Aquaculture 1996, 147(3/4), 205–214.
- Mondon, J.A.; Duda, S.; Nowak, B.F. Histological, Growth, and 7-Ethoxyresorufin O-Deethylase (EROD) Activity Responses of Greenback Flounder Rhombosolea Tapirina to Contaminated Marine Sediment and Diet. Aquatic Toxicology 2001, 54(3–4), 231–247.
- van der Oost, R.; Beyer, J.; Vermeulen, N.P.E. Fish Bioaccumulation and Biomarkers in Environmental Risk Assessment: A Review. Environmental Toxicology and Pharmacology 2003, 13(2), 57–149.
- Roberts, T.R.; Vidthayanon, C. Systematic Revision of the Asian Catfish Family Pangasiidae, with Biological Observations and Descriptions of Three New Species. Proceedings of the Academy of Natural Sciences of Philadelphia 1991, 143, 97–143.
- Smaoui-Damak, W.; Hamza-Chaffai, A.; Berthet, B.; Amiard, J.C. Preliminary Study of the Clam Ruditapes decussatus Exposed in Situ to Metal Contamination and Originating from the Gulf of Gabès, Tunisia. Bulletin of Environmental Contamination and Toxicology 2003, 71(5), 961–970.
- Yi, Y.-J.; Zhang, S.-H. Heavy Metal (Cd, Cr, Cu, Hg, Pb, Zn) Concentrations in Seven Fish Species in Relation to Fish Size and Location Along the Yangtze River. Environmental Science and Pollution Research 2012, 19(9), 3989–3996.
- Li, L.; Boyd, C.E.; Dong, S. Chemical Profiling with Modeling Differentiates Ictalurid Catfish Produced in Fertilized and Feeding Ponds. Food Control 2015, 50, 18–22.
- Grigorakis, K.; Rigos, G. Aquaculture Effects on Environmental and Public Welfare—The Case of Mediterranean Mariculture. Chemosphere 2011, 85(6), 899–919.
- Claret, A.; Guerrero, L.; Ginés, R.; Grau, A.; Hernández, M.D.; Aguirre, E.; Peleteiro, J.B.; Fernández-Pato, C.; Rodríguez-Rodríguez, C. Consumer Beliefs Regarding Farmed Versus Wild Fish. Appetite 2014, 79, 25–31.
- Kalantzi, I.; Black, K.D.; Pergantis, S.A.; Shimmield, T.M.; Papageorgiou, N.; Sevastou, K.; Karakassis, I. Metals and Other Elements in Tissues of Wild Fish from Fish Farms and Comparison with Farmed Species in Sites with Oxic and Anoxic Sediments. Food Chemistry 2013, 141(2), 680–694.
- Yilmaz, A.B. Levels of ls (Fe, Cu, Ni, Cr, Pb, and Zn) in Tissue of Mugil Cephalus and Trachurus MeditHeavy Metaerraneus from Iskenderun Bay, Turkey. Environmental Research 2003, 92(3), 277–281.
- Canli, M.; Furness, R.W. Mercury and Cadmium Uptake from Seawater and from Food by the Norway Lobster Nephrops Norvegicus. Environmental Toxicology and Chemistry 1995, 14(5), 819–828.
- Sogut, O.; Percin, F.; Konyalioglu, S. Chemometric Classification of Some Elements in Wild and Farmed Bluefin Tuna (Thunnus Thynnus L1758). The Journal of the Faculty of Veterinary Medicine, University of Kafkas 2011, 17(Suppl A), S7–S12.
- Leong, K.H.; Benjamin Tan, L.L.; Mustafa, A.M. Contamination Levels of Selected Organochlorine and Organophosphate Pesticides in the Selangor River, Malaysia Between 2002 and 2003. Chemosphere 2007, 66(6), 1153–1159.
- Low, K.H.; Zain, S.M.; Abas, M.R. Evaluation of Microwave-Assisted Digestion Condition for the Determination of Metals in Fish Samples by Inductively Coupled Plasma Mass Spectrometry Using Experimental Designs. International Journal of Environmental Analytical Chemistry 2011, 92(10), 1161–1175.
- Tanner, S.D.; Baranov, V.I.; Bandura, D.R. Reaction Cells and Collision Cells for ICP-MS: A Tutorial Review. Spectrochimica Acta Part B: Atomic Spectroscopy 2002, 57(9), 1361–1452.
- Low, K.H.; Zain, S.M.; Abas, M.R. Evaluation of Metal Concentrations in Red Tilapia (Oreochromis spp) from Three Sampling Sites in Jelebu, Malaysia Using Principal Component Analysis. Food Analytical Methods 2011, 4(3), 276–285.
- Low, K.H.; Zain, S.M.; Abas, M.R.; Atta Khan, R. Characterization of Commercial Chili Sauce Varieties According to Their Chemical and Physical Properties Using Chemometric Methods. Sensing and Instrumentation for Food Quality and Safety 2009, 3(4), 203–210.
- Low, K.H.; Zain, S.; Abas, M.R.; Ali Mohd, M. Classification of Chilli Sauces: Multivariate Pattern Recognition Using Selected GCMS Retention Time Peaks of Chilli Sauce Samples. Malaysian Journal of Analytical Sciences 2008, 12(1), 210–216.
- Liu, X.; Xue, C.; Wang, Y.; Li, Z.; Xue, Y.; Xu, J. The Classification of Sea Cucumber (Apostichopus Japonicus) According to Region of Origin Using Multi-Element Analysis and Pattern Recognition Techniques. Food Control 2012, 23(2), 522–527.
- Dethloff, M.G.; Schmitt, C.J. Condition Factor and Organo-Somatic Indices. In Biomonitoring of Environmental Status and Trends (BEST) Program: Selected Methods for Monitoring Chemical Contaminants and Their Effects in Aquatic Ecosystems; Dethloff, M.G.; Schmitt, C.J.; Eds.; U.S. Geological Survey, Biological Resources Division: Columbia, MO, 2000; 13–18.
- Łuczyńska, J.; Tońska, E.; Łuczyński, M. Essential Mineral Components in the Muscles of Six Freshwater Fish from the Mazurian Great Lakes (Northeastern Poland). Archives of Polish Fisheries 2009, 17, 171–178.
- Uysal, K. Heavy Metal in Edible Portions (Muscle and Skin) and Other Organs (Gill, Liver, and Intestine) of Selected Freshwater Fish Species. International Journal of Food Properties 2011, 14(2), 280–286.
- Pinto, P.I.S.; Matsumura, H.; Thorne, M.A.S.; Power, D.M.; Terauchi, R.; Reinhardt, R.; Canário, A.V.M. Gill Transcriptome Response to Changes in Environmental Calcium in the Green Spotted Puffer Fish. BMC Genomics 2010, 11, 476–496.
- Canli, M.; Atli, G. The Relationships Between Heavy Metal (Cd, Cr, Cu, Fe, Pb, Zn) Levels and the Size of Six Mediterranean Fish Species. Environmental Pollution 2003, 121(1), 129–136.
- Usero, J.; Izquierdo, C.; Morillo, J.; Gracia, I. Heavy Metals in Fish (Solea Vulgaris, Anguilla Anguilla and Liza Aurata) from Salt Marshes on the Southern Atlantic Coast of Spain. Environment International 2004, 29(7), 949–956.
- Dural, M.; Göksu, M.Z.L.; Özak, A.A. Investigation of Heavy Metal Levels in Economically Important Fish Species Captured from the Tuzla Lagoon. Food Chemistry 2007, 102(1), 415–421.
- Uysal, K.; Emre, Y.; Köse, E. The Determination of Heavy Metal Accumulation Ratios in Muscle, Skin, and Gills of Some Migratory Fish Species by Inductively Coupled Plasma-Optical Emission Spectrometry (ICP-OES) in Beymelek Lagoon (Antalya/Turkey). Microchemical Journal 2008, 90(1), 67–70.
- Al-Yousuf, M.H.; El-Shahawi, M.S.; Al-Ghais, S.M. Trace Metals in Liver, Skin, and Muscle of Lethrinus Lentjan Fish Species in Relation to Body Length and Sex. Science of The Total Environment 2000, 256(2–3), 87–94.
- Low, K.H.; Zain, S.M.; Abas, M.R.; Md. Salleh, K.; Teo, Y.Y. Distribution and Health Risk Assessment of Trace Metals in Freshwater Tilapia from Three Different Aquaculture Sites in Jelebu Region (Malaysia). Food Chemistry 2015, 177, 390–396.
- National Research Council. Nutrient Requirements of Warmwater Fishes; National Academy of Sciences: Washington, DC, 1977.
- Erdoğrul, Ö.; Erbilir, F. Heavy Metal and Trace Elements in Various Fish Samples from Sır Dam Lake, Kahramanmaraş, Turkey. Environmental Monitoring and Assessment 2007, 130(1–3), 373–379.
- Uysal, K.; Köse, E.; Bülbül, M.; Dönmez, M.; Erdoğan, Y.; Koyun, M.; Ömeroğlu, Ç.; Özmal, F. The Comparison of Heavy Metal Accumulation Ratios of Some Fish Species in Enne Dame Lake (Kütahya/Turkey). Environmental Monitoring and Assessment 2009, 157(1–4), 355–362.
- Ministry of Health. Food Act 1983 and Food Regulation 1985; Ministry of Health Malaysia: Kuala Lumpur, Malaysia, 1995.
- Mok, W.J.; Senoo, S.; Itoh, T.; Tsukamasa, Y.; Kawasaki, K.-i.; Ando, M. Assessment of Concentrations of Toxic Elements in Aquaculture Food Products in Malaysia. Food Chemistry 2012, 133(4), 1326–1332.
- Ruiz-de-Cenzano, M.; Beser, U.; Cervera, M.L.; de la Guardia, M. Fast Determination of Fish Mineral Profile. Application to Vietnamese Panga Fish. Ecotoxicology and Environmental Safety 2013, 95, 195–201.
- Adhikari, S.; Ghosh, L.; Giri, B.S.; Ayyappan, S. Distributions of Metals in the Food Web of Fishponds of Kolleru Lake, India. Ecotoxicology and Environmental Safety 2009, 72(4), 1242–1248.
- Asante-Duah, K. A Guide for Managing Chemical Contamination Problems. Risk Assessment in Environmental Management; John Wiley & Sons: Chichester, UK, 1998.
- FAOSTAT. Consumption of Fish and Fishery Products. Food and Agriculture Organization of the United Nations: http://www.fao.org/fishery/statistics/global-consumption/en ( accessed Oct. 2014).
- Azmi, M.Y.; Junidah, R.; Siti Mariam, A.; Safiah, M.Y.; Fatimah, S.; Norimah, A.K.; Poh, B.K.; Kandiah, M.; Zalilah, M.S.; Wan Abdul Manan, W.M.; Siti Haslinda, M.D.; Tahir, A. Body Mass Index (BMI) of Adults: Findings of the Malaysian Adult Nutrition Survey (MANS). Malaysian Journal of Nutrition 2009, 15(2), 97–119.
- USEPA, Guidance for Assessing Chemical Contaminant Data for Use in Fish Advisories, Risk Assessment, and Fish Consumption Limits; U.S. Environmental Protection Agency: Washington, DC, 2000.