
Abstract
Hydrocolloids act as stabilizer and thickening agents, thus able to replace emulsifying salts. The present study was planned to use к-carrageenan in the production of processed cheddar cheese and to explore its effect on physico-chemical and textural properties of processed cheddar cheeses. Different concentration of ҡ-carrageenan were used with gradual decrease in salt contents along with natural cheese, fat, and water to prepare processed cheddar cheese. The prepared samples were analyzed for physico-chemical and sensory attributes at storage interval of 45 days during and after 90 days. With the increase in hydrocolloid concentration, stiffer product was obtained and meltability of the samples decreased than control. Processed cheddar cheese samples having 0.15% к-carrageenan with 2% emulsifying salt (1.34% sodium citrate and 0.66% disodium phosphates) were found more acceptable in terms of physico-chemical and sensory attributes, but all sensory attributes got fewer score with the passage of storage time.
INTRODUCTION
By acidification and gel formation of milk with addition of rennet, a hard type cheddar cheese is obtained.[Citation1] Short shelf life and difficulty in selling of cheddar cheese proved a trigger behind the advent of processed cheese. Currently, the trend about consumption of processed cheddar cheese is increasing in pizza and pies due to the consumer preference. Processed cheeses are also preferred because they are easy to manufacture; are cheaper and impart good textural and nutritional characteristics in a wide variety of products.[Citation2] Processed cheese is prepared in different shapes and types according to its usage, for example, loaves, blocks, and slices, etc.[Citation3] The most important feature of the end product is smooth surface and meltability that are affected by components added and the manufacturing conditions.[Citation4]
Processed cheese is prepared by the combination of ripened cheddar cheese with emulsifying salts (ES), cream, and other dairy and non-dairy constituents. The blend is heated to get a well-mixed and smooth end product.[Citation5] In the manufacturing of processed cheddar cheese ingredients play an important role, and the selection of unprocessed cheddar is one of them. Age of the natural cheese affect the functionality of processed cheddar cheese due to the presence of intact casein in it.[Citation6] The important constituent in processed cheddar cheese other than cheddar cheese is ESs like sodium phosphate, trisodium citrate, etc., are used up to 2–3%.[Citation5,Citation7] In cheddar cheese, the three dimensional network is held by calcium ions. While in processed cheese they are replaced by sodium ions present in ESs. As a result, the insoluble Ca paracaseinate converted in to Na paracaseinate that has more solubility than calcium.[Citation8,Citation9] Reducing the enzyme’s activity, improving texture of the product and imparting specific flavor to the end product are important functions of salts besides emulsification.[Citation10] Traditional ESs also contain a high concentration of sodium (up to 30%, w/w) and trigger behind most cardiovascular diseases (CVD).[Citation11]
Keeping in view the major roles of salts in the product as an emulsifier, texture improver, taste enhancer, and shelf life extender; it is a very tough task for the industry to replace the salts.[Citation12] Certain hydrocolloids can replace the ESs and act as stabilizer, emulsifier, and have the ability to maintain the textural quality of the end product. Hydrocolloids can hold water, create gel, and increase the viscosity of the product. Keeping in view the properties of certain hydrocolloids, such as carrageenan, pectin, and various starches, etc. They can be used as a salt replacer in processed cheddar cheese.[Citation13,Citation14] However, there is very little literature regarding the total replacement of ES with carrageenan. There are few published articles that have dealt with carrageenan applications in processed cheese manufacturing especially as coating material. Carrageenan is a product obtained from red seaweed (Rhodophyceae). There are generally three types of carrageenan obtained namely (κ-kappa, і-iota, and Ɣ-lambda). First two fractions can be used in dairy products such as yogurt, cheese, etc. κ-carrageenan has the ability to form firm and brittle gel whiles the і-carrageenan form the soft and elastic gel. But і-carrageenan has a drawback of developing an unstable gel. κ-carrageenan can also improve the slice ability of the processed cheddar cheese and has no clear effect on the texture of the processed cheddar cheese when used less than 0.05% concentration.[Citation15] The objective of this study was to replace the sodium salts with κ-carrageenan used in different concentrations to lower the sodium contents in processed cheddar cheese and to check its effect on the quality and texture of the final product.
MATERIALS AND METHODS
Procurement of Raw Materials for Processed Cheddar Cheese
Rennet (CHR-Hansen Denmark), mesophilic starter culture, sodium chloride, ESs (disodium citrate, disodium phosphate), and κ-carrageenan (Danisco) and milk and cream (locally) were provided by Noon Dairies (Pvt. Ltd. Pakistan).
Manufacturing of Processed Cheddar Cheese
The preparation of processed cheddar cheese was started with shredding of cheddar cheese. Then all the shredded natural cheese along with ESs, к-carrageenan (according to treatment plan given in ) and cream (2 g/100 g) were poured in a steam jacketed cooker and were mixed along with heating at 65–75ºC for 15 min, heating depends upon the percentage of natural cheese. The hot processed cheddar cheese samples were then discharged into stainless steel molds (10.16 cm depth) from cooker and cooled. After cooling up to room temperature they were transferred to slicing and packaging section, where they were sliced into desired small rectangular shape blocks and packed in polythene bags under vacuum. Then the samples were transferred to storage room, where the samples were stored at 4–6ºC up to 90 days.
Table 1 Treatment plan
Quality Evaluation of Processed Cheddar Cheese
Physico-chemical analysis
Processed cheddar cheese samples were analyzed for their chemical composition (moisture, fat, protein, and ash content), pH, acidity, minerals contents with the interval of 45 days during storage.[Citation16] The fat content in cheese was determined by Gerber method using cheese butyrometer bearing the inscription “I.S. 69: 1955.”[Citation17] Sodium, calcium, and potassium contents were determined using flame photometer (Sherwood Flame Photometer 410, Sherwood Scientific Ltd. Cambridge, UK).[Citation18]
Meltability
Meltability of the processed cheese was determined by placing grated cheese plugs weighing approximately 3 g into test tubes, the test tubes were covered with aluminum foil, and holes were made to let the hot gas escape during heating. The test tubes were placed vertically in a refrigerator at 5°C for 30 min and then horizontally in an oven and heated at 100°C for 90 min. Meltability was measured in millimeters from the bottom of the test tube to the point at which the cheese has stopped flowing.[Citation19]
Instrumental texture profile analysis (TPA) of cheese
The effect of hydrocolloids on texture of the processed cheese was evaluated after 90 days by performing the TPA of the cheese samples on TA-XT Plus Texture Analyzer (Stable Micro Systems, Godalming, Surrey, UK) using compression plate probe P-75.[Citation20] Cheese samples were placed in airtight plastic bags and equilibrated at 8°C for 18 h. Cubes of 25 mm length, width, and height were cut from each sample using a stainless steel wire cutter and equilibrated at 8°C for a further 30 min. before analysis. Samples were removed from the incubator and immediately compressed to 30% of the original height in two consecutive cycles (double compression) at a rate of 1 mm/s.
Sensory Evaluation
Processed cheddar cheese samples were evaluated for sensory evaluation during storage by a panel of trained assessors drawn from faculty members and post-graduate students including both male (15) and female (10) to judge the influence of ҡ-carrageenan by using hedonic scale.[Citation21] Panelists were round about 26–40 years of age with sound health and good sensory attributes. The test was carried out in a well-ventilated, odorless, and quiet location.
Statistical Analysis
Significant difference among the treatments of final data obtained was determined by using analysis of variance (ANOVA) technique under completely randomized design (CRD) with two factor factorial on Statistical Package for the Social Sciences (SPSS; version 10.0.1, 1999). The means of all treatments were compared by using the Tukey (HSD) test.[Citation22]
RESULTS AND DISCUSSION
Physico-Chemical Analysis
shows the mean values of pH and acidity throughout storage period and depicted that storage and treatments had significant (p < 0.01) effect over pH and acidity; however, the interaction between storage time and treatments was non-significant. The highest pH (5.48) was recorded in T0 and T1 treatment at 90 days of analysis while the lowest pH (5.31) was recorded in T3 at 0 days of storage, respectively. The pH difference is due to different rate of acid production by starter cultures and salt tolerance of the different starter culture.[Citation23] Generally, it can be said that sodium salts of phosphates change the pH of the cheese blend (they usually cause increased pH of blend) and contribute to pH stabilization due to their buffering capacity.[Citation5] As in this study, the salt concentration is reducing so the pH is decreasing. Acidity behaves reciprocal to pH, when pH falls the acidity increased or vice versa. The highest acidity (0.90%) was recorded in T2 treatment at 90 days of analysis while the lowest acidity (0.71%) was recorded in T0 and T3 at 0 day of storage.
Table 2 Effect of treatments and storage on pH and acidity of processed cheddar cheese
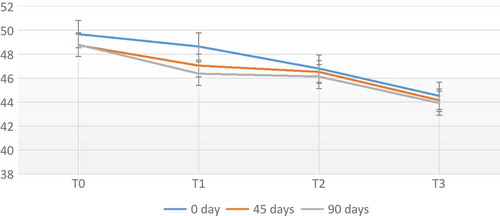
The results regarding mean values of moisture presented in revealed highly significant (p < 0.01) variation in moisture contents of processed cheddar cheese due to treatments, storage days and as well as the interaction of both. The moisture values were collected on 45 days interval showed the lost in moisture from the start of storage period up to end of period. During storage the highest decrease in moisture was (2.26 g/100 g) in T1 and lowest decrease was (0.6 g/100 g) in T3. It is observed that the treatment having lower concentration of salts and higher concentration of hydrocolloids give less loss of water. It means that the к-carrageenan hold the water of processed cheese. Water gets evaporated during storage of processed cheddar cheese and the main reason of water loss is the improper packaging material. The findings of this experiment are in accordance with the literature data.[Citation24,Citation25] These authors reported that under controlled conditions processed cheese slices, for 1 month, may present a weight loss of 2–5 g/kg. The mean values of fat content of processed cheddar cheese are given in after 0, 45, 90 days of storage. Non-significant (p > 0.05) increase was observed in fat contents of processed cheddar cheese samples.[Citation26]
Table 3 Effect of treatments and storage on protein, fat, and ash contents (g/100 g) of processed cheddar cheese
FIGURE 1 Effect of treatments and storage on moisture (g/100) of processed cheddar cheese.It represents mean vales with standard deviation where as T0: sodium citrate 2%, disodium phosphate 1%; T1: sodium citrate 2%, disodium phosphate 1%, к-carrageenan 0.1%; T2: sodium citrate 1.34%, disodium phosphate 0.66%, к-carrageenan 0.15%; T3: sodium citrate 0.66%, disodium phosphate 0.33%, к-carrageenan 0.2%.
The mean values of protein contents of processed cheddar cheese given in revealed significant effect (p < 0.05) of treatments and non-significant effect on storage days and their interaction. The highest mean value was recorded in T0 (23.45 g/100 g) and lowest value was (23.11 g/100 g) in the T2 treatment. Less difference was found among the T1 (0.05 g/100 g) treatment. Largest difference found among T3 treatment was approximately (0.53 g/100 g). The minute difference among the treatments proved that protein was insignificantly changed during storage. In a study it has been observed that protein undergoes proteolytic changes during storage, it was due to proteolytic microorganism which were present in cheddar cheese.[Citation23] Difference among treatments may be due to the к-carrageenan that forms the strong network in collaboration with casein protein, that can held the more protein than ESs used alone. This is due to increase in rigidity of network by using к-carrageenan as it can hold the large quantity of protein.[Citation14]
Data showed the significant effect (p < 0.05) of treatments on ash content and non-significant (p ≥ 0.05) effect during storage days and in interaction of both storage days and treatments. High significance among treatments is due to different levels of к-carrageenan used with gradual decrease in salt content i.e. from 3 to 1 g/100 g in combination. T3 is showing maximum decrease of ash content (0.01 g/100 g). This might be due to the loss of moisture contents from processed cheddar cheese samples during storage.
Mineral Contents (Na, K, and Ca)
Mean values of sodium, potassium, and calcium contents (mg/100 g) shown in revealed significant (p < 0.05) variation in treatments while the non-significant behavior observed during storage. Difference in treatments is due to the decrease in sodium salt (sodium citrate and disodium phosphate). The decrease in potassium content among treatments is due to lesser amounts of salt used in treatments. There was a gradual increase in Ca content during 90 days of storage. The results of calcium content regarding processed cheddar cheese are closer to a previous finding who reported that during ripening there was conversion of insoluble Ca to soluble Ca.[Citation27]
Table 4 Effect of treatments and storage on sodium, potassium and calcium contents (mg/100 g) of processed cheddar cheese
Meltability
The results of means of meltability of processed cheddar cheese are given in . Statistical results of meltability of processed cheddar cheese show the highly significant (p ≤ 0.01) effect among treatments and significant (p ≤ 0.05) during storage days while a non-significant effect was observed in combination of both treatments and storage days. The decrease in meltability in treatments is due to the decrease in concentration of ESs and the increase in the concentration of к-carrageenan. A study reported that meltability of the processed cheese is associated with the microstructure of the fat emulsion.[Citation28] ESs are used for fat emulsion. As in treatments, ESs are replaced by к-carrageenan (act as stabilizer and gel former), it provides a strong gel and the loss of water make a more crumbled gel than sticky one. This may be the reason of decrease in the meltability of processed cheddar cheese samples. The current results regarding decreased meltability correlate with the literature that said that carrageenan interacts with the phosphoprotein (casein) and decreases the meltability of the gel complex.[Citation29,Citation30]
Table 5 Effect of treatments and storage on meltability (mm) of processed cheddar cheese
Sensory Evaluation
The evaluation of processed cheddar cheese slices was conducted for different sensory attributes like flavor, appearance, firmness, stickiness, crumbliness, sliceability, and overall acceptability, following the 9-point hedonic scales Performa presented to the panelists for recording scores.
The means of all the sensory parameters are provided in . Appearance is an important property of any edible thing. Processed cheddar cheese with ES has a proper and well-defined shape as compared to that prepared by using к-carrageenan. The reason behind it is the loss in emulsification property of processed cheddar cheese. Processed cheese shows a very little flavor changes during storage indicating that cheese system involved in the air induced changes are heat-labile. Variation in flavor was non-significant. T1 and T2 have the highest values of flavor as 7.6 ± 0.2.
Table 6 Means ± SD of various parameters for sensory evaluation of processed cheddar cheese
Our results resemble the previous findings, according to which flavor development is a complex microbiological, biochemical, and chemical process that occur during ripening of the cheese. Glycolysis, lipolysis, and proteolysis are involved in flavor development of the processed cheese. Firmness of the processed cheddar cheese samples was increased to some extent with the increase in the amount of к-carrageenan and decreased at its 0.2% concentration with the decrease in ES.[Citation31,Citation32] As we decrease the ES concentration, sliceability also decreased and crumbliness and stickiness increased because salt play role in emulsification. Stickiness was increased as the к-carrageenan (hydrocolloids) forms the stronger Na-paracaseinate network than Ca-paracaseinate. T2 had the best appearance value, i.e. 76±0.2. T2 was regarded as the best treatment by the judges.
Instrumental Textural Profile Analysis
Hydrocolloids have high impact on textural profile, i.e., hardness, cohesiveness, springiness, chewiness, and gumminess. Mean values of all these parameters are given in collectively. The results indicated that increasing concentration of k-carrageenan in processed cheese changes the properties of its gel, which shows higher rigidity. This could be explained by the fact that with increasing concentration of к-carrageenan more intensive interactions between carrageenan chains take place, which leads to the formation of a “denser” (more intensive) network structure.[Citation33,Citation34] Highest recorded difference between treatments T0 and T3 was (1002.7) and least difference was (16.3) between T2 and T3.
Table 7 Means ± SD of various parameters for textural profile analysis (TPA) of processed cheddar cheese
Mean values of cohesiveness of processed cheddar cheese samples showed highest reduction between T0 and T2 while the least difference was between T0 and T1. Mean values of cohesiveness depicted the decreasing trend with the increase of к-carrageenan concentration as the spread ability of the end product was decreased.[Citation33] Mean values of springiness indicate the less variation among treatments as compare to control. Treatments T0 and T2 are closely related to one another. T2 has 0.15 g/100 g addition of к-carrageenan with 1.33 g/100 g salt addition (both disodium phosphate and tri-sodium citrate). The reason behind the lesser difference in springiness of treatments may be the reduced level of ESs. Mean values of chewiness and gumminess showed the increasing trend from the T0. T1 had maximum chewiness and gumminess, i.e., 1749.4 ± 3.5 and 1774.1 ± 3.2, respectively. It is due the development of strong/firmer gel by the addition of к-carrageenan. Both factors affect the mouthfeel of the observer.
CONCLUSION
Increased values of acidity and decrease in pH, fat, ash, sodium, potassium, and meltability was observed by the incorporation of к-carrageenan in processed cheddar cheese. However, overall acceptability decreased and in TPA treatments tends to hardened gradually with the addition of к-carrageenan. So some parameters were affected negatively by addition of ҡ-carrageenan, but processed cheddar cheese samples having 0.15% к-carrageenan with 2% ES (1.34% sodium citrate and 0.66% disodium phosphates) were found more acceptable in terms of physico-chemical and sensory attributes as compared to other treatments.
REFERENCES
- Banks, J.M. Cheddar-Type Cheese. In Encyclopedia of Dairy Sciences, Roginski, H. (Ed.), Elsevier: Oxford, UK, 2002.
- Guinee, T.P. Cheese Analogues. In Encyclopedia of Dairy Science, Vol. 1; Roginski, H.; et al.; Eds.; Academic Press: Amsterdam, Netherlands, 2003; 428–434.
- Kapoor, R.; Metzger, E.L. Process Cheese: Scientific and Technological Aspects. Comprehensive Reviews in Food Science and Food Safety 2008, 7, 194–214.
- Fagan, C.C.; Everard, C.; O’Donnell, C.P.; Downey, G.; Sheehan, E.M.; Delahunty, C.M.; O’Callaghan, D.J.; Howard, V. Prediction of Processed Cheese Instrumental Texture and Meltability by Mid-Infrared Spectroscopy Coupled with Chemometric Tools. Journal of Food Engeneering 2007, 80, 1068–1077.
- Guinee, T.P.; Caric, M.; Kalab, M. Pasteurized Processed Cheese and Substitute/Imitation Cheese Products. In Major Cheese Groups, 3rd Ed.; Fox, P.F.; McSweeney, P.L.H.; Guinee, T.P.; Cogan, T.P.; Eds.; Cheese: Chemistry, Physics, and Microbiology 2004, 2, 349–394. Elsevier Academic Press: London, UK.
- Berger, W.; Klosmeyer, H.; Merkenich, K.; Uhlmann, G. Process Cheese Manufacture. A JOHA Guide; BK Guilini Chemie: Ladenberg, Germany, 1998.
- Mizuno, R.; Lucey, J.A. Effects of Emulsifying Salts on the Turbidity and Calcium-Phosphate-Protein Interaction in Casein Micelles. Journal of Dairy Science 2005, 88, 3070–3078.
- Cunha, C.R.; Viotto, W.H. Casein Peptization, Functional Properties, and Sensory Acceptance of Processed Cheese Spreads Made with Different Emulsifying Salts. Journal of Food Science 2010, 75, 113–120.
- Dimitreli, G.; Thomareis, A.S. Instrumental Textural and Viscoelastic Properties of Processed Cheese As Affected by Emulsifying Salts and in Relation to Its Apparent Viscosity. International Journal of Food Properties 2009, 12, 261–275.
- McMahon, D.J. Issues with Low and Lower Salt Cheeses. Australian Journal of Dairy Technology 2010, 65, 2000–2005.
- Doetsch, M.; Busch, J.; Batenburg, M.; Liem, G.; Tareilus, E.; Mueller, R.; Meijer, G. Strategies to Reduce Sodium Consumption: A Food Industry Perspective. Critical Reviews in Food Science and Nutrition 2009, 49, 841–851.
- Purdy, J.; Armstrong, G. Dietary Salt and the Consumer: Reported Consumption and Awareness of Associated Healthy Risks. In Reducing Salt in Foods: Practical Strategies; Guinee, T.P.; O’Kennedy, B.T.; Eds.; CRC Press: Boca Raton, FL, 2007; 99–123.
- Bennett, R.J.; Trivedi, D.; Hemar, Y.; Reid, D.C.W.; Illingworth, D.; Lee, S.K. The Effect of Starch Addition on the Rheological and Microstructural Properties of Model Processed Cheese. Australian Journal of Dairy Technology 2006, 61, 157–159.
- Gustaw, W.; Mleko, S. The Effect of Polysaccharides and Sodium Chloride on Physical Properties of Processed Cheese Analogs Containing Whey Proteins. Milchwissenschaft 2007, 62, 59–62.
- Schaffer, B.; Szakaly, S.; Lorinczy, D.; Schaffer, B. Processed Cheeses Made with and Without Peptization. Journal of Thermal Analysis and Calorimetry 2001, 64, 671–679.
- AOAC. Official Methods of Analysis, 15th Ed.; The Association of Official Analytical Chemists. 17th ed. Association of Analytical Communities. Gaithersburg, MD, 2000.
- Marshall, R.T. Standards Methods for Determination of Dairy Products, 16th Ed.; American Public Health Association: Washington, DC, 1993.
- Kirk, S.R.; Sawayer, R. Pearson’s Composition and Analysis of Food, 9th Ed.; Longman: London, UK, 1991.
- Muthukumarappan, K.; Wang, Y.C.; Gunasekaran, S. Modified Schreiber Test for Evaluation of Mozzarella Cheese Meltability. Journal of Dairy Science 1999, 82, 1068–1071.
- O’Mahony, J.A.; Lucey, J.A.; McSweeney, P.L.H. Chymosin-Mediated Proteolysis, Calcium Solubilisation, and Texture Development During the Ripening of Cheddar Cheese. Journal of Dairy Science 2005, 88, 3101–3114.
- Awad, R.; Abdul-Hamid, A.; El-Shabrawy, L.B.; Singh, R.K. Physical and Sensory Properties of Block Processed Cheese with Formulated Emulsifying Salt Mixtures. International Journal of Food Properties 2004, 7, 429–448.
- Steel, R.G.D.; Torrie, J.H.; Dickey, D.A. Principles and Procedures of Statistics. A Biometrical Approach, 3rd Ed.; McGraw Hill Book Co. Inc.: New York, NY, 1997.
- Shakeel-ur-rehman; Farkey, N.Y.; Yim, B. Use of Dry Milk Protein Milk Concentrate in Pizza Cheese Manufactured by Culture or Direct Acidification. Journal of Dairy Science 2003, 86, 3841–3848.
- Hong-Hua, X.; Yin-Yuan, H.; Xin-Huai, Z.; Tie-Jing, L. Variations of Hausdorff Dimension and Selected Textural Indices of Cheddar and Gouda Cheeses During Storage. International Journal of Food Properties 2013, 16 (1), 81–90.
- Pastorino, A.J.; Hansen, C.L.; McMahon, D.J. Effect of Salt on Structure-Function Relationships of Cheese. Journal of Dairy Science 2003, 86, 60–69.
- Schar, W.; Bosset, J.O. Chemical and Physico-Cheical Changes in Processed Cheese and Readymade Fondue During Storage. A Review. Lebensmittel-Wissenschaft Technology 2002, 35, 15–20.
- Nickerson, M.T.; Paulson, A.T.; Hallett, F.R. Dilute Solution Properties of k-Carrageenan Polysaccharides: Effect of Potassium and Calcium Ions on Chain Conformation. Carbohydrate Polymers 2004, 58, 25–33.
- Zhang, L.; Xiaodong, L.; Hongjing, R.; Lu, L.; Liyuan, M.; Minghao, L.; Weiwei, B. Impact of Using Exopolysaccharides (EPS)-Producing Strain on Qualities of Half-Fat Cheddar Cheese. International Journal of Food Properties 2015, 18(7), 1546–1559.
- Zehren, V.L.; Nusbaum, D.D. Processed Cheese, 2nd Ed.; Cheese Reporter Publishing Co. Inc. Madison, WI, 2000.
- Lazaridis, H.N.; Rosenau, J.R. Effects of Emulsifying Salts and Carrageenan on Rheological Properties of Cheese Like Products Prepared by Direct Acidification. Journal of Food Science 1980, 45, 595–597.
- Marilly, L.; Casey, M.G. Flavour of Cheese Products: Metabolic Pathways, Analytical Tools, and Identification of Producing Strains. International Journal of Food Microbiology 2004, 90, 139–159.
- Smith, G.; Smit, B.A.; Wim, J.M.; Engels, J.M. Flavour Formation by Lactic Acid Bacteria and Biochemical Flavour Profiling of Cheese Products. FEMS Microbiology Reviews 2005, 29, 591–610.
- Cernikova, M.; Bunka, F.; Pavliek, V.; Brezina, P.; Hrabe, J.; Valasek, P. Effect of Carrageenan Type on Viscoelastic Properties of Processed Cheese. Food Hydrocolloid 2008, 22, 1054–1061.
- Ribeiro, K.O.; Rodrigues, M.I.; Sabadini, E.; Cunha, R.L. Mechanical Properties of Acid Sodium Caseinate-k-Carrageenan Gels: Effect of Co-Solute Addition. Food Hydrocolloid 2004, 18, 71–79.