
 ?Mathematical formulae have been encoded as MathML and are displayed in this HTML version using MathJax in order to improve their display. Uncheck the box to turn MathJax off. This feature requires Javascript. Click on a formula to zoom.
Abstract
Alkaline extraction followed by acid precipitation were employed to extract rapeseed protein and, Alcalase 2.4 L was used to obtain rapeseed protein hydrolysates. Three groups of rapeseed protein hydrolysates were obtained by purifying with membrane ultrafiltration and a Sephacryl S-100HR gel column. The antioxidant activities were then determined. Group 3 had the best antioxidant activities according to the oxygen radical absorbance capacity, peroxyl radical-scavenging capacity, and cellular antioxidant activity assays, with the following antioxidant values: an oxygen radical absorbance capacity value of 1610 ± 113 µmol TE/(g sample), a peroxyl radical-scavenging capacity value of 622 ± 30 mg VC/(100 g sample), and a cellular antioxidant activity value of 25 ± 2 µmol QE/(g sample) and corresponding EC50 value of 58 ± 3 µg/mL. Six peaks of group 3 were collected and well separated by reversed phase–high-performance liquid chromatography. Peak 5 were identified to exhibit a higher antioxidant activity, the amino acid sequence of which was found to be Trp-Ile (Leu)-Tyr, as determined by liquid chromatography–mass spectrometry.
INTRODUCTION
The planting area and total output of Brassica in China is 30% greater than the world average, resulting in a number one ranking in the world.[Citation1] Rapeseed meal is an important plant protein resource and contains approximately 30–45% protein after degreasing. Rapeseed protein is composed mainly of 12S globulin and 2S albumin.[Citation2] Rapeseed meal or rapeseed protein can be degraded into small molecule polypeptides, and some of these small molecule rapeseed peptides have the advantages of quick absorption, low energy consumption, high absorption rate, and rich nutritional value as well as antioxidant, antihypertension, and antitumor biological properties.[Citation3] Our country lacks abundant protein resources, so the use of abundant and inexpensive rapeseed meal has important practical significance for increasing the supply of high quality protein resources and promoting human health.
Both the excess of oxidative free radicals in the body and the formation of lipid peroxide can damage cells and tissues. Oxidative damage has a close relationship with aging, cancer, diabetes, and other diseases. Peptides that inhibit Human Immunodeficiency Virus (HIV) have been separated by reversed phase–high-performance liquid chromatography (RP–HPLC) after purification using a Biogel P2 column.[Citation4] Through enzyme hydrolysis, Yoshie-Stark et al.[Citation5] obtained rapeseed peptides that show significant diphenyl picryl hydrazinyl radical (DPPH) radical-scavenging ability. A previous study reported that the enzyme hydrolysis product of rapeseed protein exhibits antioxidant activity.[Citation6] These researchers concluded that rapeseed peptides might be rich in hydrogen donors, which have the ability to provide hydrogen protons that can restore free radicals with high oxidation and terminate the radical chain reactions, thus removing or inhibiting free radicals.
Among these methods for chemical analysis of antioxidant capacity, the hydrogen peroxide radical-scavenging (PSC) method is the leading technique, as it provides rapid and easy detection and can measure the oxidation resistance ability of not only water-soluble but also fat-soluble samples.[Citation7] At present, the oxygen radical absorption capacity (ORAC) method is the most simple and sensitive technique to evaluate antioxidant activity.[Citation3] Wolf et al.[Citation8] performed a determination method of cellular antioxidant capacity (CAA) that reflects the absorption, metabolism, and distribution change of antioxidants at the cellular level. This method has a shorter experimental time and simpler measurement process than animal experiments. CAA is based on the study of the anticancer mechanism of antioxidants, and liver cancer is regarded as the test cell type.
HPLC, especially RP–HPLC analysis, is widely used in identification and quantitation of components in different kinds of samples.[Citation9] RP–HPLC has been recognized to be one of the most widely used technique for separation, purification, and identification. RP–HPLC is most effective for separation of molecules less than 5000_Da, especially for the separation and purification of 10,000_Da, the polarity of small molecular peptides.[Citation10] Mass spectrometry (MS) can provide abundant structural information, it has been the most common and effective method in the qualitative analysis of proteins and peptides. Electrospray ionization (ESI) is a kind of interface technology which combines liquid chromatographic separation with MS detection. Compared with the traditional MS, ESI–MS techniques can produces more charged peaks and expands the detection range of molecular weight and raise the sensitivity. With the constantly improvement of the interface technology in liquid chromatography and MS, LC–ESI–MS plays an important role in the field of roteomics,[Citation11] and it is becoming more and more popular due to the advantages of easy sample preparation without derivatization, sample conservation without contamination, faster analysis, and lower detection limits.[Citation12]
In this study, rapeseed protein hydrolysates (RPHs) were obtained by hydrolyzing rapeseed protein with alkaline protease, and different components of RPHs were obtained through membrane ultrafiltration and a Sephacryl S-100HR gel column. ORAC, PSC, and CAA methods were utilized to determine the oxidation resistance of the hydrolysates to identify rapeseed peptides with high antioxidant activities. Then the group with high antioxidant activities would be separated by RP–HPLC to get a group with higher antioxidant activities and smaller molecular weight and primary structure would be determined by LC–MS.
MATERIALS AND METHODS
Materials and Reagents
Double-zero Brassica napus (Qinyou Number 7) was purchased from the Jiangsu Academy of Agricultural Sciences. Samples were defatted by soxhlet extraction after shelling, dried by airing in the fume hood and ground by sample preparation mills. The following reagents were used in this study: Sephacryl S-100HR was purchased from GE Healthcare (America) and Alcalase 2.4 L from Novozyme (Copenhagen, Denmark). Polypeptide sodium dodecyl sulfate–polyacrylamide gel electrophoresis (SDS–PAGE) Molecular Weight Standards was purchased from BIO-RAD (California, USA). N,N-methylene double acryl amine, Tris, ammonium persulfate, SDS, TEMED, acrylamide, tricine, Coomassie brilliant blue G-250, bromophenol blue, β-mercaptoethanol, fluorescein sodium salt, dimethyl sulfoxide (DMSO), and Trolox (6-hydroxy-2,5,7,8-tetramethylchroman-2-carboxylic acid) were all purchased from Sigma-Aldrich (Madrid, Spain). Fetal bovine serum (FBS), Williams’ Medium E (WME) medium, Hank’s balanced salt solution (HBSS), and other cell culture reagents were from Gibco (California, USA). The petroleum ether, sodium hydroxide, concentrated hydrochloric acid, absolute ethyl alcohol, and other reagents were analytical grade.
Method
Preparation of rapeseed peptides
Following the methods of our own laboratory, the rapeseeds were hulled and degreased by petroleum ether in a soxhlet extractor for 72 h. The samples were then dried by airing in a draught cupboard and ground by a grinder. Rapeseed powder (100 g) was dissolved in 2000 mL of distilled water, and the pH was adjusted to 11 with NaOH. The solution was stirred at room temperature for 1 h, and the supernatant was then collected after centrifugation (10 min and 4000 × g). The pH was then adjusted to 4.5. The sample was left static for 30 min, and the supernatant was discarded after centrifugation (10 min and 4000 × g). The precipitate was washed twice with 95% alcohol and incubated overnight at –20°C, and dried by vacuum freeze drying.
Rapeseed protein (2 g) prepared according to the above steps was dissolved in 40 mL of distilled water, and the pH was adjusted to 9. Aalkaline protease enzymolysis liquid (40 µL) was then added to the solution. The temperature of this reaction was controlled at 50°C, and the pH was controlled to be approximately 9. After 5 h, the reaction solution was placed in a 95°C water bath for 15 min to inactivate the enzyme. The pH of the liquid was 4.5 as it cooled. The sample was left static for 30 min, and the supernatant was collected by centrifugation for 20 min (10,000 × g and 4°C). The pH was adjusted to 7.0. After filtration using a 0.45 µm microfiltration membrane, the liquid was vacuum concentrated (0.06 Mpa at 45°C), and the RPHs were obtained by vacuum freeze drying.
Membrane separation
RPH solution (4 L) was prepared with the concentration of 1 g/L and a group molecular weight <10 K. The solution was passed through an ultrafiltration membrane, vacuum concentrated (0.06 Mpa and 45°C) and freeze-dried.
Separation by Sephacryl S-100HR gel column chromatography
The RPH (molecular weight <10 K) was dissolved in distilled water to obtain a concentration of 0.01 g/L. The solution was separated by a system composed of column chromatography, constant flow pump, automatic fraction collector, ultraviolet (UV) detector, and recorder. The different groups were then collected in the UV wavelength of 280 nm with an elution velocity of 60 mL/h, and the samples were dried using a vacuum freeze dryer.
ORAC assay
Following the literature,[Citation13] the RPH dilution was prepared with 75 mmol phosphate buffer (pH 7.4). The assay was performed in black 96-well plates, and the outside wells of the plate were not used, as there was more variation in these wells than the inner wells. To each well, 20 µL of sample dilution or 20 µL of Trolox standard (concentration range of 6.25–50 µM) and 200 µL of fluorescein (concentration of 0.96 µmol) were added. The plate was incubated at 37°C for 20 min, and 20 µL of 119 mmol 2,2-azobis (2-amidino-propane) dihydrochloride (ABAP) was then added to each well after incubation. Fluorescence intensity was measured using a SpectraMax M2e Microplate System at excitation of 485 nm and emission of 520 nm for 35 cycles every 5 min. ORAC values were expressed as millimoles of Trolox equivalents per gram of sample. The data were reported as the mean ± SD of at least three replicates for each sample.
Hydrogen PSC assay
The PSC assay was performed according to the method of Adom and Liu.[Citation14] Briefly, 200 mmol/L ABAP was prepared and stored at 4°C (made fresh for each assay). KOH (1.0 mL; 893 µL) was added to a beaker, and then 107 µL of 2.48 mmol 2’,7’-dichlorofluorescein diacetate (DFCH-DA) was added to the glass and mixed. The solution was incubated in the dark for 5 min for hydrolysis, and then 7 mL of 75 mmol phosphate buffer (pH 7.4) was then added to the solution. The RPH (0.04 mg/mL) was diluted with 75 mM phosphate buffer. The sample (100 µL), DCFH (100 µL), and 100 mmol/L ABAP (50 µL) were then added to the 96-well plates. The plates were read using a SpectraMax M2e Microplate System at fluorescent wavelengths of 485 nm excitation and 538 nm emission. The results were calculated as milligrams of vitamin C equivalents per 100 g of sample. The data were reported as the mean ± SD of at least three replicates for each sample.
Cytotoxicity test using the MTT assay
A cytotoxicity test was performed using the MTT assay. Briefly, HepG2 cells were seeded at a density of 104 cells/well in a 96-well microplate with 100 µL of growth medium/well. The cells were incubated for 24 h at 37°C. After the cells attached to the wells, the growth medium was removed. Medium (100 µL) with different concentrations of RPHs was added to each well, and wells that received medium without RPHs served as the control. After 24 h of incubation at 37°C, the medium was removed. The cells were then incubated for 4 h at 37°C after the addition of 20 µL of MTT (5 mg/mL) to every well, and 200 µL of DMSO was added after the incubation.The plate was placed on an oscillator for 30 min, and absorbance was measured at 570 nm in a microplate reader. The different concentrations of RPHs were compared to the control according to the following equation:
where OD1 is the optical density value of sample; and OD0 is the optical density value of the control. Every sample was measured in three replicates, and the results were averaged.
CAA assay
The CAA assay has been previously described by Wolf et al.[Citation8] HepG2 cells were seeded at a density of 6 × 10⁴ cells/well in a 96-well microplate with 100 µL of growth medium/well. Twenty-four hours after seeding, the growth medium was removed, and the wells were washed with PBS. Triplicate wells were treated for 1 h with 100 µL of medium containing different concentrations of RPHs plus 25 µmol DCFH-DA. The cells were then treated with RPHs and APAP, and 100 µL of ABAP (600 µmol) diluted with HBSS was added to the cells. The 96-well microplate was placed in a SpectraMax M2e Microplate System at 37°C, and the emission wavelength at 538 nm was measured after an excitation at 485 nm every 5 min for 1 h. After the subtraction of the blank and the initial fluorescence values, the area under the fluorescence versus time curve was calculated to determine the CAA value at each concentration of RPHs. The following equation was used:
where ∫SA is the area under the sample in the fluorescence versus time curve; and ∫CA is the area under the control in the fluorescence versus time curve. The median effective dose (EC50) of the RPHs was calculated from the median effect plot of log (fa/fu) versus log (dose) where fa is the fraction affected by the treatment (CAA) and fu is the fraction unaffected (1−CAA) by the treatment. The EC50 values were expressed as the mean ± SD.
Amino acid analysis
Sample of 500 mg was weighed in a 10 mL acid hydrolysis tube, and 6 mol/L HCL was added. The tube was sealed using an alcohol blast burner under vacuum and placed at 110°C. After 24 h, the tube was opened, and the hydrolysate was condensed, dissolved with 0.02 mol/L HCL and diluted with deionized water in a final volume of 50 mL. The supernatant was collected after centrifugation (15 min and 1500 rpm), filtered using a 0.22 µm microfiltration membrane, transferred to a 2 mL sample bottle and analyzed by an automatic amino acid analyzer.
Antioxidant peptides separated by RP–HPLC
The solution of peptides which possessed a great antioxidant activity was separated by Sephacryl S-100HR gel column chromatography, and the final concentration was adjusted to 30 mg/mL. The solution was filtered through a 0.22 μm membrane and a aliquot of 100 µL solution was injected for RP–HPLC analysis 280 nm. The elution was performed with the mobile phase containing solvent A (5% acetonitrile) and solvent B (0.05% TFA in 80%acetonitrile). Waters XBridgeTM prep C18 was used as the column. The flow rate was at 2.36 mL/min. The column was operated at 30°C. Each group was collected by automatic collection and then freeze dried. Determination of antioxidant activity of each group using ORAC and PSC were carried out, respectively.
Analysis of peptides with antioxidant properties by LC–MS
The group collected by RP–HPLC that demonstrated the highest ORAC value and PSC value was then analyzed by LC–MS. The LC condition adopted in this assay were as followed: Agilent C18 Eclipse XD8-18 (4.6 × 250 mm, 5 μm) was used as chromatographic column. The elution was performed for 50 min with the mobile phase containing solvent A (5% acetonitrile with 0.1% acetic acid) and solvent B (80% acetonitrile with 0.1% acetic acid). The injection volume was 20 μL and the rate of flow was 0.6 mL/min.
The MS analysis was performed as followed: Detection was under positive ion mode with scanning range of 50~1000 m/z; The assay was carried out at the capillary temperature of 350ºC and 3.50 volts; The detection wavelength was 280 nm; 25.0 psi was used as the pressure of atomizing nitrogen and 9.0 mL/min was used as the velocity of dry nitrogen.
Statistical Analysis
SPSS19.0 was used to analyze the correlations. The least significant difference (LSD) and Duncan tests were used to analysis the significant difference of samples, and the significance level was p < 0.05.
RESULTS AND DISCUSSION
Separation by Sephacryl S-100HR Gel Column
The RPHs (molecular weight <10 K by ultrafilter) were separated into three groups using Sephacryl S-100HR column chromatography. The three resulting peaks are shown in . Each group was collected and subjected to freeze drying, and the antioxidant activities were then measured for the three groups.
FIGURE 1 Gel chromatography of the purification of rapeseed protein hydrolysates by the Sephacryl S-100HR column.
Antioxidant Activity as Measured by the ORAC Assay
Compared to the valuation methods of antioxidant activities, the ORAC assay is considered easier to use, more effective, and more accurate with higher sensitivity and a wider application range.[Citation15] Research has shown that the antioxidant activities of both fat-soluble and water-soluble substances can be measured by changing the free radicals and reaction system solvent, and the resulting determinations of antioxidant activities in vitro are closer to the physiological process.[Citation16] Recently, studies have found that experimental results are more accurate when using a multi-channel liquid handling system and microplates, which contribute to the automation of the ORAC assay and efficient analyses.[Citation17] This determination of antioxidant activities has been applied to industrial production, and the ORAC values have been noted on some product labels. This method has also been applied to the antioxidant capacity analysis of biological samples, fruits, vegetables, and soft drinks. In this study, the ORAC values of each group of the RPHs are shown in .
FIGURE 2 The antioxidant activity of the groups of RPHs; A: ORAC values of the groups of RPHs; B: PSC values of the groups of RPHs; C: Cytotoxic effects of the groups of RPHs by using MTT dye; D: CAA values of the groups of RPHs. Note: Histograms marked with different letters are significant at p < 0.05.
shows that the RPH group 3 had the highest ORAC value of 1810 ± 92 µmol TE/(g sample) compared to the other groups. He et al.[Citation18] also used the same method to measure the oxygen radical-scavenging capacity of RPHs, and they showed that the ORAC value reaches 2494 ± 135 µmol TE/(g protein) with a molecular weight <1 K.
Antioxidant Activity as Measured by the PSC Assay
According to the improved method of the PSC assay,[Citation3] the accumulation of fluorescence occurred in the first 36 min, and the antioxidant capacities were calculated per 100 gram samples corresponding to the amount of vitamin C. shows that group 3 had the highest antioxidant activity with a PSC value of 622 ± 30 mg VC/(100 g samples). The PSC value of RPHs without separation was 363 ± 63 mg VC/(100 g sample), and the PSC values of group 1 and group 2 were 113 ± 40 and 230 ± 55 mg VC/(100 g samples), respectively. The PSC values of the four groups had significant correlation (p < 0.05).
Antiproliferative Effect of Hepg2 Cells as Measured by the MTT Assay
The inhibitory effects of the RPHs on HepG2 cells were validated by measuring potential cytotoxicity using the MTT assay. HepG2 cells were cultured with RPHs (concentration ranging from 25 to 400 mg/L), and the cytotoxicity of each RPH group was measured by the changes of OD values compared to the control group. The results are shown in .
The RPH groups with concentrations of 200 and 400 mg/L significantly inhibited HepG2 cell proliferation. As the concentration reached 400 mg/L, all groups showed cytotoxicity, and the cell viability dropped to approximately 60%. When the concentration was 200 mg/L, group 1 and RPHs without separation promoted strong cytotoxicity. The cell survival rate of the other groups reached 75% when the concentrations ranged from 25 to 200 mg/L, which resulted in no significant cytotoxicity. Therefore, in the subsequent tests, concentrations ranging from 25 to 200 mg/L were used because no cytotoxicity occurred at these doses.
CAA of RPHs
The determination of CAA in this experiment was directly determined without PBS washing. Each RPH group was added to the cells, and the cells were cultured for 1 h. The fluorescence was detected after ABAP was added. The EC50 values of the CAA are shown in . The EC50 values ranged from 55 to 190 µg/mL. Group 3 had the lowest EC50 value of 55 ± 3 µg/mL, and group 1 had the highest EC50 value of 190 ± 22 µg/mL.
FIGURE 3 Cellular antioxidant capacity EC50 values. Note: Histograms marked with different letters are significant at p < 0.05.
The cellular antioxidant capacities according to the CAA values are shown in . The CAA values ranged from 29.3 to 128 µmol QE/(g sample). The CAA value of group 3 was the highest, with a value of 128 ± 2 µmol QE/(g sample), and group 1 had the lowest CAA value, with a value of 29.3 ± 0.3 µmol QE/(g sample). There was a close relationship between the EC50 value and CAA value, as lower EC50 values corresponded to higher CAA values. The EC50 values of each group of RPHs were equal to the CAA values.
Amino Acid Analysis Results
RPH group 3 had the highest antioxidant capacities according to the ORAC, PSC, and CAA assays. Thus, an amino acid analysis of only group 3 was performed. The amino acid composition and content are shown in . The contents of Glu, Gly, Ala, Tyr, and Pro were higher than the contents of the other 13 amino acids in group 3. In addition, group 3 contained eight types of essential amino acids comprising 18.23% of the total content of amino acids. Therefore, group 3 had high nutritional value. Other studies have found that the Cys, Met, Tyr, Lys, Arg, Glu, Asp, Ser, Pro, Phe, Ala, and His amino acids have specific antioxidant activities, and the presence of these amino acids enhances the antioxidant properties of polypeptides.[Citation19,Citation20] The antioxidant activities of polypeptides are related to the composition, type, and hydrophobicity of the amino acids.[Citation21,Citation22]
TABLE 1 Amino acid compositions of group 3
Polypeptide Purified by RP–HPLC
Six main components were prepared by means of RP–HPLC, and the results of ORAC assay and PSC assay were showed in and . showed that peak 5 had the highest ORAC value of 1744.29 μmol TE/g, which was higher than the samples without separation by RP–HPLC. Peak 1, 2, and 6 also exhibited good antioxidant, but the values were less than those of samples treated without separation by RP–HPLC. suggested that peak 5 had the highest PSC value of 672.13 mg VC/100 g, which was greater than the corresponding samples without separation. Peak 5 was then analyzed by HPLC (), which revealed only one peak. LC–MS was employed to further analyze the primary structure of this peak .
FIGURE 4 The antioxidant activity of the groups separated by RP–HPLC; A: ORAC values of each group separated by RP–HPLC; B: PSC values of each group separated by RP–HPLC.
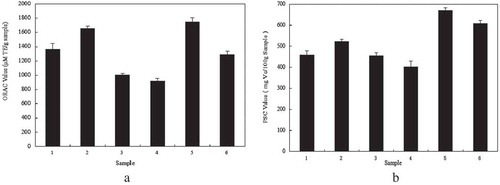
FIGURE 5 Separation of fraction 5 on RP–HPLC.
Primary Structure Analysis of Rapeseed Antioxidant Peptides
Determination of amino acid sequence of protein or polypeptides can provide important insight into the studies of structure-activity relationship (SAP). And the molecules can be identified accurately by mass-spectrometric technique. The main principle of MS analysis was based on the separation ion charge-to-mass ratio (m/z) after material were ionized, ESI–MS fit the analysis of strong and medium polarity substance. MS1 spectrum of group 5 obtained by ESI–MS which showed the parent ion was shown in . The m/z of parent ion with highest abundance ratio was 481.3, so the molecular weight of the target peptide was 481.3 Da. This parent ion was then analyzed by ESI–MS/MS ().
FIGURE 6 MS1 spectrum of group 5.
FIGURE 7 A: ESI–MS/MS spectrum of group 5 (m/z < 200); B: ESI–MS/MS spectrum of group 5 (m/z > 200).
As indicated by , the iminium ion with low mass to charge ratio (m/z < 200) proved the existence of Trp (b1: m/z is 187.2).The m/z value to 113 (b2-b1) indicated the presence of isomer Ile or Leu coupled with stronger signal a2 ion fragment (m/z: 272.2), which corresponded to b2-28, and caused by the CO group bombed down from side-chain radical of Ile or Leu. The m/z value to 164 (b3-b2) indicated the existence of Tyr, and the signal of parent ion (m/z = 481.2) corresponded to b3+OH. So the amino acid sequence of the peptide was Trp-Ile (Leu)-Tyr.
This antioxidant peptide was composed of three amino acids, and peptide with antioxidant activity was exposed by the hydrolysis of the peptide chain, which made small molecular peptides show better antioxidant activity than protein or polypeptides. Trp, Ile, or Leu, Tyr of this Sequence Trp-Ile (Leu)-Tyr are all hydrophobic amino acid. Some studies have reported that the existence of hydrophobic amino acids would enhanced their antioxidant capacity.[Citation23] A conjugated benzene ring may exist in the Tyr side chain of sequence, which would form a relative stable intermediates state after losing the proton. Phenolic hydroxyl group was prone to have dehydrogenation reaction. Some studies have found that reducing the Tyr of sequence could drop off oxidation resistance.[Citation24] At the same time, others have suggested that tripeptide with Tyr or Trp in C-terminal showed strong free radical scavenging activity.
CONCLUSIONS
This study utilized ORAC, PSC, and CAA assays to analyze the antioxidant capacity of each group of RPHs purified by Sephacryl S-100HR gel column chromatography, and the results showed that group 3 had the highest antioxidant activity. Then six peaks of group 3 obtained by RP–HPLC. Peak 5 had the highest ORAC and PSC value which showed better antioxidation property than group 3. Amino acid sequence of peak 5 determined by LC–MS and the primary structure of rapeseed antioxidant peptides were Trp-Ile (Leu)-Tyr.
FUNDING
This work has been supported by the the National Natural Science Foundation of China (No. 31571766), Natural Science Foundation of the Higher Education Institutions of Jiangsu Province, China (14KJB550004), Natural Science Foundation of Jiangsu Province, China (BK20141485), the prospective Industry-Academy-Research cooperation projects of the Jiangsu province China (BY2015010-01), National High Technology Research and Development Program of China (863 Program) (2013AA102207-2), National agricultural achievements transformation projects, China (2014GB2C100318), the National Science and Technology Pillar Program during the Twelfth Five-year Plan Period (No.2014BAD04B03), and the Priority Academic Program Development of Jiangsu Higher Education Institutions (PAPD).
Additional information
Funding
REFERENCES
- Murray, D. Rapeseed a Potential Global Source of High Quality Plant Protein. Asia Pacific Food Industry 2001, 4, 30–34.
- Berot, S.; Compont, J.P.; Larre, C.; Malabat, C.; Gueguen, J. Large Scale Purification of Rapeseed Proteins (Brassica Napus L). Journal of Chromatography B 2005, 818, 35–42.
- Adom, K.K.; Sorrells, M.E.; Liu, R.H. Phytochemical Profiles and Antioxidant Activity of Wheat Varieties. Journal of Agricultural and Food Chemistry 2003, 51, 7825–7834.
- Del Mar Yust, M.; Pedroche, J.; Meglas, C.; Giron-Calle, J.; Manuel, A.; Millan, F.; Vioque, J. Rapeseed Protein Hydrolysates: A Source of HIV Protease Peptide Inhibitors. Food Chemistry 2004, 87, 387–392.
- Yoshie-Stark, Y.; Wada, Y.; Schott, M.; Wasche, A. Functional and Bioactive Properties of Rapeseed Protein Concentrates and Sensory Analysis of Food Application with Rapeseed Protein Concentrates. LWT–Food Science and Technology 2006, 5, 503–512.
- Adom, K.K.; Liu, R.H. Rapid Peroxyl Radical Scavenging Capacity (PSC) Assay for Assessing Both Hydrophilic and Lipophilic Antioxidant. Journal of Agricultural and Food Chemistry 2005, 53, 6572–6580.
- Cumby, N.; Zhong, Y.; Naczk, M.; Shahidi, F. Antioxidant Activity and Water-Holding Capacity of Canola Protein Hydrolysates. Food Chemistry 2008, 109, 144–148.
- Wolf, K.L.; Kang, X.M.; He, X.J.; Dong, M.; Zhang, Q.; Liu, R.H. Cellular Antioxidant Activity of Common Fruits. Journal of Agricultural and Food Chemistry 2008, 56, 8418–8426.
- Zareen, S.; Ismail, I.S.; Shaari, K.; Yusof, K.N.; Akhtar, M.N. Quantitative HPLC Analysis of Benzene Derivatives of Melicope Ptelefolia Leaves. International Journal of Food Properties 2013, 16(8), 1830–1838.
- Zhang, Y.J.; Wang, J.; Li, L.; et al. Studies on Relationship Between Peak Capacity Column Length for Separation of Peptides by High Performance Liquid Chromatography. Chinese Journal of Chromatography 2004, 1, 24–26.
- Chakraborty, A.B.; Berger, S.J. Optimization of Reversed-Phase Peptide Liquid Chromatography Ultraviolet Mass Spectrometry Analyses Using An Automated Blending Methodology. Journal of Biomolecular Techniques 2005, 16, 327–335.
- Huseyin, S.; Emine, A.T.; Oktay, Y.; et al. Grayanotoxin-III Detection and Antioxidant Activity of Mad Honey. International Journal of Food Properties 2015, 18, 2665–2674.
- Huang, D.J.; Ou, B.X.; Hampsch-Woodill, M.; Flanagan, J.A.; Prior, R.L. High-Throughput Assay of Oxygen Radical Absorbance Capacity (ORAC) Using a Multichannel Liquid Handling System Coupled with a Microplate Fluorescence Reader in 96-Well Format. Journal of Agricultural and Food Chemistry 2002, 50, 4437–4444.
- Adom, K.K.; Liu, R.H. Antioxidant Activity of Grains. Journal of Agricultural and Food Chemistry 2002, 50, 6182–6187.
- Prior, R.L.; Hoang, H.; Gu, L.; Wu, X.; Bacchiocc, M.; Howard, L.; Hampsch-Woodill, M.; Huang, D.; Ou, B.; Jacob, R. Assays for Hydrophilic and Lipophilic Antioxidant Capacity (Oxygen Radical Absorbance Capacity (ORAC[FL]) of Plasma and Other Biological and FL Food Samples. Journal of Agricultural and Food Chemistry 2003, 51, 3273–3279.
- Prior, R.L.; Wu, X.; Schaich, K. Standardized Methods for the Determination of Antioxidant Capacity and Phenolics in Foods and Dietary Supplements. Journal of Agricultural and Food Chemistry 2005, 53, 4290–4302.
- Ray, P.D.; Huang, B.W.; Tsuji, Y. Reactive Oxygen Species (ROS) Homeostasis and Redox Regulation in Cellular Signaling. Cellular Signalling 2012, 24, 981–990.
- He, R.; Ju, X.R.; Yuan, J.; Wang, L.F.; Girgih, A.T.; Aluko, R.E. Antioxidant Activities of Rapeseed Peptides Produced by Solid State Fermentation. Food Research International 2012, 49, 432–438.
- Triantis, T.M.; Yannakopoulou, E.; Nikokavoura, A.; Dimotikali, D.; Papadopoulos, K. Chemiluminescent Studies on the Antioxidant Activity of Amino Acids. Analytic Chimica Acta 2007, 591, 106–111.
- Wang, W.Y.; De Mejia, E.G. A New Frontier in Soy Bioactive Peptides That May Prevent Age-Related Chronic Diseases. Comprehensive Reviews in Food Science and Food Safety 2005, 4, 63–68.
- Wang, J.S.; Zhao, M.M.; Zhao, Q.Z.; Jiang, Y.M. Antioxidant Properties of Papain Hydrolysates of Wheat Gluten in Different Oxidation Systems. Food Chemistry 2007, 101, 1658–1663.
- Guo, H.; Kouzuma, Y.; Yonekura, M. Structures and Properties of Antioxidant Peptides from Royal Jell Protein. Food Chemistry 2009, 113, 238–245.
- Iwaniak, A.; Minkiewicz, P. Proteins As the Source of Physiologically and Functionally Active Peptides. Acta Scientiarum Polonorum /Technologia Alimentaria 2007, 6(3), 5–15.
- Dvabs, A.; Migue, I.M.; Bartolom, B. Antioxidant Activity of Peptides Derived from Egg White Proteins by Enzymatic Hydrolysis. Journal of Food Protection 2004, 67, 1939–1944.