
 ?Mathematical formulae have been encoded as MathML and are displayed in this HTML version using MathJax in order to improve their display. Uncheck the box to turn MathJax off. This feature requires Javascript. Click on a formula to zoom.
Abstract
Several studies on predicting the viscosity of oils and their mixes are found in the literature. However, data on Amazonian oils are relatively scarce. This study aimed to measure the viscosity and the influence of temperature and of the fatty acid composition of three Amazonian vegetable oils (buriti, pataua, and Brazil nut), as well as their mixtures. Models were applied from the literature and a new equation was presented to predict viscosity. Among the models assessed to estimate the viscosity of the oils and their mixtures as a function of temperature, the Andrade, modified Andrade, and Arrhenius models had the best fits. The models by Grunberg-Nissan and Kendall and Monroe can be used to predict the viscosity of mixtures from their compositions. The equation presented to predict viscosity was shown to be appropriate with R2 values above 0.998 and error below 1.0723.
Keywords:
INTRODUCTION
Vegetable oils and their mixtures are important in human nutrition as a source of energy, essential fatty acids (FAs), and fat-soluble vitamins (A, D, E, and K) playing important functional and sensory roles.[Citation1,Citation2] Outside the realm of food manufacture, vegetable oils feature in a wide variety of industries ranging from production of paints, varnishes, lubricants, and toiletry products.[Citation3] Given their value for several food and non-food applications, vegetable oils are a highly desired commodity whose worldwide consumption has increased by about 42% during the period 2005 and 2006 to 2013 and 2014. According to the Organization for Economic Co-operation and Development/Food and Agriculture Organization (OECD/FAO), demand for vegetable oils will increase to 196.2 million tons in 2021 and 2022, which represents a 20% increase.[Citation4] The mixture of two or more oils may add technological and functional characteristics to the product obtained (color, melting point, fatty-acid profile, and oxidative stability) that make them more stable and more likely to be used industrially.
The Amazon region in Brazil has a great diversity of native oil plants. In the last few years, several Amazonian vegetable oils, some of which have potentially promising health and nutritional properties, have been studied. In particular, buriti, pataua, tucuma, Brazil nut, babassu, and inaja oils have significant nutritional value and are appreciated by the population of this region.[Citation5,Citation6]
Vegetable oils and vegetable oil mixtures are multicomponent systems containing different families of triacylglycerides (TAGs) in addition to a variety of minor compounds (tocopherols, tocotrienols, carotenoids, and phytosterols). The most important group of compounds is represented by TAGs, which are in chemical terms trihydric alcohols esterified with FAs.[Citation7–Citation10]
Several researchers have reported that the viscosity of vegetable oil has a direct relationship with some chemical characteristics of the lipids, such as the degree of unsaturation and the chain length of the FAs that constitute the TAGs.[Citation11–Citation13] In vegetable oils, viscosity increases with chain lengths of triglyceride FAs and decreases with unsaturation.[Citation14,Citation15] Studies have also been carried out on the effects of temperature on the viscosities of vegetable oils and vegetable oil blends.[Citation12,Citation16–Citation20] However, there is relatively little data on the rheological behavior of Amazonian vegetable oils and their mixtures in the literature reporting specifically on the dependence of viscosity on temperature and FA composition. Vegetable oil mixtures have been widely used since they allow a broader use in the industry because such mixtures change the physical properties (melting point, iodine level, peroxide level, consistency). Amazonian vegetable oils are extracted mainly by mechanical pressing of oil seeds using a filter press apparatus. The basic refining processes of crude vegetable oils involve degumming, bleaching, deacidification, and deodorization.
Estimating the viscosity of vegetable oils and their mixtures is useful in engineering applications related to proper unit design and operation, as well as to understand transport processes such as heat and mass transfer, separation processes, and reaction engineering.[Citation21,Citation22] On the other hand, viscosity is also an important factor that determines the overall quality and stability of a food system.[Citation23] This study describes the measurement of the viscosities of buriti oil, pataua oil, Brazil nut oil, and their mixtures as a function of temperature and FA composition. Empirical equations for predicting the viscosities of the test oils are also presented.
MATERIALS AND METHODS
Experimental Materials
Three edible vegetable oils (buriti, pataua, and Brazil nut) were purchased from a commercial source. The mixtures were prepared by weight using an analytical balance with precision of ±0.1 mg. The mixtures were then stirred at room temperature for 30 min to prepare the final mixture. All chemical reagents used in this study were analytical grade. The binary and ternary oil mixtures of pataua, Brazil nut, and buriti were designed according to .
TABLE 1 Compositional design of the mixtures
Rheological Measurement
The flow behaviors of vegetable oils and their mixtures were measured using a programmable rotational viscometer (Model DV-II+, Brookfield Engineering, Inc., Middleboro, USA), equipped with a DIN adapter which allows only 20 mL of oil to be used in each analysis. The viscometer was operated with a ULA-DIN-86 spindle. The shear rate range used was 10–230 s–1. Temperature was controlled using a water bath with precision of ±0.5°C. Analysis was done in a temperature range of 15–80°C. Replicate viscosity tests showed an average precision of ±1.64% for the eight evaluated temperatures.
FA Analysis
The FA composition was determined by conversion to fatty acid in methyl esters (FAMEs)[Citation6] and detected using a gas chromatograph (Varian model CP 3380, USA) equipped with a flame ionization detector and with a CP-Sil 88 capillary column (length 60 m, internal diameter 0.25 mm, film thickness 0.25 μm; Varian Inc., USA). Operating conditions were: helium as carrier gas at flow rate of 0.9 mL/min, FID detector at 280°C, injector (split ratio 1:100) at 250°C, and injection volume of 1 μL. The temperature programmed for the column was: 175°C for 8 min, followed by 2.0°C/min until 180°C for 28 min, and then 2.0°C/min until 250°C for 10 min. The individual FA peaks were identified by comparing retention times with those of known mixtures of standard FA (Nu-Check-Prep, Inc., USA) run under the same operating conditions. Retention time and area of each peak were computed using the Varian Star 3.4.1 software. The results were expressed as relative percentages of total FA.
Rheology Model
In order to better understand the rheological behavior of the oils and mixtures, empirical models were applied to describe the relation between viscosity (η), temperature (T), and composition of mixtures (xi; ). The values of model constants were calculated by non-linear regression analysis using the software OriginPro 8 SRO v8.0724 (B724). The performance of the models was evaluated using various statistical parameters such as Chi-square (χ2), root mean square error (RMSE), and coefficient of determination (R2). In the equations in , A and B are constants, Ea is the activation energy (kJ/kg), R is the universal gas constant (8.314 kJ/kg mol K), T is absolute temperature (K), Tref is the reference temperature of 273.15 K, η is dynamic viscosity (mPa.s), ηi is the dynamic viscosity of an individual compound, ηm is the dynamic viscosity of the mixture, and xi is the mass fraction.
TABLE 2 Mathematical models used to correlate viscosity data
RESULTS AND DISCUSSION
shows a typical relationship between shear stress and the shear rate for the three vegetable oils (buriti, pataua, and Brazil nut) at various temperatures. Clearly, the vegetable oils exhibit a linear relationship between shear stress and shear rate, i.e., Newtonian flow behavior. Consequently, their viscosities at each temperature were obtained from the slope of the fit of experimental shear stress versus shear rate data to Newton’s viscosity equation (Eq. 8). Similar behaviors were exhibited by the oil mixtures.
FIGURE 1 Relationship between shear stress and shear rate for the buriti oil at various temperatures.
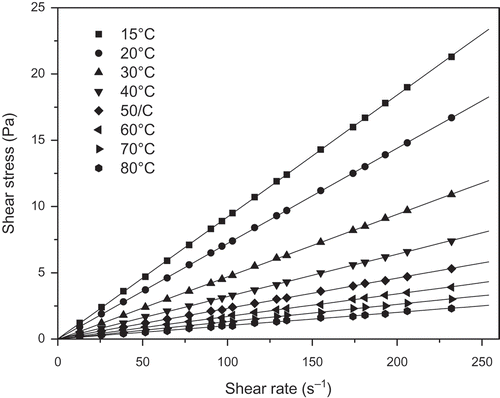
FIGURE 2 Relationship between shear stress and shear rate for the pataua oil at various temperatures.
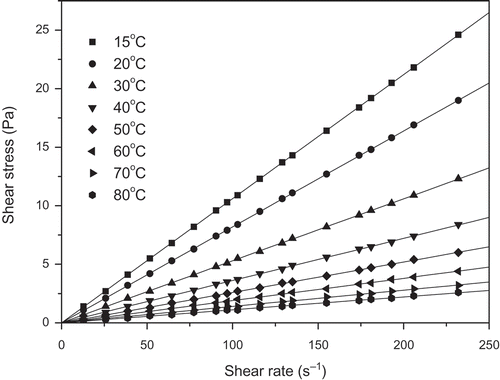
FIGURE 3 Relationship between shear stress and shear rate for the Brazil nut oil at various temperatures.
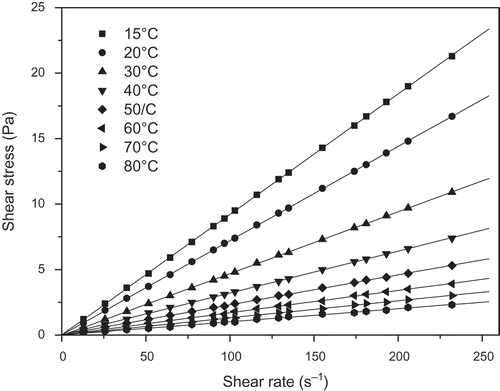
where τ is shear stress (mPa) and γ is the shear rate (s–1). The values of the estimated viscosities are given in . In each case, the regression coefficient (R2) obtained by fitting Eq. (8) to the experimentally obtained shear stress versus shear rate data was greater than 0.999. As expected, the viscosities of the vegetable oils and their mixtures show the same pattern, which was a non-linear behavior decreasing as temperature increased (). The higher temperature tends to increase molecular interchange (motion) and reduce attractive forces between molecules. However, in liquids, the reduction in attractive forces is much more significant than increases in molecular interchange and, therefore, viscosity decreases as temperature increases. This behavior was also verified by previous researches.[Citation17,Citation24,Citation25] It is also found that the percentage variation of viscosities (between 15 and 80°C) of the oils and their mixtures was above 89%.
TABLE 3 Viscositiesa (mPa.s) of vegetable oils at different temperatures
Among the five models applied to describe the relation between viscosity (η) and temperature (T), the relationships (1), (2), and (3) showed good fits between model and experimental data, with the coefficient of determination (R2) greater than 0.99 (0.9929 < R2 < 0.9983) and lower values of RMSE in the range 0.0891–0.1880 and χ2 in the range 0.0013–0.0059 for each experimental condition investigated (). The calculated values of the activation energy of the vegetable oils and their mixtures ranged from 30.2 to 28.7 kJ/mol (Arrhenius model). Among the oils, the highest activation energy value was observed in buriti oil (30.2 kJ/mol), followed by pataua oil and Brazil nut oil at 29.4 and 28.7 kJ/mol, respectively. Similar results were obtained[Citation25] when studying the chemical and rheological characterization of some vegetable oils.
TABLE 4 Values of constants A (a(mPa.s) ×106) and B obtained from the five models applied to the various samples of vegetable oils
The activation energy of flow is related to the flexibility of the molecular chains and the interactions between molecules and indicates the energy barrier that must be overcome before the elementary flow process can occur.[Citation26] Thus, the different values of Ea obtained for the three different vegetable oils confirmed that buriti oil had the highest cohesive character. This trend indicates that the viscosity of buriti oil is the most sensitive to the influence of temperature. Regarding the mixtures, the one with the highest sensitivity to temperature was the ternary mixture with 66% buriti oil and 16.67% of both pataua and Brazil nut oil (mixture 6). For engineering applications, such information is very useful.
Buriti oil and mixture 6 also stand out in the model by Andrade for having the highest values of parameter B compared to oils from pataua, Brazil nut, and the other mixes. This parameter is related to the free activation energy of viscous flow (∆Gvis). The value of this energy depends on interactive forces between the molecules in a fluid, therefore, the more viscous a fluid, the higher the ∆Gvis value and, consequently, the higher the B value.
With respect to the relation between viscosity (η) and composition of mixtures (xi), the relationships (6) and (7) fitted the experimental data very well with R2 values equal to or higher than 0.999, and χ2 and RMSE values equal to or lower than 0.4527 and 0.5827, respectively, (). Study predicting the viscosity of mixtures of pure FAMEs using the model by Grunberg-Nissan with some modifications, found good fits with errors (average absolute deviation [AAD%]) below 2.5%.[Citation27] Another study determined[Citation28] when assessing viscosity and rheological behavior of castor-canola oil mixture, observed fits to the experimental data similar to those in the present study with error of 0.56%. In another work,[Citation29] when studying the modeling of the viscosity of canola oil and its mixtures with stearin, found values of 7.06% (average absolute relative deviation [AARD]).
TABLE 5 Viscosity values (mPa.s) of the mixtures predicted by Equations 6 and 7 and statistical parameters
Regarding the model by Kendall and Monroe, some authors,[Citation30] when assessing the viscosity of oil mixtures, did not find good fits (R2 = 0.8922 and mean absolute error of 57.72%. The percentage values of monounsaturated fatty acids (MUFA), polyunsaturated fatty acids (PUFA), and saturated and unsaturated FA in the samples of vegetable oil and their mixtures are given in . Among the oils, the one from Brazil nut stands out for its higher PUFA content (38%) than those from buriti and pataua (2.25 and 4.03%, respectively). These values are similar to those listed for these vegetable oils by authors.[Citation5,Citation31–Citation34] This difference in PUFA content allows different mixtures to be obtained regarding the percentage values of PUFA (ranging from 2.61 to 21.34%) and MUFA (21.48 to 78.26%), which suggests different applications. Since FAs contribute with about 95% of the total weight of the triacylglycerol molecule and since they are the reactive portion of the molecule, they significantly impact the chemical and physical properties and determine the application of vegetable oils.[Citation11]
TABLE 6 FA composition (percentage by weight of total FA) of the vegetable oil samples
A mathematical relationship (Eq. [9]) using statistical software (OriginPro 8) was developed to estimate viscosity of oils and their mixtures as a function of temperature and mass fraction of PUFA or MUFA.
where R is the universal gas constant (8.314 kJ/kg mol K) and T is the absolute temperature (K). The value of β (mass fraction of PUFA or mass fraction of MUFA) are obtained from and the values of constants P1, P2, and P3 are given in for the vegetable oils and their mixtures. Parameters P3 and P2 are related to the temperature of the oils and their mixtures, while parameter P1 is related to the mass fractions of MUFAs or PUFAs. The values of P1 and P2, when β equals PUFAs, were 3.36 and 1.9 times higher than the P1 and P2 values using β equal to MUFAs, respectively, which confirms the impact of unsaturation on oil viscosity. The high R2 values obtained for both fractions () indicated that the viscosity of vegetable oils and their mixtures can be predicted from the amount of PUFAs or MUFAs present, confirming the results obtained by other authors,[Citation12] who found a strong correlation between the FA composition and the viscosity of several oils (canola, corn, and olive, among others). Another study[Citation1] found results that suggest the influence of mass fractions of MUFAs and PUFAs on the melting characteristics of 12 vegetable oils.
TABLE 7 Values of constants (Eq. 9) that can be used to predict vegetable oil viscosity based on either monounsaturated or polyunsaturated FA
Another study,[Citation17] when estimating the viscosity of several oils as a function of temperature and mass fractions of MUFAs and PUFAs, also found satisfactory results with R2 values above 0.99. This information can be used to select and design equipment and unit operations, as well as to understand transport processes and quality control using vegetable oils.
CONCLUSION
The oils studied had Newtonian behavior. Among the five models assessed to estimate the viscosity of the oils and their mixtures as a function of the temperature, the Andrade, modified Andrade, and Arrhenius models had the best fits to the experimental data with RMSE values below 0.188 and R2 above 0.9923. In these models, both buriti oil and the ternary mixture 6 stood out with a higher cohesive character (higher Ea and B values), which indicates a higher sensitivity of viscosity to temperature variation. The models by Grunberg-Nissan and Kendall and Monroe can be used to predict the viscosity of mixtures from their compositions since they yielded low RMSE values (<0.58) and high R2 values (˃0.999). The equation presented in this study to predict the viscosity of oils and their mixtures as a function of the temperature and of the mass fractions of MUFAs and PUFAs was shown to be appropriate with R2 values above 0.998 and errors below 1.0723. Thus, the present study showed the viability of predicting the viscosity of these Amazonian oils and of their mixtures to enable equipment optimization and possible industrial processes so that these regional oils can be more widely explored.
FUNDING
The authors acknowledge CAPES and CNPq for granting scholarships and PROPES/UFPA for financial support of this research.
Additional information
Funding
REFERENCES
- Fasina, O.O.; Craig-Schmidt, M.; Colley, Z.; Hallman, H. Predicting Melting Characteristics of Vegetable Oils From Fatty Acid Composition. LWT–Food Science and Technology 2008, 41, 1501–1505.
- Odunaike, K.; Akinyemi, L.P.; Laoye, J.A.; Williams, A.O.; Ogunmoroti, O.T. Estimation of the Physical Characteristics of Some Locally and Imported Edible Vegetable Oils Samples in Nigeria. International Journal of Engineering and Applied Sciences 2003, 4, 6.
- Igwe, O.I. The Effects of Temperature on the Viscosity of Vegetable Oils in Solution. Industrial Crops and Products 2004, 19(2), 185–190.
- OECD/FAO. OECD-FAO Agricultural Outlook: 2013–2022. Organization for Economic Co-Operation and Development (OECD) e The Food and Agriculture Organization (FAO) of The United Nations. 2014, Retrieved from http://stats.oecd.org/viewhtml.aspx?QueryId=48184&vh=0000&vf=0&l&il=&lang=en
- Darnet, S.H.; Silva, L.H.M.; Rodrigues, A.M.C.; Lins, R.T. Nutritional Composition, Fatty Acid, and Tocopherol Contents of Buriti (Mauritia Flexuosa) and Patawa (Oenocarpus Bataua) Fruit Pulp from the Amazon Region. Food Science and Technology, Campinas 2011, 31(2), 488–491.
- Rodrigues, A.M.C.; Darnet, S.; Silva, L.H.M. Fatty Acid Profiles and Tocopherol Contents of Buriti (Mauritia Flexuosa), Patawa (Oenocarpus Bataua), Tucuma (Astrocaryum Vulgare), Mari (Poraqueiba Paraensis), and Inaja (Maximiliana Maripa) Fruits. Journal Brazilian Chemists Society 2010, 21(10), 2000–2004.
- Galeano-Díaz, T.; Acedo-Valenzuela, M.I.; Silva-Rodríguez, A. Determination of Tocopherols in Vegetable Oil Samples by Non-Aqueous Capillary Electrophoresis (NACE) with Fluorimetric Detection. Journal of Food Composition and Analysis 2012, 25, 24–30.
- Pérez, M.D.; Alvarez, S.C.; Charó, A.M.; Dibildox, A.E.; Toro,V.J.F. The Cooling Rate Effect on the Microstructure and Rheological Properties of Blends of Cocoa Butter with Vegetable Oils. Food Research International 2007, 40, 47–62.
- Ruth, S.M.V.; Villegas, B.; Akkermans, W.; Rozijn, M.; H. van der Kamp, H.V.D.; Koot, A. Prediction of the Identity of Fats and Oils by Their Fatty Acid, Triacylglycerol, and Volatile Compositions Using PLS-DA. Food Chemistry 2010, 118, 948–955.
- Yang, M.; Zheng, C.; Zhou, Q.; Huang, F.; Liu, C.; Wang, H. Minor Components and Oxidative Stability of Cold-Pressed Oil from Rapeseed Cultivars in China. Journal of Food Composition and Analysis 2013, 29, 1–9.
- Da Silva, R.C.S.; Soares, D.F.; Lourenço, M.B.; Soares, F.A.S.M.; Silva, K.G.; Gonçalves, M.I.A.; Gioielli, L.A. Structured Lipids Obtained by Chemical Interesterification of Olive Oil and Palm Stearin. LWT–Food Science and Technology 2010, 43, 752–758.
- Kim, J.; Kim, D.N.; Lee, S.H.; Yoo, S.; Lee, S. Correlation of Fatty Acid Composition of Vegetable Oils with Rheological Behavior and Oil Uptake. Food Chemistry 2010, 118, 398–402.
- Sidique, B.M.; Ahmad, A.; Ibrahim, M.H.; Hena, S.; Rrafatullahd, M.; Mohd Omar, A.K. Physico-Chemical Properties of Blends of Palm Olein with Other Vegetable Oils. Rev. Grasas y Aceites 2010, 61(4), 423–429.
- Geller, P.D.; Goodrum, J. Rheology of Vegetable Oil Analogs and Triglycerides. Journal American Oil Chemists’ Society 2000, 77(2), 111–114.
- Santos, J.C.O.; Santos, I.M.G.; Souza, A.G. Effect of Heating and Cooling on Rheological Parameters of Edible Vegetable Oils. Journal of Food Engineering 2005, 67, 401–405.
- Esteban, B.; Riba, J.R.; Baquero, G.; Rius, A.; Puig, R. Temperature Dependence of Density and Viscosity of Vegetable Oils. Biomass and Bioenergy 2012, 42, 164–171.
- Fasina, O.O.; Hallman, H.; Craig-Schmidt, M.; Clements, C. Predicting Temperature-Dependence Viscosity of Vegetable Oils from Fatty Acid Composition. Journal American Oil Chemists’ Society 2006, 83, 899–903.
- Kibbey, T.C.G.; Chen, L.; Do, L.D.; Sabatini, D.A. Predicting the Temperature-Dependent Viscosity of Vegetable Oil/Diesel Reverse Microemulsion Fuels. Fuel 2014, 116, 432–437.
- Lioumbas, J.S.; Ampatzidis, C.; Karapantsios, T.D. Effect of Potato Deep-Fat Frying Conditions on Temperature Dependence of Olive Oil and Palm Oil Viscosity. Journal of Food Engineering 2012, 113, 217–225.
- Yilmaz, N. Temperature-Dependent Viscosity Correlations of Vegetable Oils And Biofuel-Diesel Mixtures. Biomass and Bioenergy 2011, 35, 2936–2938.
- Fang, S.; He, C.H. A New One Parameter Viscosity Model for Binary Mixtures. American Institute of Chemical Engineers Journal 2011, 57, 2.
- Neelamegam, P.; Krishnaraj, S. Estimation of Liquid Viscosities of Oils Using Associative Neural Networks. Indian Journal of Chemical Technology 2011, 18, 463–468.
- Valeri, D.; Meirelles, A.J.A. Viscosities of Fatty Acids, Triglycerides, and Their Binary Mixtures. Journal American Oil Chemists’ Society 1997, 74, 1221–1226.
- Ceriani, R.; Paiva, F.R.; Gonçalves, C.B.; Batista, E.A.C.; Meirelles, A.J.A. Densities and Viscosities of Vegetable Oils of Nutritional Value. Journal Chemical Engineering 2008, 53, 1846–1853.
- Blayo, A.; Gandini, A.; Nest, J.F.L. Chemical and Rheological Characterizations of Some Vegetable Oils Derivatives Commonly Used in Printing Inks. Industrial Crops and Products 2001, 14, 155–167.
- Sathivel, S.; Huang, J.; Prinyawiwatkul, W. Thermal Properties and Applications of the Arrhenius Equation for Evaluating Viscosity and Oxidation Rates of Unrefined Pollock Oil. Journal of Food Engineering 2008, 84, 187–193.
- Yuan, W.; Hansen, A.C.; Zhang, Q. Predicting the Temperature Dependent Viscosity of Biodiesel Fuels. Fuel 2009, 88, 1120–1126.
- Mirzayi, B.; Heydari, A.; Noori, L.; Arjomand, R. Viscosity and Rheological Behavior of Castor–Canola Mixture. European Journal Lipid Science Technology 2011, 113, 1026–1030.
- Jenab, E.; Temelli, F. Viscosity Measurement and Modeling of Canola Oil and Its Blend with Canola Stearin in Equilibrium with High Pressure Carbon Dioxide. The Journal of Supercritical Fluids 2011, 58, 7–14.
- Gao, Y.; Li, K. New Models for Calculating the Viscosity of Mixed Oil. Fuel 2012, 95, 431–437.
- Hernandez, P.B.N.; Fregapane, G.; Moya, M.D.S. Bioactive Compounds, Volatiles, and Antioxidant Activity of Virgin Seje Oils (Jessenia Bataua) from the Amazonas. Journal of Food Lipids 2009, 16, 629–644.
- Ryan, E.; Galvin, K.; O’Connor, P.; Maguire, A.R.; O’Brien, N.M. Fatty Acid Profile, Tocopherol, Squalene, and Phytosterol Content of Brazil, Pecan, Pine, Pistachio, and Cashew Nuts. International Journal of Food Sciences and Nutrition 2006, 57(3/4), 219–228.
- Santos, O.V.; Corrêa, N.C.F.; Carvalho Jr., R.N.; Costa, C.E.F.; Lannes, S.C.S. Yield, Nutritional Quality, and Thermal-Oxidative Stability of Brazil Nut Oil (Bertolletia Excelsa H.B.K) Obtained by Supercritical Extraction. Journal of Food Engineering 2013, 117, 499–504.
- Yang, J. Brazil Nuts and Associated Health Benefits: A Review. LWT–Food Science and Technology 2009, 42, 1573–1580.
- Tate, R.E.; Watts, K.C.; Allen, C.A.; Wilkie, K.I. The Viscosities of Three Biodiesel Fuels at Temperatures up to 300ºC. Fuel 2006, 85, 1010–1015.
- Goodrum, Y.W.; Eiteman, M.A. Physical Properties of Low Molecular Weight Triglycerides for the Development of Biodiesel Fuel Models. Bioresource Biotechnology 1996, 56, 55–60.
- Freitas, S.V.D.; Pratas, M.J.; Ceriani, R.; Lima, A.S.; Coutinho, J.A.P. Evaluation of Predictive Models for the Viscosity of Biodiesel. Energy Fuels 2011, 25, 352–358.