
Abstract
Pickled wax gourd is a traditional fermented vegetable product popular in Zhejiang province, eastern China; however, information on their quality is quite limited. In the present study, we investigated the quality of pickled wax gourd at different processing phases using nuclear magnetic resonance, principal component analysis, and orthogonal partial least squares-discriminant analysis. According to the spectra of 1H NMR, 36 kinds of metabolites were found at the 20th day of fermentation. Principal component analysis score plot showed that diverse marker metabolites occurred in all designated sampling points (every other 5 days), apart from the samples between the 10th day and 15th day of fermentation. Symbolic metabolites at the first 5 days were L-rhamnose, lactate, fatty acid, arginine, N-acetylglutamate, succinate, phosphorylcholine, glutamate, ornithine, lysine, and β-glucose. Lactate, succinate, glycine, proline, and choline were detected at the following period from the 5th to the 10th day of fermentation. Lactate, succinate, glycine, mannitol, choline, and α-ketoglutaric acid were the main metabolites on the 15th and 20th day. The diversity of metabolites fits with the microbial species structure in different pickling periods. This method was proved to be effective for monitoring the pickling process in real time.
Introduction
Pickled wax gourd with special flavor is very popular in Zhejiang province, Eastern China. Wax gourd is usually preserved by salt pickling due to its high moisture content and rich nutrient components with low fat.[Citation1,Citation2] Pickling facilitates the development of flavor in food and the enhancement of food quality and safety due to the formation of organic acids, microbial diversity, and lactic acid bacteria fermentation.[Citation3–Citation5] However, limited information on characteristic compounds formed during pickling made it difficult to assess the quality of this product and find alternatives for this traditional vegetable product.
In our previous study, microbial community diversity and changes of organic acids in pickled wax gourd were investigated through 16SrRNA and RT-qPCR technology combined with high-performance liquid chromatography (HPLC) analysis method.[Citation6] Jung et al.[Citation7] also revealed the metabolic potential of bacterial community of Kimchi by metagenomic analysis. Metabolomic studies have been applied in food science with the aim to determine geographical origin and particular organoleptic characteristics of varied products, such as potato, watermelon, wheat, rice, and green tea,[Citation8] as well as the characterization and quality evaluation of special species.[Citation9–Citation12] Metabolomics analysis of clinically relevant bacteria can also be performed in combination with HPLC or gas chromatography–mass spectrometry (GC–MS).[Citation13,Citation14] Ye et al.[Citation15] also performed a nutrients and quality assessment of crab paste by Citation1HNMR spectroscopy and multivariate data analysis. The data of these methods are all been analyzed using multivariate statistical analysis method with principal component analysis (PCA) and partial least squares/orthogonal projection to latent structures (PLS/OPLS).[Citation16,Citation17] In the present study, we identified the corresponding metabolites produced by microorganisms during the pickling process of wax gourd, which affected the flavor and nutrition of final products, by using nuclear magnetic resonance (NMR) and PCA analysis methods, and these methods were proven to be effective for monitoring the pickling process of wax gourd in real time.
Materials and methods
Materials
Fresh black wax gourds were purchased from farmers market in Ningbo, China. They were cleaned, cut, and cooked in boiling water for about 20 min. The cooked wax gourds were then cooled in cold water and pickled in salt solution (5% w/w). The pickled wax gourd was left to ferment for at least 20 days. The fermented samples (50 mL brine) were collected from the center of the pickling jar on days 0, 5, 10, 15, and 20, respectively. The collected brine was centrifuged at 5000 × g for 10 min, and the obtained supernatant was washed twice with distilled water. The supernatant was then concentrated using rotary evaporator and vacuum freeze-dried to obtain a solid state sample.
Extraction for NMR Analysis
For the dissolution of metabolites, 400 μL of MeOD, 500 μL of 0.2 M (pH 7) sodium phosphate buffer (dissolved in D2O, 99.9%), and 100 μL of 0.5 mM sodium 2,2-dimethyl-2-silapentane-5-sulfonate (DSS) dissolved in D2O were added to 80 mg of the freeze-dried brine. The solution was vibrated for 2 min, and sonicated for 40 min at 45°C. The dissolved samples was centrifuged at 9475 × g for 10 min. Six hundred microliters supernatants were transferred into 5 mm NMR tubes for the next analysis.
Detection of Amino Acids (AAs) Content
Pickled brine (1.0 mL) were collected and diluted with water to 10 mL. Five hundred microliters of the samples were mixed with isothiocyanate phenyl acetonitrile (250 μL) and triethylamine-acetonitrile (250 μL), then stored at room temperature for 1 h. Following that, acetic acid (50 μL) was added to the solution. One milliliter of hexane was added to the brine after derivatization and mixed with an oscillator for 1 min. After phase separation, the lower solution was obtained with a syringe and filtered using 0.22 μm microporous membrane filtration for HPLC.
AA concentrations were measured by HPLC methods. The sample was injected into an Agilent 1100 series HPLC system. An Agilent ChemStation was used for instrument control and data acquisition. The separation was completed on a Hypersil ODS column (4.6 mm × 250 mm, 5 μm). The temperature of column oven was set at 40°C. Solvent A was prepared using the following method: 8 g of sodium acetate and 225 μL of triethylamine were dissolved in ultrapure water, 5 mL tetrahydrofuran was added to the solution, and the pH value was adjusted to 7.2 with 5% acetic acid. Solvent B was prepared by the following method: 12 g of sodium acetate was dissolved in 400 mL ultrapure water, the pH value was adjusted to 7.2 with 5% acetic acid, and then 800 mL acetonitrile and methanol (1:1) was added to the solution. Elution was performed with a linear gradient as shown in . The flow rate was 1.0 mL/min. The diode array detector (DAD) was set at 338 nm, and the injection volume was 20 μL. The concentrations of AAs were calculated according to standard curves of each AA. All chemicals involved were from the Sinopharm Chemical Reagent Co., Ltd., Shanghai, China. The analysis was conducted in triplicate.
TABLE 1 Scheme of elution gradient for HPLC-DAD analysis of amino acids
Detection of Soluble Sugars Content
Pickled brine samples were prepared according to the detection of AAs contents, and soluble sugars contents of the samples was measured by HPLC methods. The separation was achieved on a NH2 column (4.6 × 250 mm, 5 μm, Agilent). The mobile phase was consisted of acetonitrile (A) and water (B), and the ratio of A to B was 77:23. The injection volume was 20 μL. The temperature of column oven was set at 40℃, and the flow rate was set at 1.2 mL/min. The concentrations of soluble sugars were calculated according to standard curves of each monosaccharide.
Detection of Metabolic by 1H-NMR Analysis
1H-NMR spectra of the pickled wax gourd metabolites were collected on a Bruker AV 400 NMR spectrometer at 400.18 MHz held at 25°C as described previously.[Citation18] For each sample, 32 transients were collected into 64k data points using a spectral width of 6410.3 Hz with a relaxation delay of 2.0 s, an acquisition time of 4.00 s. All NMR spectral were phased and baseline-corrected using the MestReNova 6.1.1. Regions corresponding to water and methyl alcohol was excluded (4.76–5.14 mg/L, 3.28–3.32 mg/L, respectively), and the remaining spectral regions were divided into 0.04 mg/L bins. The spectra were normalized to the total spectral area and export in ASCII format.[Citation7] The ASCII files were imported into SIMCA-P+. Chemical shift, correlation, and loading value obtained from SIMCA-P+ were imported into MATLAB 7.0. One way analysis of variance (ANOVA) was performed to distinguish the significance of different sampling point in significant (p < 0.05).
Statistical Analysis
The data obtained were analyzed using SPSS version 16.0 (SPSS Inc., Chicago, IL, USA). Any significant difference was determined by one-way ANOVA followed by the Tukey test for multiple comparisons considering difference statistically at p < 0.05.
Results and discussion
Detection of Metabolites by 1H-NMR Analysis
A typical HPLC-DAD chromatogram of different monosaccharide standards was shown in . showed HPLC chromatogram of soluble sugars in different fermentation periods of pickled wax gourd. Therefore, peak identities in the pickled wax gourd were assigned based on comparison of peak retention times (tR) of the authentic standards. HPLC chromatogram of AAs in different fermentation periods of pickled wax gourd was shown in , and peak identities were also assigned based on comparison of peak retention times (tR) of the authentic standards (data not shown). 1H-NMR spectrum of metabolites during the initial fermentation period of the pickled wax gourd (Day 0 fermentation) was showed in . Different kinds of metabolites were observed at five different fermentation phases (0, 5, 10, 15, and 20). Thirty-six kinds of metabolites were found during the entire pickling process. Four kinds of metabolites were not found on day 0, which were fatty acids (found on the 5th day of fermentation), proline (found on the 5th and 20th day of fermentation), acetate (found on the 15th and 20th day of fermentation), and α-Ketoglutaric acid (found on the 20th day of fermentation). All metabolites formed during the five sampling points detected by 1H-NMR were shown in .
TABLE 2 Metabolites of pickled wax gourd by the 1-D 400 MHz 1H-NMR spectra
FIGURE 1 A typical HPLC-DAD chromatogram of different monosaccharide standards.
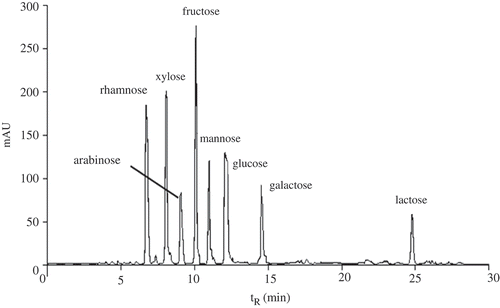
FIGURE 2 HPLC chromatogram of soluble sugars in different fermentation periods of pickled wax gourd (A–E: pickled for 0, 5, 10, 15, and 20 days, respectively).
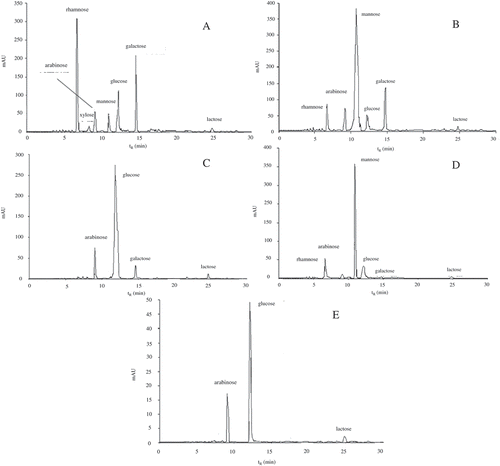
FIGURE 3 HPLC chromatogram of amino acids in different fermentation periods of pickled wax gourd (A–E: pickled for 0, 5, 10, 15, and 20 days, respectively).
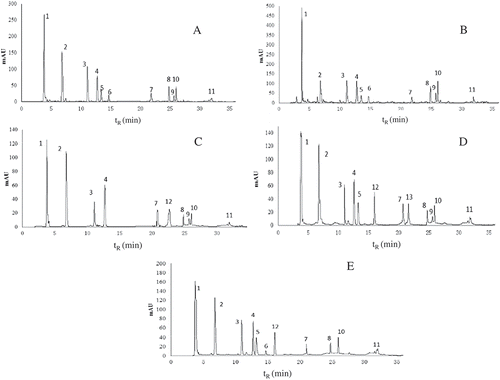
FIGURE 4 Spectrum of metabolites of pickled for 0 day and 20th day wax gourd (1: L-rhamnose; 2: Glutamate; 3: Methionine; 4: N-acetylglutamate; 5: Succinate; 6: γ-aminobutyrate; 7: Aspartate; 8: Choline-O-sulfate; 9: Phosphorylcholine; 10: Choline; 11: Betaine; 12: D-galactose; 13: Mannose; 14: Tryptophan; 15: Mannitol; 16: Ornithine; 17: Arabinose; 18: Lysine; 19: α-Glucose; 20: Glycine; 21: Threonine; 22: Arginine; 23: Xylose; 24: Ascorbic acid; 25: Citric acid; 26: Succinic acid; 27: Aspartic acid; 28: Lactate; 29: Isoleucine; 30: Valine; 31: Lactose; 32: β-Glucose).
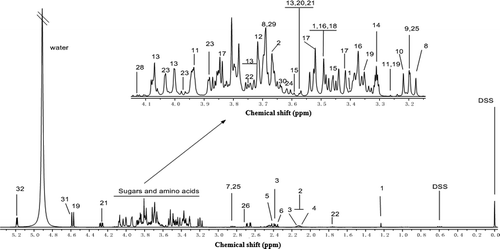
Wax gourd (Benincasahispida) was found to be rich in the following compounds, namely AAs, sugars, organic acids, and phenolic compounds.[Citation19] These compounds can be identified on the 1H-NMR spectrum of metabolites from the original pickled wax gourd sample (). On day 0, some AAs were detected in the pickled wax gourd including methionine, glutamate, tryptophan, γ-aminobutyrate, aspartic acid, ornithine, lysine, glycine, threonine, arginine, isoleucine, and valine. Some of these AAs were used as nitrogen sources for initial growth of different species in pickled wax gourd and to form new compounds such as sugars, alcohols, and organic acids in wax gourd (). The results obtained by principal components analysis can be well explained by the microbial community structure and its changes during wax gourd fermentation. In our previous study,[Citation6] the dominated microbial species were found in different phase of pickling process, including the Acinetobacter spp., Weissella spp., and Lactobacillus spp.[Citation6,Citation20] Acinetobacter spp. were the dominant species at the beginning of wax gourd pickling, then changed to Weissella spp. at the subsequent 5 to 15 days fermentation and W. paramesenteroides appeared as the predominant bacteria at the last phase after the 15th day fermentation. The Lactobacillus spp. were detected on the 10th day of fermentation, which is a kind of important bacteria involved in many Chinese traditional fermented foods, which improved the food quality and safety.[Citation3] The microbial species are associated with the quality change in the product.[Citation21,Citation22] The great variation of class and contents of nutrients in pickled samples occurred during the early phase of wax gourd fermentation within 5 days were caused by the growth of bacteria and consumed a great deal of nutrient composition.[Citation6] The metabolites remained relatively constant during the middle stage of the pickling process from the 10th day to the 15th day because of the stable environmental condition. The symbolic metabolites changed extensively at the last stage after 15 days of fermentation because the variation of microbial species and populations as well as the consumption of nutrients.
PCA and Orthogonal Partial Least Squares-Discriminant Analysis (OPLS-DA) Analysis
1H-NMR spectral data were exported into ASCII format by MestReNova 6.1.1 and analyzed using SIMCA-P+. PCA calculated from all detected metabolites could clearly divide into four pieces of samples obtained from the five sampling points, as shown in the 2D plot of the first two principal components (). There is no obvious difference in the metabolites of the pickled wax gourd samples on the 10th and 15th day of fermentation. However, the significant difference (p < 0.05) of the adjacent samples was found in other pickled phase. Furthermore, detection of symbolic metabolites was also performed by OPLS-DA method combined with the 1H-NMR spectral data sets out from each sampling point of pickled wax gourd (). We found that the differences of the adjacent points between the 0th and 5th day, the 5th and 10th day, and 15th and 20th day, respectively, according to the score plots (, , and ), with a reliable Q2 values (>0.4). However, a significant difference of symbolic metabolites was not found by the supervised pattern (OPLS-DA) between two points of the 10th and 15th day of fermentation. We, therefore, concluded that the changes of components are not obvious in this period of 10 day and 15 day fermentation because the growth of each species in microbial community in this phase are stable,[Citation6] and the metabolites of microorganism’s activity remained relatively constant in this period.
FIGURE 5 PCA plots of 1HNMR spectra from pickled wax gourd at 0, 5, 10, 15, and 20 day fermentation.
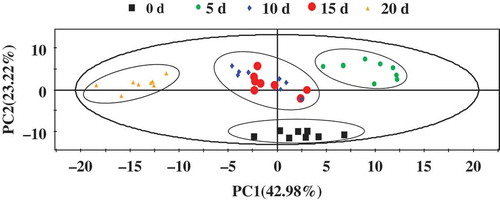
FIGURE 6 OPLS-DA plots of 1H-NMR spectra from adjacent pickled days (A), (C), and (E) and corresponding coefficient plots (B), (D), and (F). The significantly different metabolites between the adjacent pickled days were indicated with color. Key: (1) L-rhamnose; (2) Lactate; (3) Fatty acids; (4) Arginine; (5) N-acetylglutamate; (6) Succinate; (7) Phosphorylcholine; (8) Methionine; (9) Ornithine; (10) Lysine; (11) β-Glucose; (12) Glycine; (13) Choline; (14) Proline; (15) Acetate; (16) Mannitol; (17) α-Ketoglutaric acid.
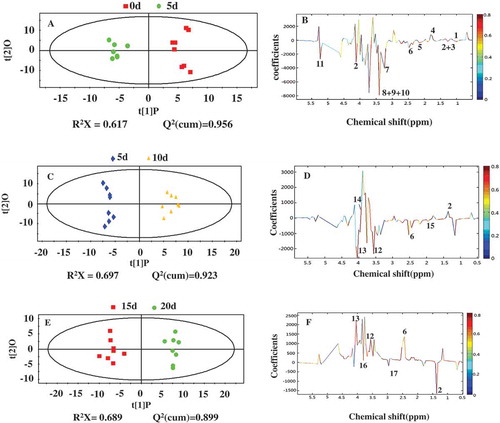
According to the loading plots (; QCitation2 > 0.95), the most significant changes (p < 0.05) occurred during the first 5 days of fermentation. The components of L-rhamnoseand and arginine appeared to exist in the raw wax gourd, while lactated, fatty acids, N-acetylglutamate, succinate, phosphorylcholine, methionine, ornithine, lysine, and β-glucose were increased significantly during the first 5 days of the pickling process. With the fermentation going on, the metabolites changed from lactate and proline on the 5th day (p < 0.05) to succinate, acetate, glycine, and choline on the 10th day (; QCitation2 > 0.92). At the end of the pickling process (day 15 and day 20), we found the content of succinate, glycineandcholine to remain constant (; QCitation2 > 0.89) in comparison to the middle stage of the pickling process (day 10; p < 0.05). Lactate, mannitol, and α-ketoglutaric acid increased at the end of the picking process (day 20). In short, symbolic metabolites formed during of wax gourd fermentation process were similar in the early (5 to 10 days) and late phase (15 to 20 days) of the fermentation process.
L-rhamnose is the most common deoxyhexose which is a component in plant cell wall, consisting of pectic polysaccharides from rhamnogalacturonan I and rhamnogalacturonan II, formed by hydrolysis of pectinase.[Citation23] A high concentration of L-rhamnose was detected during the early stage of pickling process due to the slow growth of original bacteria. In addition, L-rhamnose was easily dissolved in the brine due to salt osmolarity ( and ). L-rhamnose (6-deoxy-L-mannose) and mannose can be transformed into glucose-6-phosphate.[Citation24,Citation25] The formation of lactate from these monosaccharides in pickled brine can be elucidated by term of metabolism pathway including the Embden-Meyerhof-Parnas (EMP; pathway or glycolysis; ). Fatty acids are formed by transformation of pyruvate. This explanation fit with the result of the unsupervised pattern (PCA; ).
FIGURE 7 The major metabolites by a complex bacterial community in pickled wax gourd.
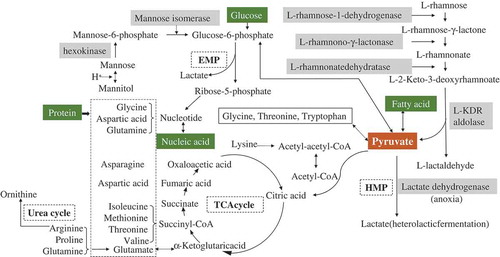
An accumulation of succinate, glycine, acetate, and choline were found on the 10th day of fermentation. Succinate is the intermediate of TCA (tricarboxylic acid cycle) cycle, which is involved in the rapid growth of various bacteria ahead of this stage. Glycine, acetate, and choline are possibly produced by fermentation of various species existed in the pickling process at the middle stage. There was no significant difference between days 10 and 15 of fermentation (p > 0.05) indicating static growth of microorganism during this period. It can be equally explained that the decrease of succinate, glycine, and choline are caused by the change in the bacteria community and dominant species after 15 days of fermentation. Meanwhile, lactate, mannitol, and α-ketoglutaric acid recorded marked increase during this period (). In our previous study, it showed the metabolites from different microbial species caused the changes of environmental and nutrient conditions in pickled samples and facilitated the variation of different microbial populations.[Citation26] The lactic acid bacteria are main species existed which are related to these changes of metabolites by heterolactic fermentation under the anaerobic environmental condition.[Citation6,Citation27,Citation28] An accumulation of α-ketoglutaric acid can be explained by consumption of nitrogen compounds of glutamic acid during the late phase of wax gourd fermentation.[Citation12]
Conclusions
In summary, NMR analysis in combination with HPLC method turned out to be a very useful tool to characterize the quality of spontaneous fermentation pickled wax gourd, as it revealed relationships between the microbial communities and their metabolites. Succinate was found as a symbolic metabolite occurred in each sample. Different classes and compositions of various compounds in pickled product can be well detected by NMR method. NMR method is an efficient aid for optimization of processing technology of pickled vegetables production. In the near future, a complete and efficient method for quality evaluation of traditional pickled food will be conducted by combination of other date of inorganic compounds such as the content of nitrite and nitrate, saccharides by HPLC-MS or the organoleptic evaluation, GC–MS as well as capillary electrophoresis.
FUNDING
The authors gratefully acknowledge the financial support of National Natural Science Foundation, China (NNSF No. 31171735) and are thankful for the support “Sponsored by K. C. Wong Magna Fund in Ningbo University” and Critical Project in Agriculture Field in Ningbo (2012C10016), China.
Additional information
Funding
REFERENCES
- Wills, R.B.; Wong, A.W.; Scriven, F.M.; Greenfield, H. Nutrient Composition of Chinese Vegetables. Journal of Agricultural and Food Chemistry 1984, 32, 413–416.
- Huang, G.L.; Tan, J.T.; Tan, X.C.; Yang, H.; Peng, D.Q. Preparation of Polysaccharides from Wax Gourd. International Journal of Food Sciences and Nutrition 2011, 62, 480–483.
- Liu, S.N.; Han, Y.; Zhou, Z.J. Lactic Acid Bacteria in Traditional Fermented Chinese Foods. Food Research International 2011, 44, 643–651.
- Gao, D.W.; Zhu, G.H.; Gao, Z.R.; Liu, Z.W.; Wang, L.X.; Guo, W. Antioxidative and Hypolipidemic Effects of Lactic Acid Bacteria from Pickled Chinese Cabbage. Journal of Medicinal Plants Research 2011, 5, 1439–1446.
- Xiong, T.; Guan, Q.; Song, S.; Hao, M.; Xie, M. Dynamic Changes of Lactic Acid Bacteria Flora During Chinese Sauerkraut Fermentation. Food Control 2012, 26, 178–181.
- Zhao, Y.W.; Wu, Z.F.; Shen, X.Q.; Weng, P.F.; Chen, J.J. Bacteria Community Analysis by Quantitative Real-Time PCR of Fermenting Wax Gourd and Its Changes of Organic Acids. Journal of Food Processing and Preservation 2014, 38, 1653–1659.
- Jung, J.Y.; Lee, S.H.; Kim, J.M.; Park, M.S.; Bae, J.W.; Hahn, Y.; Madsen, E.L.; Jeon, C.O. Metagenomic Analysis of Kimchi, a Traditional Korean Fermented Food. Applied and Environmental Microbiology 2011, 77, 2264–2274.
- Consonni, R.; Cagliani, L.R. Nuclear Magnetic Resonance and Chemometrics to Assess Geographical Origin and Quality of Traditional Food Products. Advances in Food and Nutrition Research 2010, 59, 87–165.
- Tarachiwin, L.; Masako, O.; Fukusaki, E. Quality Evaluation and Prediction of Citrulluslanatus by 1H NMR-Based Metabolomics and Multivariate Analysis. Journal of Agricultural and Food Chemistry 2008, 56, 5827–5835.
- Li, L.; Li, X.H.; Ban, Z.J.; Jiang, Y.H. Variation in Antioxidant Metabolites and Enzymes of “Red Fuji” Apple Pulp and Peel During Cold Storage. International Journal of Food Properties, 2014, 17, 1067–1080.
- Zhang, Y.; Xie, J.B.; Zhang, Y.Q.; Zhang, M.C. Degradation Kinetics of Jujuboside a by Rat Intestinal Flora and Identification of the Metabolites by HPLC-MS/MS. International Journal of Food Properties, 2014, 17, 1841–1849.
- Jung, Y.; Ahn, Y.G.; Kim, H.K.; Moon, B.C.; Lee, A.Y.; Hwang, G.S. Characterization of Dandelion Species Using 1H NMR- and GC-MS-Based Metabolite Profiling. Analyst 2011, 136, 4222–4231.
- Renata, M.; Johan, T.; Hans, W.W.; Thomas, M.; Izabella, S. Optimization of a Sample Preparation Method for the Metabolomic Analysis of Clinically Relevant Bacteria. Journal of Microbiological Methods 2011, 87, 24–31.
- Sajiki, K.; Pluskal, T.; Shimanuki, M.; Yanagida, M. Metabolomic Analysis of Fission Yeast at the Onset of Nitrogen Starvation. Metabolites 2013, 3, 1118–1129.
- Ye, Y.F.; Zhang, L.M.; Tang, H.R.; Yan, X.J. Survey of Nutrients and Quality Assessment of Crab Paste by 1H NMR Spectroscopy and Multivariate Data Analysis. Chinese Science Bulletin 2012, 57, 3353–3362.
- Kristian, H.L. Multivariate Methods in Metabolomics—From Pre-Processing to Dimension Reduction and Statistical Analysis. Trend in Analytical Chemistry 2011, 30, 827–841.
- Sun, H.; Ni, B.; Zhang, A.; Wang, M.; Dong, H.; Wang, X. Metabolomics Study on Fuzi and Its Processed Products Using Ultra-Performance Liquid-Chromatography/Electrospray-Ionization Synapt High-Definition Mass Spectrometry Coupled with Pattern Recognition Analysis. Analyst 2012, 137, 170–185.
- Shao, Y.N.; Li, C.H.; Ou, C.R.; Zhang, P.; Lu, Y.L.; Su, X.R.; Li, Y.; Li, T.W. Divergent Metabolic Responses of Apostichopus Japonicus Suffered from Skin Ulceration Syndrome and Pathogen Challenge. Journal of Agricultural and Food Chemistry 2013, 61, 10766–10771.
- Palamthodi, S.; Lele, S.S. Nutraceutical Applications of Gourd Family Vegetables: Benincasahispida, Lagenaria Siceraria, and Momordica Charantia. Biomedicine & Preventive Nutrition 2014, 4, 15–21.
- Lan, W.T.; Chen, Y.; Yanagida, F. Isolation and Characterization of Lactic Acid Bacteria from Yan-Dong-Gua (Fermented Wax Gourd), a Traditional Fermented Food in Taiwan. Journal of Bioscience and Bioengineering 2009, 108, 484–487.
- Mira-de-Orduña, R. Climate Change Associated Effects on Grape and Wine Quality and Production. Food Research International 2010, 43, 1844–1855.
- Nguyen, D.T.L.; Van-Hoorde, K.; Cnockaert, M.; Brandt, E.D.; Aerts, M.; Thanh, L.B.; Vandamme, P. A Description of the Lactic Acid Bacteria Microbiota Associated with the Production of Traditional Fermented Vegetables in Vietnam. International Journal of Food Microbiology 2013, 163, 19–27.
- Tamayo-Ramos, J.A.; Flipphi, M.; Pardo, E.; Manzanares, P.; Orejas, M. L-Rhamnose Induction of Aspergillusnidulans α-L-Rhamnosidase Genes Is Glucose Repressed Via a Crea-Independent Mechanism Acting at the Level of Inducer Uptake. Microbial Cell Factories 2012, 11, 26–43.
- Gruben, B.S.; Zhou, M.; Wiebenga, A.; Ballering, J.; Overkamp, K.M.; Punt, P.J.; De Vries, R.P. Aspergillus niger RhaR, a Regulator Involved in L-Rhamnose Release and Catabolism. Applied Microbiology and Biotechnology 2014, 98, 5531–5540.
- Sheridan, R.T.C.; Hudon, J.; Hank, J.A.; Sondel, P.M.; Kiessling, L.L. Rhamnose Glycoconjugates for the Recruitment of Endogenous Anti-Carbohydrate Antibodies to Tumor Cells. ChemBioChem 2014, 15, 1393–1398.
- Wu, Z.F.; Zhuang, B.W.; Weng, P.F.; Zhang, X. Fermentation Quality Characteristics and Flavor Formation Changes During the Process of Pickled Wax Gourd in Eastern Zhejiang. International Journal of Food Properties, 2015. DOI:10.1080/10942912.2015.1027775
- Ueland, P.M. Choline and Betaine in Health and Disease. Journal of Inherited Metabolic Disease 2011, 34, 3–15.
- Wouters, D.; Grosu-Tudor, S.; Zamfir, M.; De, V.L. Bacterial Community Dynamics, Lactic Acid Bacteria Species Diversity, and Metabolite Kinetics of Traditional Romanian Vegetable Fermentations. Journal of the Science of Food and Agriculture 2013, 93, 749–760.