
 ?Mathematical formulae have been encoded as MathML and are displayed in this HTML version using MathJax in order to improve their display. Uncheck the box to turn MathJax off. This feature requires Javascript. Click on a formula to zoom.
Abstract
The popping process was optimized for brown rice based on an expansion ratio. A central composite design with interactive effect of three independent variables, including salt content (1–2.5 g/100 g raw material), moisture content (13–17 g/100 g raw material), and popping temperature (210–240°C) was used to study their effects on the expansion ratio of rice using response surface methodology. The experimental values of expansion ratio were ranged from 5.24 to 6.85. On fitting the experimental values of expansion ratio to a second order polynomial equation, a mathematical model with the predictability was developed with the statistical adequacy and validity (p ˂ 0.05). From the model, the optimal condition including salt content (1.75 g/100 g raw material), moisture content (15 g/100 g raw material), and popping temperature (225°C) were predicted for a maximum expansion ratio of 6.79, which was then proved to be 6.85 through experiment. Raw and popped brown rice were investigated for physical properties including hardness, L*, a*, and b* value, length/breadth ratio, bulk density, and minerals, which showed the significant differences. The optimized popped rice sample was evaluated for structural, spectroscopic, and thermal properties, which showed the significant difference from raw rice.
INTRODUCTION
Rice (Oryza Sativa L.) is a staple food in many parts of the world, especially in East, South, and South East Asia, making it the second most consumed cereal grain.[Citation1] The change in lifestyle pattern and health consciousness among consumers increased the demand for brown rice, because of its excellent nutritional and health benefit properties.[Citation2] Brown rice is a major source of carbohydrates, dietary fiber, minerals, vitamins, and phytochemicals, which are known for beneficial health properties.[Citation3–Citation5]
In addition to cooked rice, there is a steady basic demand for rice-based snack products.[Citation6] Popped rice is one of the highly acceptable snacks used for human consumption and is becoming popular over time. Popped rice is one of the popular snacks in India, which is prepared from pregelatinized rice usually following by sand roasting, gun puffing, or microwave method.[Citation7] Popped products are mainly appreciated for its crispness, lightness, and qualities related to their cellular structures.[Citation8–Citation10] To change the rice grain from a compact to an expanded structure, it has to pass through many stages during the popping process which alters its physical properties and nutritional profile. The popping volume of grain depends on several factors such as physicochemical properties, processing parameters, popping methods, and variety.[Citation7,Citation11]
Rice popping involves different stages including parboiling, drying, milling, and the expansion process. The paddy is taken for hydrothermal treatment before undergoing popping which involves the healing of internal cracks of the grain and resulting in the formation of hard grain.[Citation12] The rice grain with a hardened outer layer acts like a miniature pressure vessel for the moisture trapped inside the grains on application of heat during the popping process.[Citation13]
Literature reported that methods have been developed and optimized for the popping of milled rice.[Citation9] But no such studies have been reported on the optimization of process of popping for brown rice, which have consumer demand due to the health benefit properties. Salt content, moisture content, and popping temperature are the critical factors that determine the expansion ratio of popped rice. In the present study, salt concentration, moisture content, and popping temperature were selected as independent variables and their interactive effect on the expansion ratio of rice was optimized using response surface methodology. The developed popped rice were also evaluated and compared for physical properties and mineral composition with raw brown rice.
MATERIAL AND METHODS
Materials
Jehlum rice cultivar used in this study was procured from Shere-e-Kashmir University of Agricultural Science and Technology, Kashmir, Jammu and Kashmir, India. The rice cultivar was selected for popping purposes based on the investigation of physical properties of rice cultivars performed by the authors.[Citation14]
Preparation of Popped Rice
The paddy was soaked in boiling water at 80°C for 4 h, stirred, chaff was removed by a strainer, and covering tightly with a gunny cloth to avoid sudden heat loss. The water was drained off and the soaked paddy was spread on small wire-mesh trays, and steamed in an autoclave at a pressure 1.5 kg/cm2 for 10 min. The paddy was then dried at 40°C in a tray drier and dehusked in a Stake Testing Rice Husker (THU-34A, Stake, Japan). The parboiled rice was then thoroughly mixed with salt solution of different concentrations (1–2.5 g/100 g raw material) and then again is dried to the desired moisture content (13–17 g/100 g raw material). The parboiled brown rice was popped in an iron pan containing sand at different temperatures (210–240°C) and vigorously stirred with the sand to ensure uniform heating. After popping, the grains were immediately removed from the hot sand by sieving and spread on a marble floor.
Expansion Ratio
The expansion ratio was determined using the method described by Maisont and Narkrugsa.[Citation15] Expansion ratio of popped rice was calculated by dividing the volume of popped rice with the volume of raw brown rice.
Experimental Design
Response surface methodology (RSM) was performed to determine the effect of three factors (salt concentration, moisture content, and sand popping temperature) on the expansion ratio of rice. The effect of three independent factors X1 (salt concentration), X2 (moisture content), and X3 (popping temperature) at five different levels (–α, –1, 0, +1, +α) on the expansion ratio of brown rice were investigated using a central composite design (). Twenty experimental combinations of independent variables with eight factorial points, six axial points, and six repetitions of experiments at the central point were executed. Experiments were run in random order to minimize the effect of unexpected inconsistency in the observed response due to extraneous factors. The expansion ratio was measured in triplicates for 20 different experimental runs and their observations were fitted to the following second order polynomial equation using multiple regression procedure.
TABLE 1 Code and levels of independent factors used for central composite design
where Y is the predicted response; β0 is the regression coefficient at center point, β1, β2, and β3 are the linear coefficients, β11, β22, and β33 are the quadratic coefficients, β12, β13, and β23 are the second order interaction coefficients. The salt concentration (X1), moisture content (X2), and sand temperature (X3) are the independent variables.
Validation of the Model
Optimal conditions for popping, such as salt concentration, moisture content, and popping temperature for the expansion of brown rice, were obtained using the predictive equations of response surface methodology. The analysis of coefficients of regression models was carried out by the analysis of variance (ANOVA) technique to find the significance of each coefficient. The experimental and predicted values were compared in order to determine the validity of the model.
Physical Properties
Hardness of the raw and popped rice grains was measured by using Texture Analyzer (TA-HD, Model No. 5197, Stable Micro Systems Ltd., Surrey, UK). A single compression force-versus time program was used to compress single rice grain along the thickness at a test speed of 0.10 mm/s and return to its original position. A 5 mm diameter stainless steel probe (P/5) was used to compress a single grain. The peak force indicated by the force time curve was taken as the hardness of sample. The color of samples were determined by CIE color scales L*, a*, and b* using Hunter Lab digital colorimeter (Model D25M, Hunter Associates Laboratory, Reston, VA). The length/breadth (L/B) ratio of raw and popped rice grains were obtained from randomly selected samples by measuring their length and breadth using Vernier caliper. The bulk density was determined using the mass/volume relationship by filling an empty plastic container of predetermined volume and tare weight with the grains by pouring from a constant height, striking off the top level and weighing.
Scanning Electron Microscopy
Morphology of the samples was analyzed by scanning electron microscopy (Hitachi, S-3400N, Tokyo, Japan). The samples were mounted on aluminium stubs using double sided adhesive tape to which the samples were fixed and afterward, were coated with a thin layer of gold. An acceleration potential of 15 KV was used during micrography.
X-Ray Diffraction
An x-ray diffraction pattern was performed using an x-ray diffractometer (Shimadzu, XRD 7000) operated at a tube current (30 mA) and target voltage (40 kV) with Cu Kα radiation wavelength of 1.540. The scanning range for 2θ values was set to 10 to 50° to cover all significant diffraction peaks of sample crystallites with a scan speed of 2°/min.
Fourier Transform Infrared Spectroscopy (FTIR)
Properly dried samples (2 mg) were thoroughly mixed with 50 mg desiccated potassium bromide powder in a mortar and pestle before pressing into a thin pellet. The infrared absorption spectra of the sample pellets were obtained using a FTIR spectrometer (Thermo Nicolet 6700, Thermoscientific, UK). The equipment was operated with a resolution of 0.1 cm−1 and scanning range of 4000–450 cm−1.
Differential Scanning Calorimetry
The thermal properties of raw and popped brown rice samples were determined by using a differential scanning calorimeter (DSC-2010, TA instruments, New Castle, DE, USA). A sample (3 mg) with distilled water (1:3) was heated at 10°C/min from 20 to 100°C. Thermal transitions of samples for gelatinization were characterised by onset temperature, peak temperature, conclusion temperature, and enthalpy of gelatinization.
Mineral Analysis
The analysis of minerals was performed using a wavelength dispersive spectrometer x-ray fluorescence (WD-XRF), Bruker AXS, S4-Pioneer Germany by using the method described by Mir et al.[Citation16] Powdered samples (2 g) were mixed with 0.5 g boric acid (granulated) with a mortar and pestle. The prepared sample was then made into a 34 mm diameter pellet with the help of a 40 ton hydraulic press machine (10 ton pressure, 20 min pressing time). The pellets were then introduced in the sample slots of WD-XRF and analyzed for minerals.
Statistical Analysis
Statistical software, Design-Expert 8.0.7.1 (State-Ease Inc., Minneapolis, USA) was used for regression analysis and response surface plots. The data were analyzed statistically using SPSS software (SPSS PASW 18.0) at significance level (p < 0.05) and data were presented as the mean with standard deviation.
RESULTS AND DISCUSSION
Optimization of Popping of Rice by Response Surface Methodology
The effect of three independent variables including X1 (salt), X2 (moisture), and X3 (popping temperature) on the expansion ratio of popped rice were investigated and their experimental levels were selected to obtain a central composite design matrix. By applying multiple regression analysis on the experimental result, a second order polynomial equation was established to estimate the relation between response (expansion ratio) and independent variable (X1, X2, and X3) during popping as given in the following equation:
Y is the predicted expansion ratio of popped rice and is used to compare with the experimental values. X1, X2, and X3 are the coded values for salt, moisture, and popping temperature, respectively. The ANOVA of variables was performed to evaluate the statistical significance and reliability of model. The significant p-value of the model and its F-value 327.66, indicating the adequacy of the model. Moreover, the linear coefficients (X1) and quadratic coefficients (X12, X22, X32) showed high significant effects (p < 0.05) on the expansion ratio of rice. The value for coefficient of determination was 0.996 explaining 99.6% of variability in the expansion ratio of rice. The value of adjusted coefficient of determination was 99.3% and adequate precision 45.20, which confirmed the high significance of the model. The model is the goodness-of-fit as proved by the coefficient of variation which was calculated to be 0.84%, which is less than 10% representing a better precision and reliability of the model.
The 3D response surface plot shows the graphical representation of the regression equation and the best way to visualize the relationship between response and independent factors and the interactions between two factors. The response surface plots of the interactive effect of salt and moisture content on the expansion ratio of rice is shown in . The expansion ratio was initially increased as the moisture content increased from 13 to 15 g/100 g raw material and salt content from 1 to 1.75 g/100 g raw material, respectively, but then decreased, when moisture and salt decreased beyond 15 g/100 g raw material and 1.75 g/100 g raw material, respectively. Murugesan and Bhattacharya[Citation13] indicated that the expansion ratio of milled rice increased with increasing in moisture content up to 17%. Previous reports revealed that increase in moisture content above 16% is detrimental for the expansion ratio of paddy.[Citation15] Similar reports are also available on process optimization of popcorn.[Citation11]
FIGURE 1 Response surface plots for expansion ratio of popped rice. (a) Effect of moisture and salt content; (b) Effect of popping temperature and moisture content; (c) Effect of popping temperature and salt.
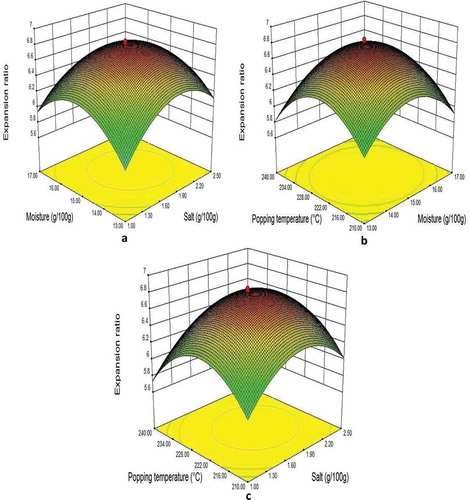
The interactive effect of moisture content and popping temperature revealed that maximum expansion ratio was obtained when moisture content was 15.50 g/100 g raw material and sand temperature 225°C, while the salt content was 1.75 g/100 g raw material (). The results in ANOVA analysis showed that quadratic effect of popping temperature was found to exhibit significant effect (p < 0.05) on the expansion ratio. Previous studies on expansion of rice revealed significant increase in expansion ratio up to 225°C.[Citation9] However, high popping temperatures slightly charred the rice which may lead to the decrease in expansion ratio. The steam generated due to popping temperature built enough pressure to blow up the starch before escaping out. The difference in the reported results may be due to differences in variety, growing condition, and processing operations.
The combined effect of salt content and popping temperature on the expansion ratio of popped rice is shown in . Variation in salt and popping temperature revealed the expansion ratio was maximum when salt content was 1.75 g/100 g raw material and popping temperature 225°C. Salt helps in expansion by facilitating the heat conduction inward. The ANOVA results showed that quadratic effect of salt and sand temperature variable were found to exhibit significant effect (p < 0.05) on the expansion ratio of rice. Murugesan and Bhattacharya[Citation13] reported that rice showed maximum expansion ratio at 2% salt, which is higher than the present study.
Validation of the Model
To validate the adequacy of the quadratic equations, a verification experiment was carried out under optimum conditions including salt concentration 1.75 g/100 g raw material, moisture content 15 g/100 g raw material and popping temperature at 225°C. Under these optimal conditions, maximum expansion ratio of 6.85 was observed, which was good agreement to their respective predicted ratio 6.79 and found optimal for the maximum expansion ratio of popped rice.
Physical Properties
The physical properties showed marked variation after popping process (). The hardness of raw brown rice is 97.97 N which is decreased to 15.68 N in popped rice. The hardness value of grain is decreased due to expansion of rice popping which leads to the structural change in the rice kernel. The color value also changed after popping process with increase in L* value and decrease in a* and b* value. The change in color parameters of popped rice is due to the expansion of grain and exposing the inner white endosperm which resulted in increased whiteness. The L/B ratio is decreased from 2.43 to 1.87 for raw and popped rice, respectively. The bulk density showed significant variation with the lowest in popped rice (137.85 kg/m3) and highest in raw brown rice (584.60 Kg/m3). Porous structure of the rice grain formed during popping offers the dimensional changes and low bulk density values of popped grains. Mariotti et al.[Citation17] also observed the variation in dimensions and bulk density after popping while studying with the popping characteristics of cereal grains.
TABLE 2 Physical properties and mineral analysis of raw and popped brown rice
Scanning Electron Microscopy
The morphological structure of raw and popped rice were studied using scanning electron microscopy. The scanning electronic micrography of cross section of raw and popped rice grains showed the marked morphological difference (). The raw rice gains having compact internal structure which changes to porous matrix with several cavities of different sized during popping. The polyhedral structure of starch granules of raw grain during popping changed into a coherent mass and the gelatinized starch along with the disrupted protein bodies occupied the air spaces in the endosperm.[Citation18] The popping process makes the significant increases in grain size which may be responsible for altering the physical properties.
FIGURE 2 Cross section scanning electron microscopy of (a) raw brown rice; (b) popped brown rice.
FTIR
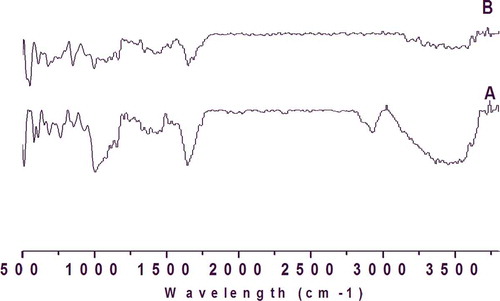
The changes in FTIR spectra of raw and popped rice sample are shown in . The differences in the peak intensities indicate differences in the helical and crystalline arrangements of raw and popped rice. Since carbohydrate polymers such as starch are extensively hydrogen bonded, conformational changes during processing leads to band narrowing and changes in band intensities.[Citation19] This may be due to the possible damage of pyranose ring structure during popping processing. The variable changes in intensities indicating definite alteration in the molecular bonding parameters on processing and resulted in the decrease in the intensity of bands at 1156 and 1080 cm−1. The results suggest that the ordered structure of raw rice was disrupted as a result of thermal degradation and the structure of the popped is more amorphous in nature. Retrogradation influences the vibrational mode of CH bonds in starch and was confirmed by loss of intensity of small peaks at 866 and 1344 cm−1.[Citation20]
FIGURE 3 FT-IR spectrogram of (a) raw brown rice; (b) popped brown rice.
X-Ray Diffraction
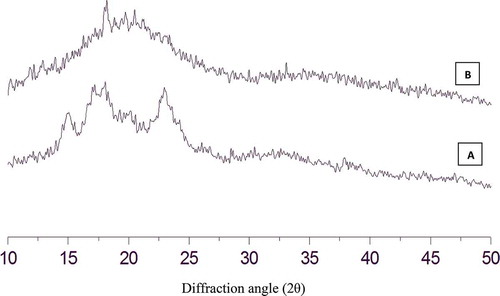
The raw brown rice exhibited the A-type diffraction pattern with the intense peaks at Bragg’s angle (2θ) values of 15, 17, and 23° (). The diffraction peaks remarkably changed after the popping process. The popping treatment significantly alters intensity peaks of raw rice and showed the disappearance of A-type diffraction pattern and development of V-type patterns. The V-pattern observed in the expanded rice with a peak at 2θ value of 18.50° may be caused by complex formation between amylose and lipid. The results are in par with Murugesan and Bhattacharya,[Citation21] who also reported similar diffraction pattern for starch from popped rice.
FIGURE 4 X-ray diffractrographs of (a) raw brown rice; (b) popped brown rice.
Differential Scanning Calorimetry
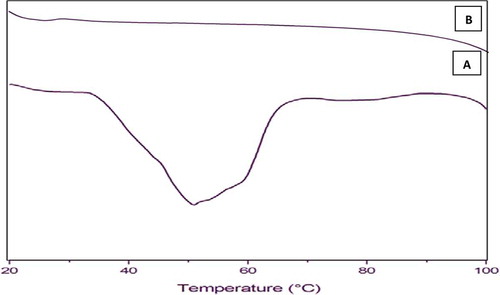
The differential scanning calorimetry thermogram of raw and popped rice samples are shown in . The raw brown rice showed the typical endotherm with onset temperature of (31.71°C), peak temperature (50.92°C), conclusion temperature (64.93°C), and enthalpy of gelatinization (258.2 J/g). However, unlike raw rice, no gelatinization endotherms were detected in the popped sample. The absence of endotherm in the popped rice may due to fully damaged starch and disintegration of structural integrity of polymer during heat treatment of popping operation. Similar findings were observed by Tatongjai and Lumdubwong[Citation22] while studying with rice starches.
FIGURE 5 Differential scanning calorimetry thermogram of (a) raw brown rice; (b) popped brown rice.
Minerals
shows the level of minerals of raw and popped rice done by WD-XRF. Brown rice is rich source of minerals which are important for human health. The results had shown that popping appreciably increased the levels of minerals in the rice. The popped rice is rich in minerals mostly potassium (119.70 mg/100 g) followed by phosphorus (85.68 mg/100 g), sulphur (28.65 mg/100 g), magnesium (20.05 mg/100 g), calcium (7.14 mg/100 g), silicon (3.23 mg/100 g), iron (2.48 mg/100 g), and zinc (2.63 mg/100 g). The increase in mineral content may be due to the migration of minerals from husk to the rice grain during the parboiling process of popping. The results are in par with Murakami et al.[Citation23] reported the increase in minerals of amaranth seed after popping process.
CONCLUSION
The present study concludes the maximum popping expansion of brown rice was dependent on salt content, moisture content, and popping temperature optimized using response surface methodology. The second order polynomial developed for expansion ratio exhibited a non-significant value for lack of fit and higher value for the coefficient of determination (0.993) which showed the adequacy of model. The results indicated that maximum expansion ratio (6.85) was obtained at salt content of 1.75 g/100 g raw material, moisture content 15 g/100 g raw material and popping temperature 225°C and are in agreement to the verified experimental yield of expansion ratio (6.79). The optimum conditions can be used to produce the best expanded rice form brown rice during the popping process. The optimized popping process showed the extensive change in physical, structural properties, and mineral content of brown rice.
REFERENCES
- Mir, S.A.; Bosco, S.J.D. Cultivar Difference in Physicochemical Properties of Starches and Flours from Temperate Rice of Indian Himalayas. Food Chemistry 2014, 157, 448–456.
- Ismail, M.; Hadi, N.A.; Haroun, R.Z.; Musa, S.N.A.; Imran, M.U. Energy Dispersive X-Ray Microanalysis of Elemental Distribution in Raw and Germinated Brown Rice Varieties. International Journal of Food Properties 2014, 17, 1449–1459.
- Gujral, H.S.; Sharma, P.; Kumar, A.; Singh, B. Total Phenolic Content and Antioxidant Activity of Extruded Brown Rice. International Journal of Food Properties 2012, 15, 301–311.
- Esa, N.M.; Kadir, K.K.A.; Amom, Z.; Azlan, A. Antioxidant Activity of White Rice, Brown Rice, and Germinated Brown Rice (in Vivo and in Vitro) and the Effects on Lipid Peroxidation and Liver Enzymes in Hyperlipidaemic Rabbits. Food Chemistry 2013, 141(2),1306–1312.
- Caceres, P.J.; Martínez-Villaluenga, C.; Amigo, L.; Frias, J. Maximising the Phytochemical Content and Antioxidant Activity of Ecuadorian Brown Rice Sprouts Through Optimal Germination Conditions. Food Chemistry 2014, 152, 407–414.
- Mujoo, R.; Ali, Z. Changes in Physico-Chemical and Rheological Properties of Rice During Flaking. International Journal of Food Properties 2000, 3, 117–135.
- Joshi, N.R.; Mohapatra, D.; Joshi, D.C. Varietal Selection of Some Indica Rice for Production of Puffed Rice. Food and Bioprocess Technology 2014, 7, 299–305.
- Dharmaraj, U.; Ravi, R.; Malleshi, N.G. Physicochemical and Textural Characteristics of Expanded Finger Millet. International Journal of Food Properties 2012, 15, 336–349.
- Hoke, K.; Housova, J.; Houska, M. Optimum Conditions for Puffing. Czech Journal of Food Science 2005, 23, 1–11.
- Nath, A.; Chattopadhyay, P.K. Quality Attributes of High Temperature Short Time Air Puffed Ready to Eat Potato Snacks. International Journal of Food Properties 2007, 10, 113–125.
- Gokmen, S. Effects of Moisture Content and Popping Method on Popping Characteristics of Popcorn. Journal of Food Engineering 2004, 65, 357–362.
- Mir, S.A.; Bosco, S.J.D. Effect of Soaking Temperature on Physical and Functional Properties of Parboiled Rice Cultivars Grown in Temperate Region of India. Food and Nutrition Sciences 2013, 4, 282–288.
- Murugesan, G.; Bhattacharya, K.R. Effect of Some Pretreatments on Popping Expansion of Rice. Journal of Cereal Science 1991, 13, 85–92.
- Mir, S.A.; Bosco, S.J.D.; Sunooj, K.V. Evaluation of Physical Properties of Rice Cultivars Grown in the Temperate Region of India. International Food Research Journal 2013, 20(4), 1521–1527.
- Maisont, S.; Narkrugsa, W. Effect of Salt, Moisture Content, and Microwave Power on Puffing Qualities of Puffed Rice. Kesetsart Journal (Natural Science) 2010, 44, 251–261.
- Mir, S.A.; Bosco, S.J.D.; Shah, M.A.; Santhalakshmy, S.; Mir, M.M. Effect of Apple Pomace on Quality Characteristics of Brown Rice Based Cracker. Journal of the Saudi Society of Agricultural Sciences 2015, http://dx.doi.org/10.1016/j.jssas.2015.01.001 (Accessed on June 9, 2015).
- Mariotti, M.; Alamprese, C.; Pagani, M.A.; Lucisano, M. Effect of Puffing on Ultrastructure and Physical Characteristics of Cereal Grains and Flours. Journal of Cereal Science 2006, 43, 47–56.
- Chandrasekhar, P.R.; Chattopadhyay, P.K. Studies on Microstructural Changes of Parboiled and Puffed Rice. Journal of Food Processing and Preservation 1990, 14, 27–37.
- Karim, A.A.; Norziah, M.H.; Seow, C.C. Methods for the Study of Starch Retrogradation. Food Chemistry 2000, 71, 9–36.
- Van Soest, J.J.; Tournois, H.; De Wit, D.; Vliegenthart, J.F. Short-Range Structure in (Partially) Crystalline Potato Starch Determined with Attenuated Total Reflectance Fourier-Transform IR Spectroscopy. Carbohydrate Research 1995, 279, 201–214.
- Murugesan, G.; Bhattacharya, K.R. The Nature of Starch in Popped Rice. Carbohydrate Polymers 1989, 10, 215–225.
- Tatongjai, J.; Lumdubwong, N. Physicochemical Properties and Textile Utilization of Low- and Moderate-Substituted Carboxymethyl Rice Starches with Various Amylose Content. Carbohydrate Polymers 2010, 81, 377–384.
- Murakami, T.; Yutani, A.; Yamano, T.; Iyota, K.; Konishi, Y. Effects of Popping on Nutrient Contents on Amaranth Seed. Plant Foods for Human Nutrition 2014, 69, 25–29.