
Abstract
Ice formation and non-freezable water (WNFW) of rice flour and tapioca starch gels were studied at two different freezing rates (–10 and –100°C/min) using differential scanning calorimetry. Ice crystal growth was observed in the slow freezing but not in the fast one. Ice melting enthalpies, however, were similar since more ice formed in holding and reheating steps. Melting enthalpy of fully gelatinized systems with water contents ~ 0.50–0.66 was associated to starch composition and granule morphology. Highly swollen tapioca starch gave the lowest enthalpy and the highest WNFW (0.40 g/g dry starch versus 0.32 and 0.38 g/g dry starch of normal and waxy rice flours, respectively). The further studies revealed that the WNFW values were associated to swelling power, solubility, and granule morphology.
Introduction
In the past decades, demands of frozen ready-meals have risen substantially in food markets. The current market in the United States is very large and well-established. In Asia, especially South East Asia, the market is rather small but growing rapidly. Frozen starch-based meals are commonly available in the South East Asia. However, these types of products still not meet most of the consumer’s preference since they typically have poor texture upon storage at low temperature as a result of starch retrogradation[Citation1] and phase separation during the process of ice formation.[Citation2] Understanding the state of water and how it forms ice during processing and storage could help improving textural quality of starch-based frozen foods.
Often constituted in food products, water is recognized as the most important dispersing medium which contributes to their sensory, processing, and storage properties.[Citation3,Citation4] Moreover, its interaction with other food constituents, such as starch and other polysaccharides, controls the structure-property relationships of the food products. Generally, the presence of water in food matrix is defined into three categories: non-freezable water, freezable water, and free water.[Citation5] Non-freezable water is strongly bound to the hydrophilic groups which are normally present in the food matrix. This type of water immobilizes and remains unfrozen under subfreezing temperatures[Citation6] and it is also responsible for the stability of foods, i.e., texture and microbiological stability.[Citation7] Freezable water is loosely bound to molecules in food matrix. It can be frozen and melted at a temperature lower than pure bulk water (0°C).[Citation8] On the other hand, free water is mobile and unbound to the food matrix. It can be crystallized to ice crystal with melting and freezing points at the temperatures identical to those of pure bulk water. The amount of these three types of water in any particular systems has been investigated as functions of water content,[Citation9,Citation10] hydrophilicity of food components,[Citation11] freezing temperature,[Citation9] freezing rate,[Citation12] and the presence of other small molecules such as sucrose.[Citation13]
Formation of ice crystals is associated to freezable water and free water present in food matrix. Since many solute molecules (i.e., polysaccharide, protein, salt, sugar, lipid, etc.) usually exist in the food matrix, during freezing ice formation simultaneously takes place with the freeze-concentration process of those solutes. Thus, freezing temperature is very much reduced compared to that of pure water.[Citation14] Similar to a typical crystallization process, the amount and size of ice crystal formed are dependent on freezing rate.[Citation15] Slow freezing usually leads to the process of ice crystal growth. On the other hand, rapid freezing results in less ice formation (since more water is in glassy state) and shows low glass transition temperature (Tg); yet, upon reheating above the Tg of the freeze-concentrated matrix, more ice may possibly form, which is also known as the devitrification. This is mainly due to the decreased viscosity of the unfrozen matrix.[Citation14] When the temperature is further increased, all ice crystals melt and the freezable water is segregated from the food matrix, which can consequently deteriorate the food texture and its stability.[Citation16]
As ice formation and distribution affects texture, quality, and stability of food,[Citation17] molecules with strong water-binding capacity, that yield large amount of non-freezable water and thus reducing the formation of ice crystal, are desirable in frozen products. Interaction of the food product with water can be investigated through the determination of non-freezable water content using a differential scanning calorimetry (DSC) technique based on freezing and thawing approach. The non-freezable water can be utilized to select suitable processing and storage conditions for relevant dehydrated and frozen foods.[Citation18] In the DSC technique, the amount of non-freezable water can be determined by measuring the melting enthalpy of ice (freezable bound water and free water) with respect to the water content in the investigated system.[Citation8]
For gelatinized starch-based systems, their freezable and non-freezable water have been extensively characterized as functions of water content,[Citation19,Citation20] botanical origin of starch,[Citation21] amylose-lipid complex,[Citation19] starch modification,[Citation10] and heating temperature.[Citation21] Limited studies are available regarding the influence of starch granular morphology and freezing rate on the formation of ice and water state in starch samples.[Citation19,Citation21,Citation22] Information on the effect of structure or morphology of starch granule on water-binding capacity (or the amount of non-freezable water) can be very useful in predicting phase behavior and properties of food systems under freezing and thawing conditions. As rice flours (RFs) and tapioca starch (TS) are generally used as food ingredients in Thailand and other countries in Asia, the purpose of this study was to investigate the effect of freezing rate on the formation of ice (from freezable bound water and free water) and the amount of non-freezable water on RFs (non-waxy and waxy samples) and TS using the DSC technique. Furthermore, the influence of the different starch granular morphology on the amount of non-freezable water was examined in connection with the observation via optical microscopy. To further elucidate the effect, pregelatinized tapioca starch (PG) was studied and the results were then compared to those of TS. The effect of chemical composition and granular morphology on water-binding capacity, ice formation, and amount of non-freezable water was discussed.
Materials and Methods
Materials
Rice flour, non-waxy (RF), and waxy (WRF), and tapioca starch (TS) (Dragonfish®, Thailand) were purchased from the local supermarket. PG (Pretap®) was kindly supplied by Tapioca Development Corp., Ltd., Thailand.
Material Composition
Moisture content was measured by drying the sample (3 g) in an oven at 105°C for 3 h, according to the method of the Association of Official Agricultural Chemists (AOAC),[Citation23] and was calculated as the percentage of the ratio of the weight difference of sample before and after drying to the weight of sample before drying. Protein content was determined using the modified Kjeldahl method based on AOAC[Citation23] with a protein-nitrogen conversion factor of 5.95 for RF.[Citation24] Amylose content was evaluated using a Megazyme amylose/amylopectin assay kit (Megazyme International, Ireland). All measurements were carried out in triplicate.
Swelling Power and Solubility
Swelling power and solubility were determined using a modified procedure of Lin and coworkers.[Citation25] Dry sample (0.1 g) in 40 mL of deionized water was heated at 120°C in an oil bath while constant stirring for 15 min. The mixture was then centrifuged at 5000 × g for 30 min at 25°C. The sediment was immediately weighed, and then the supernatant was evaporated at 100°C until a constant weight was obtained. Swelling power is calculated from the weight ratio of sediment to the initial weight of dry starch. Solubility is obtained from the weight ratio of dried supernatant to the initial weight of dry starch.[Citation25]
DSC
Ice melting enthalpy was determined from freezing and thawing experiments in a DSC (822e, Mettler Toledo, Schwerzenbach, Switzerland). Appropriate amounts of dry sample and deionized water were mixed directly in a 120 μL stainless steel medium pressure pan to give the systems with the desired water content. In case of low water content, excess water was initially added to the powder to provide the water absorption of all starch particles, and then excess water was subsequently allowed to evaporate until the desired water content was achieved. Water content (WC) was defined as the ratio of mass of water to that of the dry sample.
The pan was sealed with a lid using an O-ring made of polytrifluorochloroethylene (Kel F, 3M) in order to prevent the leakage of water vapor during heating scan. To allow the complete water absorption of starch granules, the sealed pan was kept at 25°C overnight prior to DSC analysis. For DSC measurement, all samples and sealed empty pans as references were first heated from 25°C to the investigated temperatures (i.e., 60, 70, and 120°C) at heating rate of 10°C/min with a nitrogen flow rate of 60 cm3/min, then held at that temperature for 15 min before freezing to –80°C using either freezing rates of –10 or –100°C/min. Such large different freezing rates were used to elucidate an influence of number and size of ice crystals on non-freezable water content. Rapid freezing typically gives glassy ice or very tiny ice crystals. After that, the sample was equilibrated at –80°C for 60 min to ensure the complete formation of ice crystals and finally reheated to 120°C at a constant rate of 10°C/min.
During the first heating scan, all starch samples were completely gelatinized. In the freezing step, or cooling scan, exothermic peak of water crystallization was recorded. Finally, upon reheating (the second heating scan), exothermic peak of cold crystallization and endothermic ice melting peak were analyzed. The amount of non-freezable water (WNFW, g/g dry sample) was determined from an extrapolation of a plot of the normalized ice melting enthalpy (ΔHm, ice) by weight of dry sample against its corresponding WC to zero water content.[Citation8,Citation26]
Optical Microscopy
Flour or starch paste at 7% w/w dry basis was used as a representative of each system. The paste was prepared by heating aqueous suspension of dry sample to the desired temperatures of 60, 70, and 120°C using an oil bath with constant stirring. It was hold at that temperature for 15 min prior to cooling to room temperature (25°C). Then, the cooled paste was loaded onto a glass slide for microscopic examination (AXIOSKOP-POL, Ziess, Germany). Unstained samples were examined under cross polarized light to determine birefringence. Samples stained with Lugol’s iodine solution were examined to distinguish the regions of amylose and amylopectin via enhancing the contrast of a complex between iodine and helical structure of starch.
Statistical Analysis
Experimental results were subjected to statistical analyses using the commercial SPSS 11.5 (SPSS Inc., Chicago, IL) computer program. Data were averaged and mean comparisons were evaluated using the least significant difference (LSD) technique at 95% confidence. A statistical difference at p < 0.05 was considered to be significant.
Results and discussion
Composition of Flours and Starch
shows physicochemical properties, i.e., moisture, amylose, and protein contents, of materials used. Moisture contents of RF, waxy rice flour (WRF) and TS were similar. The amylose content of RF (28.13 ± 0.6%) was much greater than those of TS (17.48 ± 0.55%) and WRF (4.12 ± 0.32%). The protein contents of RF and WRF were 6.30 ± 0.04% and 6.16 ± 0.03%, respectively, while none was detected in TS. In general, a small amount of protein (0.7–1.2%) in TS has been reported since it was removed during starch extraction.[Citation27] When comparing TS and PG, PG had a comparable amylose content (19.00% for PG and 17.50% for TS) to that of TS and its moisture content was lower than that of TS. The protein content of PG was not detected, consistent to that of TS.
TABLE 1 Physicochemical properties and swelling and solubility at 120°C of all studied flour and starch samples
Effect of Freezing Rate and Starch Types on Ice Formation
Samples with total amount of water (WC) from 0.3 to 2.3 g/g dry sample were initially heated from 25 to 120°C. DSC profiles revealed that the conclusion temperature of starch gelatinization peak was below 100°C, suggesting that all samples were fully gelatinized (data not shown). Influence of freezing rate and sample type on ice formation and melting was shown as follows.
Freezing rate of –100°C/min
DSC profile (, , and ) shows that during a very rapid freezing process (–100°C/min), exothermic peak of water freezing was not observed in all studied samples. This suggests that the water may undergo vitrification (or glassy ice formation) without any ice crystal formation during supercooling process.[Citation28] On the second heating, DSC profiles (, , and ) showed an exothermic peak (shown the onset by arrows in the figures) in all systems at low water contents (WC ~ 0.40–0.67), and followed by a broad endothermic peak. The appearance of an exothermic peak during reheating indicated that glassy water could devitrify and subsequently crystallize, i.e., cold crystallization, from nucleation sites created in cooling stage. It has been suggested that devitrification is likely due to the increased polymer mobility when the temperature is suitable to enhance its molecular motion. This causes the decrease in viscosity of the rubbery matrix, thus reducing physical constraints and inducing motion of glassy water to form ice.[Citation21] Zhang and coworkers performed studies using infrared spectroscopic analysis and reported that this cold crystallization was attributed to the transition of glassy water to cubic ice.[Citation29] As WC increased, the cold crystallization peak (Tcc, water) was unnoticeable which was similarly found in the previously investigated starch and flour systems.[Citation5,Citation30,Citation31] Hatakeyma and coworkers[Citation32] investigated cold crystallization of poly(ethylene glycol)-water systems and explained that with increasing WC, molecules of the polymer which associated with glassy water could rearrange more freely, thus Tcc, water shifted to the low temperature side. Moreover, it should be noted that in these studied systems, there was no observation of a baseline change in the second heating scan which corresponded to a heat capacity change due to glass transition temperature.
FIGURE 1. DSC cooling (a, c, e) and the second heating (b, d, f) thermograms of rice flour (RF), waxy rice flour (WRF), and tapioca starch (TS) at various water contents.
The endothermic peak after cold crystallization represented the ice melting, with the onset temperature ≤0°C. Theoretically, the melting of freezable water (Tm, ice) was found below 0°C, whereas Tm, ice of free water was at about 0°C and slightly affected by the polymer matrix.[Citation5,Citation30] In this study, the ice melting peak was observed around 0°C (~3°C at WC = 0.40) and shifted to the higher temperature as WC increased (~20°C at WC = 2.33), where the onset temperature of all systems was below 0°C (see , , and ). The shift of the peak and the end temperatures of ice melting event to high temperature with increasing WC indicated the increase in size of ice crystal.[Citation10]
As seen in , , and , in addition to the main peak, the ice melting peak with a shoulder on the low temperature side was clearly observed in samples with WC ~ 0.6–1.0, indicating the existence of different states of freezable water (freezable bound water and free water).[Citation5,Citation30] However, when WC increased, i.e., WC > 1, ice melting peak became broader, resulting in the disappearance of the peak shoulder. Enthalpy of ice melting (ΔHm, ice), determined by taking into account of the cold crystallization,[Citation8] increased as well with increasing WC, especially at WC ≥ 1, as observed from an increase in size of the ice melting peak. The progressive increase of ΔHm, ice suggests that ice formation of excess (unbound) water existed during freezing period at –80°C (for 60 min). Hatakeyama and coworkers point out that peak temperature and the width of the ice melting peak depended on the matrix of biopolymer and the amount of co-existing water.[Citation30]
Our results indicated that although rapid freezing rate (–100°C/min) exhibited no ice formation during freezing, ice could be formed during frozen storage (60 min at –80°C) and thawing (due to cold crystallization). It has been reported that thawing could potentially deteriorate textural quality of frozen food.[Citation33] To clarify this matter, the experiment on devitrification and ice melting of TS system at WC ~ 2.33 was performed with a shorter frozen storage (2 min) at the final freezing temperature. Similar to our previous observation, no ice crystal (water freezing exotherm) was produced during rapid freezing scan. Unlike the 60-min freezing period, the cold crystallization peak appeared and was noticeably large. Nonetheless, the amount of normalized ice melting enthalpy in both studies was in the same range (ΔHm, ice ~ 280 and 270 J/g water for 2-min and 60-min holding periods, respectively). This means that although ice crystallization did not occur during the process of fast freezing, the presence of excess water could allow ice formation during freezing storage or during reheating (crystallization of glassy water). Therefore, the result herein confirms that the total amount of “frozen” ice was rather constant in all the studied systems and was independent on freezing condition.
Freezing rate of –10°C/min
The investigated samples were thermally scanned using the same heating procedures (for both 1st and 2nd scan) as previous experiment, except that freezing scan was carried out at a slower freezing rate of –10°C/min. At this freezing rate, the distinct exothermic peak of water freezing (Tf, water) was observed (, , and ), which indicated the process of ice crystal growth. However for TS samples at WC ≤ 0.55, the Tf, water was not clearly revealed (). The disappearance of Tf, water might be due to the amount of freezable water in the samples was small and remained in glassy state. , , and indicated that Tf, water was in the similar range (–20 to –30°C) irrespective to sample type and WC, whereas water freezing enthalpy (ΔHf, water) increased with increasing WC. Upon reheating, Tcc, water and Tm, ice were detected (, , and ). The appearance of Tcc, water (its onset shown by an arrow in ) in systems with cooling rate of –10°C/min implied that some parts of water still remained in a glassy state[Citation5] and dependent on WC.[Citation34] When comparing ΔHf, water + ΔHcc, water (enthalpy of cold crystallization) and ΔHm, ice at the corresponding WC, it was found that ΔHm, ice was always larger than ΔHf, water + ΔHcc, water, especially at high water content. This indicated an additional ice formation during frozen storage at –80°C with a 60-min holding period. Particularly in the excessive water systems, large amount of water was available to form ice crystals on the existing ones produced during slow freezing. Similar to the faster freezing rate experiment, Tm, ice shifted toward higher temperature and ΔHm, ice increased with WC.
FIGURE 2. DSC cooling (a, c, e) and the second heating (b, d, f) thermograms of rice flour (RF), waxy rice flour (WRF), and tapioca starch (TS) at various water contents.
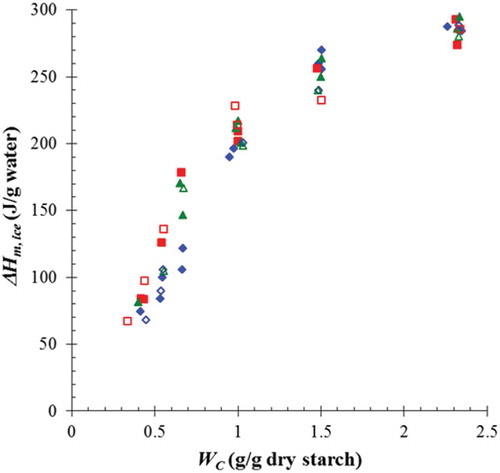
shows a plot of normalized ice melting enthalpy by water weight against water content in samples frozen through both fast and slow freezing rate. No clear difference on the normalized ΔHm, ice was observed among the examined samples for both freezing rates. However, the result showed that at WC ~ 0.5–0.66, the difference in ice melting enthalpy among sample type was apparently noticeable. In this range, RF had the highest value. Since ice melting enthalpy contributed to the amount of frozen water (freezable and free water), the type of sample seemed not to obviously influence on the amount of freezable water when WC > 0.66 due to the presence of excess water and when WC < 0.4 due to the limited water content. Our finding was similar to the previous observation by Tran et al.[Citation10] in the sense that a transition between limited and excessive water content in both native and modified cassava starch systems was detected at 40% moisture content (wwb) or at WC ~ 0.66. Consequently, in excessive water content, most water was available to form ice, whereas in the limited water content, water was mainly bound to starch molecules with a small frozen fraction.[Citation10]
FIGURE 3. Normailized ice melting enthalpy by weight of water as functions of Wc of RF- (square), WRF- (triangle), and TS (diamond)-water systems at the studied freezing rate of –100°C/min (filled symbol) and –10°C/min (unfilled symbol).
Types of starch
Types of starch on ice crystal formation was analyzed using the results from freezing step. In a fast freezing (–100°C/min) process, an exothermic peak of ice crystal growth was not observed in all studied systems since the rate was too fast to allow the water to form ice crystals. On the other hand, the peak appeared in the slow freezing process (–10°C/min) of almost all samples, except TS samples having limited water content (WC ≤ 0.55, see ). No exothermic peak upon freezing of TS with limited water content, i.e., having WC of 0.45 and 0.55, led to a noticeable exothermic cold crystallization peak upon reheating (see ). This observation indicated that TS had a strong water binding ability to bind water, thus prohibiting the formation of ice crystal when the water content was limited. This water binding ability might be related to chemical composition, molecular structure, and starch granule rigidity. Consequently, effect of those factors was identified and discussed in correlation to the formation of ice crystal in the latter section.
In this experiment, we can conclude that first, subjected to a slow freezing process of –10°C/min, TS systems having limited water content can impede the growth of ice crystal. Second, at WC ~ 0.5–0.66 which was a transition between limited and excess water, RF apparently had higher ice melting enthalpy, and thus larger amount of frozen water than WRF and TS. And finally, after carefully freezing the food product using a fast freezing rate, there might still be a risk of the additional ice formation during prolonged-freezing time if the freezing temperature was above the glass transition temperature of the frozen product, and a risk of slow thawing process that cold crystallization of water can take place, resulting in deterioration of food texture quality.
Determination of Non-Freezable Water
The amount of non-freezable water WNFW (g/g dry sample) was determined as the X-intercept through the extrapolation of a plot between the normalized ice melting enthalpy by weight of dry sample and the corresponding WC to ΔHm, ice = 0.[Citation8,Citation26] This value represents the water binding ability of the studied samples. The WNFW from all studied systems and freezing rates are shown in . It was found that WNFW were insignificantly changed for the same sample, regardless of freezing rate condition (0.315 for RF, 0.375 for WRF, and 0.395 for TS and g/g dry sample).
TABLE 2 Non-freezable water weight content (WNFW) of starch-water systems determined by the method described in Lui and Cowman[26]
When comparing between rice samples, RF had lower WNFW value than WRF (), since the non-freezable water is strongly bound to hydrophilic molecules. This observation indicated that RF had the lowest water binding ability. The measurement of swelling ability also revealed the smaller swelling power and solubility values of RF (). Tsai and coworkers[Citation35] suggested that higher swelling power and solubility of starch were the consequences of weaker granule rigidity. This indicated that although RF was heated above the gelatinization temperature, its swelling was rather restricted comparing to the WRF, thus implying the stronger and more rigid granule of RF. The availability of the binding sites of starch toward water molecules was proposed to depend on its structure (molecular arrangement, amorphous, and crystalline regions) and composition (amylose and amylopectin molecules).[Citation36] A previous study by Tananuwong and Reid[Citation21] showed that waxy starch sample had a higher value of WNFW than that of the non-waxy one. Furthermore, as the starch granule is progressively disrupted, more starch components, especially amylopectin, become disentangled and expose their hydroxyl groups to water, thus increasing the starch–water interaction. Their study also pointed out a significant role of amylopectin in controlling the interactions between water and gelatinized starch. Moreover, the study of Hagenimana and Ding concludes that the presence of amylose restricts granular swelling.[Citation37] Therefore, it can be stated here that the lower amylose content in WRF as compared to RF lead to higher swelling power and solubility, which in turn results in higher amount of WNFW, i.e., lower ice formation.
Fu et al.[Citation19] studied starch systems of different degrees of gelatinization and reported that the number of available water binding sites was different among differently treated samples, thus resulting in the varying amounts of non-freezable water content. Full gelatinization, i.e., with more severe disruption of starch granules, could expose more hydroxyl groups of starch to water, thus giving rise to higher value of WNFW when compare to partially gelatinized or ungelatinized starch.[Citation19] In case of TS, the larger swelling and solubility of the starch can be attributed by less compact structure and weaker granular rigidity, allowing more solubilizing and leaching of polymers form the granule,[Citation35,Citation38] thus the highest value of WNFW, i.e., 0.395 g/g dry sample, was achieved.
As WNFW content was strongly influenced by water binding capacity of starch systems which can bind and entrap water within its structure, the effect of granule characteristics was subsequently examined to evaluate the impact of different starch gel morphology, i.e., granular characteristics, on WNFW content. Besides rice samples, TS samples heated to the different temperatures were investigated to determine the influence of different granular morphology on the non-freezable water content which results are shown and discussed in the following section.
Evidence of an Influence of Granular Morphology on Ice Formation and Non-Freezable Water
To investigate the effect of granular characteristics on ice formation and non-freezable water content, TSs at various water contents (WC ~ 0.35 – 2.35) were heated to two different heating temperatures in the first heating scan; i.e., 60°C (below pasting temperature, i.e., representing ungelatinized starch sample) and 70°C (a pasting temperature according to Rapid Visco Analysis [data not shown], i.e., representing partially gelatinized starch sample). All subsequent procedures were identical to the process described as in the fast freezing rate experiment. Similarly, it was found that water crystallization was not observed during fast freezing (–100°C/min). Unlike the fully gelatinized TS sample (heating to 120°C), no cold crystallization peak was detected in partially gelatinized and ungelatinized TS samples upon reheating. Consistently, Tananuwong and Reid did not observe cold crystallization exotherm in partially gelatinized gels from their studied starches.[Citation21] This may be related to a low amount of freezable water that is bound to partially gelatinized and ungelatinized starch molecules frozen in glassy state. However, the ice melting peak was observed and its corresponding enthalpy was used to determine the amount of non-freezable water content (). The determined WNFW contents of the systems heating below and at the pasting temperature were 0.27 and 0.28 g/g dry sample, respectively, which values were lower than that of the fully gelatinized TS system (WNFW ~ 0.40 g/g dry sample). The greater fraction of WNFW in the fully gelatinized TS system was attributed to the complete disruption of starch granules. Accordingly, weak associative bonds in the amorphous region of starch granule were disrupted, enabling increased hydration of starch molecules and exposure of more starch molecules to water.[Citation20,Citation36]
Morphology of starch granules in all studied systems was examined using an optical microscope. With iodine staining, TS granules after heated to 60°C displayed blue color due to the complex formation of iodine and amylose (). A large amount of TS granules remained intact, but some showed slight swelling. Only a few granules were found in the form of swollen granules. For the unstained TS granules, birefringence (Maltese cross) under cross polarized light was observed which suggests that parts of semicrystalline structure were still retained in the granules (shown as inset in ). Upon heating to 70°C, i.e., onset of gelatinization, showed that all TS granules swelled extensively but were still intact and contained disrupted internal ordered structure resulting in the loss of birefringence (not shown). Furthermore, when TS was heated to 120°C (), the granules mostly disrupted and only a few starch ghosts or fragments were observed. The micrograph showed a complete dispersion of leached starch molecules corresponding to large amount of starch solubility (see ). In case of RF sample heated to 120°C, demonstrates the aggregations of wrinkle granules. WRF exhibited completed granule disruption after heated to 120°C (); and few granule fragments were observed. Atkin et al.[Citation39] reported that granule surface, which changed into envelopes and ghost afterward upon heating, comprised of amylopectin as a major component. The degradation of ghost at high temperature created ghost fragments of amylopectin which joined together and were stained purple brown color with iodine solution as observed in . The findings shown in this study suggest that high value of WNFW (or lower ice formation) appears to be connected with the complete dissolution morphology of starch molecule in water, whereas samples exhibiting incomplete gelatinization and the presence of intact swollen granule generally have low WNFW value.
FIGURE 4. Optical micrographs of iodine-stained granules; tapioca starch (TS) granules after heated to 60, 70, and 120°C (a–c, birefringence shown in inset in a), rice flour (RF) and waxy rice flour (WRF) after heated to 120°C (d–e), and pregelatinized tapioca starch (PG) after heated to 70°C (f).
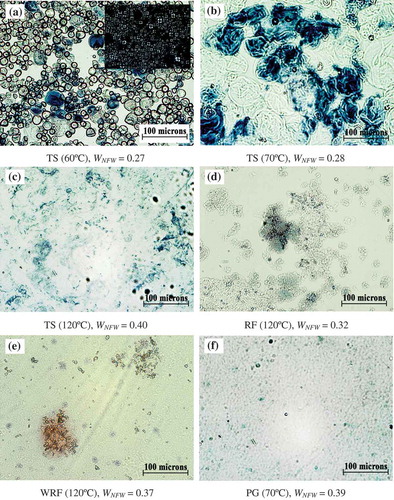
In order to confirm the influence of morphological state of starch dispersion on the amount of non-freezable water content, an additional experiment was performed on PG sample to compare with TS heated to 120°C. Typically, the process of pre-gelatinization causes substantial changes of granular starch resulting in the disruption of molecular orders within the starch granule. Therefore, a high value of granule solubility, i.e., 63.47 ± 1.73%, was obtained when heating PG at 120°C (see ). Nevertheless, heating PG at 70°C gave starch suspension with similar morphology to TS heated to 120°C. (cf. and ). The similar DSC experiment was thus performed on PG dispersion by adjusting the final temperature of the first heating step and the holding heating temperature to 70°C. The WNFW was calculated to be 0.39 for PG heated to 70°C which was much larger than that of partially gelatinized TS heated to 70°C, and was similar to the amount of WNFW in fully gelatinized TS heated to 120°C. The obtained result thus confirms the strong influence of granule morphology on water binding ability of starch molecules or the amount of non-freezable water.
Conclusions
This study examined the formation of ice and determined the amount of non-freezable water (WNFW) of different systems, i.e., RF, WRF, and TS, as influenced by freezing rate (–100 and –10°C/min) and granular morphology based on freezing and thawing experiment by DSC technique. Through slow freezing scan (–10°C/min), ice crystal growth was detected as the presence of exothermic peak, but no ice formation was observed during fast freezing one (–100°C/min). Comparing both freezing rate experiments, the amount of ice melting enthalpy was relatively close in each sample owing to the additional formation of ice during holding period of freezing and the cold crystallization process during reheating. This led to the similar determined WNFW content, irrespective to rate of freezing, in each sample. It is very interesting that systems having water content of ~ 0.50 – 0.66, i.e., in the regime between limited and excessive water, RF had the highest ice melting enthalpy, indicating high amount of freezable water. However, in limited and excess water conditions, type of sample did not clearly provide the difference in amount of freezable water. For systems with complete gelatinization (heated to 120°C), RF had the lowest WNFW since it had the lowest swelling power and solubility upon heating, as a result of strong and rigid granule. Optical micrograph of RF (120°C) demonstrated the presence of many wrinkle RF granules which was believed to be responsible for its low WNFW. On the other hand, TS and WRF showed the comparatively high value of WNFW over RF due to the complete disruption of the granules. Moreover, optical micrograph exhibited the correlation between WNFW and morphology of TS granules when heated to different temperatures. Ungelatinized and partially gelatinized TS samples with intact (swollen) granules yield low value of WNFW. The obtained information can be beneficial in designing frozen foods based on RF and TS to reduce deterioration of food texture under freezing process, freezing storage, and reheating conditions, thus improving their overall quality.
Acknowledgments
The authors are grateful to the Tapioca Development Corp. Ltd. for the provision of pre-gelatinized TS.
Funding
This study was granted by the National Metal and Materials Technology Center (MT-B-55-POL-07-519-I).
Additional information
Funding
References
- Funami, T.; Kataoka, Y.; Omoto, T.; Goto, Y.; Asai, I.; Nishinari, K. Effects of Non-Ionic Polysaccharides on the Gelatinization and Retrogradation Behavior of Wheat Starch. Food Hydrocolloids 2005, 19, 1–13.
- Seetapan, N.; Limparyoon, N.; Gamonpilas, C.; Methacanon, P.; Foungfuchat, A. Effect of Cryogenic Freezing on Textural Properties and Microstructure of Rice Flour/Tapioca Starch Blend Gel. Journal of Food Engineering 2015, 151, 51–59.
- Kasaai, M.R. Use of Water Properties in Food Technology: A Global View. International Journal of Food Properties 2014, 17, 1034–1054.
- Matveev, Yu.I.; Grinberg, V.Ya.; Tolstoguzov, V.B. The Plasticizing Effect of Water on Proteins, Polysaccharides, and Their Mixtures. Glassy State of Biopolymers, Food, and Seeds. Food Hydrocolloids 2000, 14, 425–437.
- Prawitwong, P.; Takigami, S.; Phillips, G.O. Phase Transition Behavior of Sorbed Water in Kanjac Mannan. Food Hydrocolloids 2007, 21, 1368–1373.
- Wolfe, J.; Bryant, G.; Koster, K.L. What Is “Unfreezable Water”, How Unfreezable Is It and How Much Is There. CryoLetters 2002, 23, 157–166.
- Charles, A.L.; Kao, H.M.; Huang, T.C. Physical Investigations of Surface Membrane-Water Relationship of Intact and Gelatinized Wheat-Starch Systems. Carbohydrate Research 2003, 338, 2403–2408.
- Průšová, A.; Šmejkalová, D.; Chytil, M.; Velebný, V.; Kučeík, J. An Alternative DSC Approach to Study Hydration of Hyaluronan. Carbohydrate Polymers 2010, 82, 498–203.
- Li, S.; Dickinson, L.C.; Chinachoti, P. Mobility of “Unfreezable” and “Freezable” Water in Waxy Corn Starch by 2H and 1H NMR. Journal of Agricultural and Food Chemistry 1998, 46, 62–71.
- Tran, T.; Thitipraphunkul, K.; Piyachomkwan, K.; Sriroth, K. Effect of Starch Modifications and Hydrocolloids on Freezable Water in Cassava Starch Systems. Starch/Stärke 2008, 60, 61–69.
- Faroongsarng, D.; Sukonrat, P. Thermal Behavior of Water in the Selected Starch- and Cellulose-Based Polymeric Hydrogels. International Journal of Pharmaceutics 2008, 352, 152–158.
- Hatakeyama, T.; Naoi, S.; Hatakeyama, H. Liquid Crystallization of Glassy Guar Gum with Water. Thermochimica Acta 2004, 416, 121–127.
- Arunyanart, T.; Charoenrein, S. Effect of Sucrose on the Freeze-Thaw Stability of Rice Starch Gels: Correlation with Microstructure and Freezable Water. Carbohydrate Polymers 2008, 74, 514–518.
- Roos, Y.H. Phase Transitions and Transformations in Food Systems. In: Handbook of Food Engineering, 2nd Ed.; Heldman, D.R.; Lund, D.B.; Eds.; Taylor and Francis: Boca Raton, FL, 2007; 287–352.
- Caillet, A.; Cogné, C.; Andrieu, J.; Laurent, P.; Rivoire, A. Characterization of Ice Cream Structure by Direct Optical Microscopy—Influence of Freezing Parameters. Lebensmittel-Wissenschaft und–Technologie 2003, 36, 743–749.
- Sáez, M.I.; Suárez, M.D.; Cárdenas, S.; Martínez, T.F. Freezing and Freezing-Thawing Cycles on Textural and Biochemical Changes of Meagre (Argyrosomus Regius, L) Fillets During Further Cold Storage. International Journal of Food Properties 2015, 18, 1635–1647.
- Chen, G.; Jansson, H.; Lustrup, K.F.; Swenson, J. Formation and Distribution of Ice Upon Freezing of Different Formulations of Wheat Bread. Journal of Cereal Science 2012, 55, 279–284.
- Roos, Y. Characterization of Food Polymers Using State Diagrams. Journal of Food Engineering 1995, 24, 339–360.
- Fu, Z.-Q.; Wang, L.-J.; Zou, H.; Li, D.; Adhikari, B. Studies on the Starch-Water Interactions Between Partially Gelatinized Corn Starch and Water During Gelatinization. Carbohydrate Polymers 2014, 101, 727–732.
- Zhong, Z.; Sun, X.S. Thermal Characterization and Phase Behavior of Corn Starch Studied by Differential Scanning Calorimetry. Journal of Food Engineering 2005, 69, 453–459.
- Tananuwong, K.; Reid, D.S. DSC and NMR Relaxation Studies of Starch-Water Interactions During Gelatinization. Carbohydrate Polymers 2004a, 58, 345–358.
- Tananuwong, K.; Reid, D.S. Differential Scanning Calorimetry Study of Glass Transition in Frozen Starch Gels. Journal of Agricultural Food and Chemistry 2004b, 52, 4308–4317.
- AOAC. Official Methods of Analysis of AOAC International, 17th ed.; Method 981.10, AOAC International: Rockville, MD, 2000.
- WHO. Report of a Joint FAO/WHO Ad Hoc Expert Committee on Energy and Protein Requirements, WHO Technical Report Series No. 522; WHO: Geneva, 1973.
- Lin, J.H.; Pan, C.L.; Hsu, Y.H.; Singh, H.; Chang, Y.H. Influence of Moisture Content on the Degradation of Waxy and Normal Corn Starches Acid-Treated in Methanol. Food Hydrocolloids 2012, 26, 370–376.
- Lui, J.; Cowman, M.K. Thermal Analysis of Semi-Diluted Hyaluronan Solutions. Journal of Thermal Analysis and Calorimetry 2000, 59, 547–557.
- Breuninger, W.F.; Piyachomkwan, K.; Sriroth, K. Tapioca/Cassava Starch: Production and Use. In Starch: Chemistry and Technology, 3rd ed.; BeMiller, J.; Whistler, R.; Eds.; Academic Press: New York, NY, 2009; 541–568.
- Rahman, M.S. State Diagram of Foods: Its Potential Use in Food Processing and Product Stability. Trends in Food Science and Technology 2006, 17, 129–141.
- Zhang, J.M.; Zhang, G.B.; Wang, J.J.; Lu, Y.L.; Shen, D.Y. Infrared Spectroscopic Study on the Crystallization of Water in Poly(Vinyl Methyl Ether) Aqueous Solution During Heating. Journal of Polymer Science, Part B: Polymer Physics 2002, 40, 2772–2779.
- Hatakeyama, T.; Tanaka, M.; Hatakeyama, H. Studies on Bound Water Restrained by Poly(2-Methacryloyloxyethyl Phosphorylcholine): Comparison with Polysaccharide-Water Systems. Acta Biomaterialia 2010, 6, 2077–2082.
- Huang, R.; Chang, W.; Chang, Y.; Lii, C. Phase Transitions of Rice Starch and Flour Gels. Cereal Chemistry 1994, 71, 202–207.
- Hatakeyama, T.; Kasuga, H.; Tanaka, M.; Hatakeyama, H. Cold Crystallization of Poly(Ethylene Glycol)-Water Systems. Thermochimica Acta 2007, 465, 59–66.
- Zhu, S.; Ramaswamy, H.S.; Simpson, B.K. Effect of High-Pressure Versus Conventional Thawing on Color, Drip Loss, and Texture of Atlantic Salmon Frozen by Different Methods. Lebensmittel-Wissenschaft und—Technologie 2004, 37, 291–299.
- Suzuki, S.; Kitamura, S. Unfrozen Water in Amylosic Molecules Is Dependent on the Molecular Structures—A Differential Scanning Calorimetric Study. Food Hydrocolloids 2008, 22, 862–867.
- Tsai, M.L.; Li, C.F.; Lii, C.Y. Effect of Granular Structures on Pasting Behavior of Starches. Cereal Chemistry 1997, 74, 750–757.
- Wootton, M.; Bamunuarachchi, A. Water Binding Capacity of Commercial Produced Native and Modified Starches. Starch/Stärke 1978, 30, 306–309.
- Hagenimana, A.; Ding, X. A Comparative Study on Pasting and Hydration Properties of Native Rice Starches and Their Mixtures. Cereal Chemistry 2005, 82, 70–76.
- Tiwari, B.; Singh, N. Pulse Chemistry and Technology; Royal Society of Chemistry: Cambridge, UK, 2012; 122.
- Atkin, N.J.; Abeysekera, R.M.; Robards, A.W. The Events Leading to the Formation of Ghost Remnants from the Starch Granule Surface and the Contribution of the Granule Surface to the Gelatinization Endotherm. Carbohydrate Polymers 1998, 36, 193–204.