
 ?Mathematical formulae have been encoded as MathML and are displayed in this HTML version using MathJax in order to improve their display. Uncheck the box to turn MathJax off. This feature requires Javascript. Click on a formula to zoom.
Abstract
The aims of this study were quantitative determination of the bio-active compounds and to evaluate the in vitro antioxidant activities of methanolic extract of soy mixed wheat flour and traditional wheat flour. Soy mixed wheat flour was developed by combination of processed soy flour and wheat flour. Total phenolics, flavonoids, tannin, and proanthocyanidin contents of the crude methanolic extract were determined by ultraviolet-visible spectrophotometer. Further individual bio-active compounds were determined by high-performance liquid chromatography-diode array detector and showed (+)-catechin, vanillic acid, caffeic acid, (–)-epicatechin, p-coumaric acid, rutin hydrate, and ellagic acid in soy mixed wheat flour but only rutin in traditional wheat flour. The soy mixed product showed significantly higher concentration of bio-active compounds than traditional wheat flour. Antioxidative activities were measured through different in vitro models: phosphomolybdenum blue method, FeCl3 reducing power, ABTS scavenging activity, 2,2′-azino-bis(3-ethylbenzothiazoline-6-sulfonic acid) scavenging activity, N,N-dimethyl-1,4-diaminobenzene free radical scavenging activity, reducing power, metal chelating power and super oxide scavenging ability. All results of in vitro antioxidant models revealed that the soy product showed significantly higher antioxidant activities than traditional wheat flour. These results suggested that soy mixed wheat flour can play the greater roles than the traditional wheat flour for different physiological activities in human body due to the presence of greater amount of bio-active compounds and can be considered as a potential antioxidant containing flour for human consumption than the traditional wheat flour.
Keywords:
INTRODUCTION
Wheat flour is one of the major conventional ingredients in bread making due to its gluten content, which is responsible for the elasticity of the dough by causing it to extend. Soybean (Glycine max) is a leguminous vegetable of the pea family that grows in the tropical, subtropical, and temperate climates. It is an important oil seed that contains about 44.6% crude protein and is eaten in processed form. High protein energy foods have been developed from soy beans. It is reported as a food that contains all the nutrients that the body needs.[Citation1] The multiple health benefits of soy supplements have been extensively studied. The glycemic index of soy products are low and are valuable foods to be included in a diabetic diet.[Citation2] Many studies have suggested soy may promote weight loss via several mechanisms including inhibition of adipogenesis, appetite suppression, displacement of fat intake, and increased satiety.[Citation3] Soy contains isoflavones that are considered to be essential for the healthy functioning of bowels, heart, kidney, liver, and stomach.[Citation4] The superiority of soy protein regarding the capability to reduce blood cholesterol compared to animal derived proteins has also been documented.[Citation5] Soy protein exerts several anti-atherogenic effects and it decreases low density lipoprotein (LDL) cholesterol significantly. Soy has also been shown to increase insulin sensitivity and to prevent the development of diabetes.[Citation6] Dietary fiber, protein, and its constituent isoflavones support its role in the improvement of glycaemic control.[Citation2] Soy also constituents’ benefits mostly relate to the reduction of menopause symptoms and the reduction of the risk for several chronic diseases such as cancer andosteoporosis.[Citation7] These activities are present in soy due to present of some bioactive compounds. Unprocessed soy flour is not directly edible, therefore, we developed a combination of processed edible soy flour (18%) and wheat flour (72%) and combination of this flower is called soy mixed wheat flour (SMWF). It is hypothesized that processed soy, which is used in SMWF preparation, will enhance the nutritional value of the product which is consumed by all age groups. Because soy has many physiological activities than wheat, we hope that this SMWF also have many physiological activities. We, therefore, investigated bio-active compounds and antioxidative effects of the extract of SMWF by the phosphomolybdenum blue method, FeCl3 reducing power (FRAP), ABTS scavenging activity, 2,2′-azino-bis (3-ethylbenzothiazoline-6-sulfonic acid) (DPPH) scavenging activity, N,N-dimethyl-1,4-diaminobenzene (DMPD) free radical scavenging activity, reducing power, metal chelating power, and super oxide scavenging ability.
Materials and methods
SMWF and Collection of Traditional Wheat Flour (TWF)
The SMWF was developed in our laboratory. We used the ethanol extract of SMWF for in vitro antioxidant activities and quantitative determination of bio-active compounds. TWF was collected from local market and used for comparative analysis with our developed SMWF.
Chemicals and reagents
Folin-Ciocalteau reagent, DPPH, ferric chloride, ascorbic acid, and tannic acid were purchased from Sigma Co. (St. Louis, MO, USA). Methanol, hydrochloric acid, sodium hydroxide, aluminium chloride, sodium carbonate, and potassium ferricyanide were purchased from Merck, Darmstadt, Germany. Gallic acid (GA), (+)-catechin hydrate (CH), vanillic acid (VA), caffeic acid (CA), (-)-epicatechin (EC), p-coumaric acid (PCA), rutin hydrate (RH), ellagic acid (EA), and querecetine (QU) have purchased from Sigma-Aldrich (St. Louis, MO, USA). High-performance liquid chromatography (HPLC) grade acetonitrile, acetic acid, and ethanol was obtained from Merck (Darmstadt, Germany). All the chemicals and reagents were of analytical grade.
Extraction of the Samples
Samples were extracted according to our previous study.[Citation8] A total of about 50.0 g of SMWF and TWF were taken for hydrophilic phenolic extraction, using methanol as a solvent, by vortex (VM-1000) for a few minutes, mechanical shaking for 4 h, and finally sonication (YJ5120-1) for 20 min with 250 mL methanol. Methanol extract was obtained by filtering the mixture through Whatman No. 1 filter paper and the supernatants of both SMWF and TWF used in the rotary evaporator Eyela for extract yield. The extraction was repeated three times with each sample. The yields of the extracts were 3.54 and 3.38% of SMWF and TWF, respectively.
Determination of Total Phenolics
The amount of total phenolic content was determined by previous study with some modifications.[Citation9] A 0.5 mL of extract (concentration of extract is 1.0 mg/mL) and 0.5 mL of Folin–Ciocalteu reagent (0.5 N) were mixed and incubated at room temperature for 5 min. Then 2.0 mL saturated sodium carbonate was added and the final volume was made up to 10 mL. It was further incubated for 30 min at room temperature and the absorbance was measured at 765 nm. GA was used as positive control. The content of total phenolics was determined by using the linear equation of GA as a standard and results are expressed as gallic acid equivalents (GAEs).
Determination of Flavonoid
The measurement of the total flavonoid concentration was determined by the aluminium chloride method using catechin as a standard.[Citation10] The test sample (01 mL) of and 4 mL of water were added to a volumetric flask (10 mL volume). After 5 min, 0.3 mL of 5% sodium nitrite, 0.3 mL of 10% aluminium chloride was added. Two milliliters of 1 M sodium hydroxide was added to the reaction mixture followed by 6 min incubation at room temperature. Immediately following, the final volume was made up to 10 mL with distilled water. The absorbance of the reaction mixture was measured at 510 nm against a blank spectrophotometrically ultraviolet-visible (UV-VIS; Specord 205). Total flavonoid content was calculated as catechin equivalents (mg/100 g) using the equation based on the calibration curve.
Determination of Total Tannin
Quantitative estimation of tannin was carried out using the method described by Grubesic et. al.[Citation11] with some modification. The total content of tannins adsorbed by casein was determined using Folin-Ciocalteu reagent (FCR). About 10 mL (100 μg/mL) of extract solution (solution 1, S1) was mixed with 100 mg of casein with shaking for 2 h (adsorption of tannins) and then filtered (solution 2, S2). The total phenolics contents for both solutions S1 and S2 using Folin‐Ciocalteu’s method as described previously. The difference between absorbance of S1 and S2 correspond to concentration casein adsorbed tannins in sample. All determinations were carried out in triplicates. The total casein-adsorbed tannins are expressed as the number of equivalents of tannic acid (TAE) using the equation based on the calibration curve.
Determination of Proanthocyanidin
Quantitative estimation of proanthocyanidins was carried out using the modified vanillin–HCl method.[Citation12] Vanillin reagent (0.5%, 5 mL) was added to the extract (1 mL concentration) and the absorbance of the color developed after 20 min at 30°C was read at 500 nm. A standard curve was prepared expressing the results as catechin equivalents, i.e., amount of catechin (mg/100 g) which gives a color intensity equivalent to that given by proanthocyanidins after correcting for blank. Proanthocyanidins content was calculated as catechin equivalent (mg/100 g) using the equation based on the calibration curve.
HPLC System for Bioactive Compounds Determination
Chromatographic analyses were carried out on a Thermo Scientific Dionex UltiMate 3000 Rapid Separation LC (RSLC) systems (Thermo Fisher Scientific Inc., MA, USA), coupled to a quaternary rapid separation pump (LPG-3400RS), Ultimate 3000RS auto samplier (WPS-3000), and rapid separation diode array detector (DAD-3000RS). Phenolic compounds were separated on an Acclaim® C18 (4.6 × 250 mm; 5 µm) column (Dionix, USA) which was controlled at 30°C using a temperature controlled column compartment (TCC-3000). Data acquisition, peak integration, and calibrations were performed with Dionix Chromeleon software (Version 6.80 RS 10).
Chromatographic Conditions
The phenolic composition of the methanolic extract of SMWF and TWF were determined by HPLC, as described by Chuanphongpanich and Phanichphant, and Khairul et al. with some modifications.[Citation13,Citation14] The mobile phase consisted of acetonitrile (solvent A), acetic acid solution pH 3.0 (solvent B), and methanol (solvent C). The system was run with the following gradient elution program: 0 min, 5%A/95% B; 10 min, 10%A/80%B/10%C; 20 min, 20%A/60%B/20%C and 30min, 100%A. There was a 5 min post-run at initial conditions for equilibration of the column. The flow rate was kept constant throughout the analysis at 1 mL/min and the injection volume was 20 µL. For UV detection, the wavelength program was optimized to monitor phenolic compounds at their respective maximum absorbance wavelengths as follows: λ 280 nm held for 18.0 min, changed to λ 320 nm and held for 6 min, and finally changed to λ 380 nm and held for the rest of the analysis and the DAD was set at an acquisition range from 200 to 700 nm.
Preparation of Standard and Sample
A stock standard solution (100 µg/mL) of each phenolic compound was prepared in methanol by weighing out approximately 0.0050 g of the analyte into 50 mL volumetric flask. The mixed standard solution was prepared by dilution the mixed stock standard solutions in methanol to give a concentration of 20 µg/mL for each polyphenols except CA (8 µg/mL) and QU (6 µg/mL). All standard solutions were stored in the dark at 5°C and were stable for at least 3 months. The calibration curves of the standards were made by serial dilution of the stock standards (five set of standard dilutions) with methanol to yield 1.25–20 µg/mL for GA, CH, VA, EC, PCA, RH, EA; 0.5–8.0 µg/mL for CA, and 0.375–6.0 µg/mL for QU. The calibration curves were constructed from chromatograms as peak area versus concentration of standard. A solution of methanolic extract of SMWF and TWF at a concentration of 5 mg/mL were prepared in ethanol by vortex mixing (Branson, USA) for 30 min. The samples were stored in the dark at a low temperature (5°C). Spiking the sample solution with phenolic standards was done for additional identification of individual polyphenols. Prior to HPLC analysis, all solutions (mixed standards, sample, and spiked solutions were filtered through 0.20 µm nylon syringe filter (Sartorius, Germany) and then degassed in an ultrasonic bath (Hwashin, Korea) for 15 min.
Total Antioxidant Capacity Determination by Phosphomolybdenum Method
The determination of total antioxidant activity have done using the phosphomolybdenum blue method with slight modifications.[Citation15] The basic principle of the assay is based on the reduction of Mo (VI) to Mo (V) by the extract and subsequent formation of a green phosphate Mo (V) complex at acidic pH. A 0.3 mL extract was combined with a mixture of 3 mL of reagent solution (0.6 M sulfuric acid, 28 mM sodium phosphate, and 4 mM ammonium molybdate). The tubes containing the reaction solution were then capped and incubated at 95°C for 90 min. After the samples had cooled to room temperature, the absorbance of the solution was then measured at 695 nm against blank. Methanol (0.3 mL) in the place of extract is used as the blank. The antioxidant activity is expressed as the mg of equivalent of ascorbic acid.
Total Antioxidant Determination by FRAP Method
FRAP assay was carried out according to the previous study with some modification.[Citation16] FRAP reagent was prepared from acetate buffer (1.6 g sodium acetate and 8 mL acetic acid makeup to 500 mL; (pH 3.6), 10 mM TPTZ solution in 40 mM HCL and 20 mM iron (III) chloride solution in proportion of 10:1:1(v/v), respectively. The FRAP reagent was prepared fresh daily and was warmed to 37°C in oven prior to use. A total of 200 μL of samples extract were added to 4 mL of the FRAP reagent and mixed well. The absorbance was measured at 593 nm using UV-VIS spectrophotometer (UV-VIS specord 205). Samples were measured in three replicates. Standard curve of ascorbic acid (125, 250, 500, 750, and 1000 μmol) and GA were prepared using a similar procedure.
DPPH Free Radical Scavenging Activity
Radical-scavenging activity was determined by use of stable DPPH free radical according to the procedure reported by Katalini´c et al. with some modifications.[Citation17] Briefly, the reaction mixture (3.0 mL), consisting of 2.0 mL of DPPH in methanol (0.004%) and 1.0 mL of various concentrations of the extract, is incubated for 10 min in dark, then the absorbance is measured at 517 nm against methanol as a blank and control is prepared by DPPH and methanol in place of sample extract. In this assay, the positive control is ascorbic acid. The percentage of inhibition can be calculated using the formula:
where A0 is the absorbance of control and A1 is the absorbance of test.
ABTS free radical scavenging activity
ABTS free radical scavenging activity was carried out according to the method reported by Jiri Sochor et al. with some modification.[Citation16] Seven mmol·L-1 ABTS• and 4.95 mmol·L-1 potassium peroxodisulphate are mixed and dissolved in distilled water. The solution is then diluted with distilled water in a 1:9 v/v ratio (10 mL is quantitatively transferred into 100 mL calibrated flask and diluted). The solution is incubated for 12 h in the dark, the reagent is usable for 7 days if stored in the dark at 4°C. Briefly, the reaction mixture (3.5.0 mL) consisting of 3.0 mL of ABTS and 0.50 mL of various concentrations of methanol extract. It is incubated for10 min in the dark, then the absorbance is measured at 734 nm against distilled water as a blank and control is prepared by ABTS reagents and distilled water in place of sample extract. In this assay, the positive control is GA. The percentage of inhibition can be calculated using the formula:
where A0 is the absorbance of control and A1 is the absorbance of test.
DMPD Free Radical Scavenging Activity
DMPD assay was carried out according to the method reported by Jiri Sochor et al. with some modification.[Citation16] The compound DMPD is converted in solution to a relatively stable and colored radical form by the action of ferric salt. After addition of a sample containing free radicals, these are scavenged and as a result of this scavenging, the colored solution is decolorized.[Citation18,Citation19]
Sodium acetate buffer (1) in distilled water (0.2 mol·L-1, pH 5.25 adjusted with concentrated acetic acid) and 0.74 mmol·L-1 ferric chloride (2) in distilled water were prepared. 36.7 mmol·L-1 DMPD (3) is dissolved in distilled water and solution was prepared. DMPD solution must be prepared at the time of use due to its low stability. These three solutions (solutions No. 1, 2, and 3) are mixed in a 20:1:1 (v/v/v) ratio. The reaction mixture (4.0 mL) consist of 3.0 mL of DMPD and 1.0 mL of various concentrations of methanol extract of both SMWF and TWF. It is incubated for 6 min, then the absorbance is measured at 505 nm against distilled water as a blank and control is prepared by DMPD reagents and sodium acetate buffer in place of sample extract. In this assay, the positive control is GA and ascorbic acid. The percentage of inhibition can be calculated using the following formula:
where A0 is the absorbance of control and A1 is the absorbance of test.
Reducing Power Assay
The reducing power was carried out according to previous study with some minor modification.[Citation20] Various concentrations of the plant extracts in respective solvent were mixed with phosphate buffer (2.5 mL) and potassium ferricyanide (2.5 mL). This mixture was kept at 50°C in water bath for 20 min. After cooling, 2.5 mL of 10% trichloroacetic acid was added and centrifuged at 3000 rpm for 10 min whenever necessary. The upper layer of solution (2.5 mL) was mixed with distilled water (2.5 mL) and a freshly prepared ferric chloride solution (0.5 mL). The absorbance was measured at 700 nm. Control was prepared in similar manner excluding samples. Ascorbic acid at various concentrations was used as standard. Increased absorbance of the reaction mixture indicates increase in reducing power. EC50 is a concentration of the extract or standard to require absorbance is 0.50.
Super Oxide Scavenging Activity by Alkaline Dimethyl Sulfoxide (DMSO)
Super oxide scavenging assay by alkaline DMSO was carried out according to the method of Kunchandy and Rao with some modification.[Citation21] The superoxide radical was generated by the addition of sodium hydroxide to air saturated DMSO. The reduction of nitro blue tetrazolium (NBT) by superoxide was determined in the presence and absence of the extracts. To the reaction mixture containing 1 mL of alkaline DMSO, 2.0 mL of the samples and standard was added in DMSO at various concentrations followed by 0.1 mL of NBT (1 mg/mL) to give a final volume of 3.1 mL. Control is prepared by alkaline DMSO and DMSO in place of sample extract. In this assay, the positive control is GA. The absorbance was measured at 560 nm and the percentage of inhibition can be calculated using the following formula:
where A0 is the absorbance of control and A1 is the absorbance of test.
Metal Chelating Activity
The chelation of ferrous ions is estimated using the method reported by our previous research article.[Citation15] Four milliliters of the different concentration of extract is added to a solution of 0.2 mL ferrous chloride (2 mM). The reaction is initiated by the addition of 0.2 mL of ferrozine (5 mM) and incubated at room temperature for 10 min and then the absorbance is measured at 562 nm. EDTA was used as a positive control. The percentage of metal chelating activity can be calculated using the following formula:
where A0 is the absorbance of control and A1 is the absorbance of test.
Statistical Analysis
All the experiments were carried out in triplicate, and the results were expressed as mean ± standard deviation (SD). The data were statistically analyzed by using the Student’s t-test. For all comparisons, P < 0.05 was considered statistically significant.
Results
Total Phenolics, Flavonoid, Tannin, and Proanthocyanidins in SMWF and TWF
Results of the investigation of the total phenolics, flavonoid, tannin, and proanthocyanidins are tabulated in . The contents of total phenolics in SMWF and TWF are 59.74 ± 0.46 mg and 18.84 ± 0.27 mg GAE/100 g fresh products, respectively. SMWF contained significantly (p < 0.001) higher total phenolics than TWF. Total flavonoids are also determined and found that, SMWF contains 26.48 ± 0.48 mg catechin equivalent flavonoids in 100 g product. On the other hand TWF contains 14.97 ± 0.81 mg catechin equivalent flavonoids per 100 g product. The content of flavonoids are significantly (p < 0.01) higher in SMWF than the TWF. Tannin is another antioxidant compound found in both products. The SMWF contains 7.03 ± 0.46 mg tannic acid equivalent tannin/100 g product but TWF contains 3.04 ± 0.10 mg tannic acid equivalent tannin/100 g product. Tannin is also significantly (p < 0.01) higher in developed product than TWF. Proanthrocyanidins are present in SMWF but not in TWF. The content of proanthrocyanidins in SMWF is 12.41 ± 1.36 mg catechin equivalent per 100 g product.
TABLE 1 Spectrophotmetric determination of the phytochemicals of both SMWF and TWF extracts (n = 3)
Bioactive Compounds Determinations by HPLC
By applying the HPLC method, a successful identification and quantification of (+)-catechin, VA, CA, EC, PCA, rutin, and EA were performed. The content of each phenolic compound was calculated from the corresponding calibration curve and results were presented in . The experimental results indicated that an especially high concentration of EA (727.18 ± 2.66 mg) and EC (166.42 ± 2.47 mg) andmoderate concentration of (+)-catechin (9.20 ± 0.06 mg), VA (11.31 ± 0.13 mg), CA (9.72 ± 0.10 mg), PCA (3.35 ± 0.16 mg), and rutin (39.44 ± 1.38 mg) in 100 g of dry extract of SMWF. The other polyphenolic compounds were not detected in the methanol extract of SMWF. Only rutin was found in TWF extract and showed that the concentration is 22.28 mg/100 g dry TWF extract.
TABLE 2 Contents of polyphenolic compounds in the methanol extract of the SMWF (n = 5)
Determination of Total Antioxidant Capacity by Phosphomolybdenum Blue Method and FRAP
presents the antioxidant capacities of extracts obtained from SMWF and TWF, evaluated in two antioxidant activity assays: Phosphomolybdenum blue method and FRAP. In the FRAP assay, both GA and ascorbic acid were used as a standard and total antioxidant capacities determined as GAE and ascorbic acid equivalent in 100 g fresh products. In both methods, the total antioxidant capacity of the SMWF extract is significantly (p < 0.001) higher than the TWF extract (). The FRAP assay is quick and simple to perform and reaction is reproducible and linearly related to the molar concentration of the antioxidants present. Phytochemicals components present in the extract contributed the main antioxidant activities. Higher phenolics contents mostly serve the plant material to act as antioxidative agent.
TABLE 3 Determination of total antioxidant capacity in phosphomolyb-denum method and FRAP assay
Determination of Free Radical Scavenging Capacity
DPPH scavenging activity
DPPH scavenging assay is one of the most prominent antioxidant method for determination of the radical scavenging activity. When DPPH converts to 2, 2-diphenyl-1-picryl hydrazine its purple color converted to yellow color due to contact with a hydrogen donor. The IC50 for DPPH inhibition was 26.75 ± 1.73 mg fresh product/mL and 52.07 ± 2.77 mg fresh product/mL (n = 3) for SMWF and TWF, respectively. Activity of SMWF is significantly (p < 0.01) higher than TWF. Ascorbic acid was used as a standard and IC50 of ascorbic acid was 12.55 ± 0.32 µg/mL ().
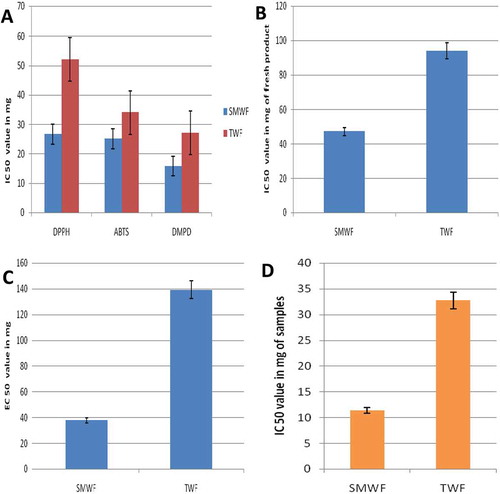
FIGURE 1 (a) Comparative IC 50 analysis of SMWF and TWF in free radical (DPPH, ABTS and DMPD) scavenging assay; (b) Comparative IC 50 analysis of SMWF and TWF in metal chelating activity (p < 0.001); (c) Comparative EC50 analysis of SMWF and TWF in reductive capacity (p < 0.001); (d) Comparative IC50 analysis of SMWF and TWF in super oxide scavenging activity (p < 0.001).
ABTS scavenging activity
The activity of extracts was found to be increased in a dose-dependent manner at different concentrations. The IC50 value of SMWF is 25.13 ± 1.06 mg fresh product/mL and TWF IC50 is 34.03 ± 0.49 mg fresh product/mL (n = 3). The activity of SMWF is significantly (p < 0.01) higher than the TWF. GA was used as a standard and the standard exhibited IC50 was 4.91 ± 0.07 µg/mL ().
DMPD scavenging activity
DMPD assay is particularly suitable for hydrophilic antioxidants, but is less sensitive to hydrophobic bioactive compounds. SMWF and TWF extracts were analyzed for the ability to scavenge the DMPD radicals. The DMPD•+ radical quenching was found to increase with an increase in concentration of the extract. The IC50 value of the SMWF extract was found to be 15.86 ± 0.44 mg fresh product/mL which was significant (p < 0.01) compared to that of TWF extract is 27.12 ± 1.88 mg fresh product/mL (n = 3; ). GA was used as a standard and IC50 is 32.65 ± 0.58 µg/mL.
Metal chelating activity
The iron chelating effect (IC50) of extracts and chelating agent were calculated from regression analysis. The IC50 value of SMWF extract and TWF extract were found to be 47.34 ± 1.02 mg fresh product/mL and 94.08 ± 1.75 mg fresh product/mL (n = 3), respectively. The activity of SMWF is significantly (p < 0.001) higher than the TWFIC50 value of reference chelating agent ethylenediaminetetraacetic acid (EDTA) were found to be 38.55 ± 1.28 µg/mL ().
Reductive capacity
In this assay, Fe3+ was transformed to Fe2+ in the presence of both extracts and the reference compound is ascorbic acid. The reducing power was found to be increased with increasing the concentration of both extracts and the reference compound (at 700 nm). A highly significant (p < 0.001) EC50 value of SMWF (37.83 ± 0.76 mg fresh product/mL) was found than the EC50 value of TWF (139.25 ± 1.32 mg fresh product/mL; ).
Superoxide scavenging activity
Superoxide radical scavenging activity of extracts was assessed by alkaline DMSO method and both extracts strongly inhibited the superoxide radical generation but IC50 value of SMWF is significantly (p < 0.001) higher than the IC50 value of TWF. Superoxide scavenging assay was measured in context of inhibition concentration. Regression analysis for both extracts and GA are plotted and IC50 values were calculated from regression equations. The IC50 value of SMWF is 11.36 ± 0.83 mg fresh product/mL, but TWF IC50value is 32.75 ± 0.43 mg fresh product/mL (n = 3) that is almost three times higher when compared with SMWF (). GA was used as a standard compound and IC50 value was found 75.26 ± 1.02 µg/mL.
Discussion
Total phenolics, flavonoid, tannin, and proanthocyanidins are predominantly higher in SMWF than in the TWF (). A range of spectrophotometric and chromatographic assays was applied to create a data base that could be used to evaluate the potential of flour as an inexpensive and accessible natural resource for the production of polyphenol-rich flour with strong bio-active compound and antioxidant activity ( and ). The bio-active compound composition and potential antioxidant activities are also significantly higher in SMWF than in the TWF (). The significant amount of bio-active compounds in SMWF indicated that the extract could be a prime source of antioxidant. Proanthocyanidins are considered to play exciting antiatherosclerotic effects which are also promoted by antioxidative agent.[Citation15] This soy product have higher amount of bio-active compounds which are responsible for health benefits such as scavengers of reactive or toxic chemicals; compounds that enhance the absorption and or stability of essential nutrients; neuroprotective, hypotensive, prevent aging, diabetes, osteoporosis, cancer, and heart diseases, induce apoptosis, diuretic, central nervous system (CNS) stimulant, analgesic, protects from ultraviolet B (UVB)-induced carcinogenesis, immuno-modulator, and carminative.[Citation23–Citation25]
Phosphomolybdenum assay is a quantitative method to evaluate water-soluble and fat-soluble antioxidant capacity (total antioxidant capacity), and from the results it is evident that the extracts of SMWF has a greater electrondonating capacity than the TWF and thus, it may act as a great radical chain terminators, transforming reactive free radical species into more stable non-reactive products.[Citation26] FRAP is a simple and direct test of antioxidant capacity. The reducing power of a compound may serve as a significant indicator of its potential antioxidant activity.[Citation27] In this study, the FRAP of extracts were compared with a reference agent ascorbic acid and GA demonstrating that the extract of SMWF () has very good status of FRAP than the TWF.
DPPH is a stable free radical and accepts an electron or hydrogen radical to become a stable diamagnetic molecule and it will be discolored from purple to yellow.[Citation28,Citation29] The ABTS radical method is based on the neutralization of a radical-cation arising from the one-electron oxidation of the synthetic chromophore 2,2‘-azino-bis(3-ethylbenzothiazoline-6-sulfonic acid; ABTS•): ABTS• – e- ABTS•+. This reaction is monitored spectrophotometrically by the change of the absorption spectrum. DMPD can form a stable and colored radical cation (DMPD•+) at acidic pH and in the presence of a suitable oxidant solution. Therefore, this assay reflects the ability of radical hydrogen-donors to scavenge the single electron from DMPD•+.[Citation30] We got IC50 values in these three free radical scavenging assays and found that antioxidant activities are higher for SMWF than the TWF ().
The reducing power of iron is greatly higher in SMWF than the TWF and metal chelating activities are significantly also higher in SMWF than in TWF (). The reducing power and metal chelating activities of extract was relatively more prominent due to the presence of some reducing agents. Iron causes lipid peroxidation and decomposes the lipid hydroxide into peroxyl and alkoxyl radicals that can lead the chain reactions.[Citation31] Reductants present in extract are responsible for reducing capacity, which are involved in the prevention of chain initiation, binding of metal ions, decomposition of peroxides, and radical scavenging.[Citation32,Citation33] Therefore, this soy-based product is more beneficial to health than the TWF.
The superoxide is physiologically produced by either an enzymatic system for a biological purpose or by a leak of electrons from the respiratory chain.[Citation34] Superoxide generates more dangerous species, including singlet oxygen and hydroxyl radicals, which cause the lipids peroxidation.[Citation35] Superoxide anions are reacting with DNA bases, amino acids, proteins, and polyunsaturated fatty acids of tissue, thereby inducing tissue damage by its toxic effects. SMWF contains large amount of bioactive compounds those have antioxidant properties via scavenging of superoxide anion radical.[Citation30] Antioxidant or bioactive compounds of SMWF supplementation or treatment has been adopted for either prevention of or protection against several disorders and pathophysiological conditions.[Citation36] The bioactive compounds of SMWF may have immunomodulatory and anti-inflammatory effects.[Citation37,Citation38]
CONCLUSIONS
This edible SMWF contains bioactive compounds, antioxidants, and it has also potential antioxidant activities. The bioactive compounds of SMWF were tannin; (+)-catechin, VA, CA, EC, PCA, RH, and EA, whereas only rutin was found in TWF. The present study showed that antioxidant activities of SMWF are higher than that of the TWF. Furthermore, in vivo studies should be carried out to prove that the significantly higher antioxidant activities and bioactive compound contents of the SMWF could be a beneficiary prominent daily food item for many physiological activities of the mass population for maintaining their healthy life.
Acknowledgments
The authors wish to thank Benison Food Products Ltd., Gazipur, Bangladesh for signing agreement with the IFST, BCSIR for running this research.
FUNDING
This work was carried out as a sponsored project under the research and development (R and D) project of the Bangladesh Council of Scientific and Industrial Research (BCSIR).
Additional information
Funding
REFERENCES
- Bibiana, I.; Doris, A.; Sule, S. Proximate Composition, Functional, and Sensory Properties of Bambara Nut (Voandzeia Subterranean), Cassava (Manihot Esculentus) and Soybean (Glycine Max) Flour Blends for “Akpekpa” Production. Current Research in Nutrition and Food Science 2013, 1(2), 147–155.
- Perera, M.; Sivakanesan, R.; Abeysekara, D.; Sarananda, K. Sensory Evaluation, Proximate Analysis and Available Carbohydrate Content of Soy Flour Incorporated Cereal Based Traditional Sri Lankan Breakfast Foods. International Journal of Research in Agriculture and Food Sciences 2014, 1(4), 10–19.
- Ji-Eun, K.; Seon-Min, J.; Ki, H.P.; Woo-Song, L.; Tae-Sook, J.; Robin, A.M.; Myung-Sook, C. Does Glycine Max Leaves Or Garcinia Cambogia Promote Weight-Loss Or Lower Plasma Cholesterol in Overweight Individuals: A Randomized Control Trial. Nutrition Journal 2011, 10(94), 1–11.
- Perkins, G. Composition of Soybeans and Soybeans Products. Practical Handbook of Soybean Processing and Utilization; AOAC Press: Salt Lake City, UT, USA, 1973; 9–28.
- Desroches, S.; Mauger, J.; Ausman, L.; Lichtenstein, A.; Lamarche, B. Soy Protein Favorably Affects LDL Size Independently of Isoflavons in Hypercholesterolemic Men and Women. Journal of Nutrition 2004, 134(3), 574–579.
- Yang, G.; Shu, X.; Jin, F.; Elasy, T.; Li, L.; Li, Q.; Huang, F.; Gao, T; Zheng, W. Soy Food Consumption and Risk of Glycosuria: A Cross-Sectional Study Within the Shanghai Women’s Health Study. European Journal of Clinical Nutrition 2004, 58, 615–620.
- Hossein, J. Soy Products as Healthy and Functional Foods. Middle-East Journal of Scientific Research 2011, 7(1), 71–80.
- Kanika, M.; Md. Nazim, U.; Nusrat, J.C.; Dipak, K.P. Nutritional Quality, Sensory Evaluation, Phytochemicals Analyses, and In-Vitro Antioxidant Activity of the Newly Developed Soy Ice Cream. American Research Journal of Agriculture 2015, 1, 44–54.
- Chanda, S.; Dave, R. In Vitro Models for Antioxidant Activity Evaluation and Some Medicinal Plants Possessing Antioxidant Properties: An Overview. African Journal of Microbiology Research 2009, 3, 981–996.
- Shwetha, C.; Latha, K.P.; Pushpa, B.; Shruthi, A.; Vaidya, V.P. Phytochemical Screening and Evaluation of In-Vitro Antioxidant Activity, Total Phenolics, and Total Flavonoids of Holarrhena Antidysentrica Leaf Extracts. International Journal of Applied Research in Natural Products 2011, 1, 546–550.
- Grubesic, R.; Vukovic, J.; Kremer, D.; Vladimir-Knezevic, S. Spectrophotometric Method for Polyphenols Analysis: Prevalidation and Application on Plantago L. Species. Journal of Pharmaceutical and Biomedical Analysis 2005, 39, 837–842.
- Abdelseed, B. Some Nutritional Attributes of Selected Newly Developed Lines of Sorghum (Sorghum Bicolor) after Fermentation. Journal of Agricultural Science and Technology 2011, 13, 399–409.
- Chuanphongpanich, S.; Phanichphant, S. Method Development and Determination of Phenolic Compounds in Broccoli Seeds Samples. Chiang Mai Journal of Science 2006, 33, 103–107.
- Md. Khirul, I.; Nripendra, N.B.; Sanjib, S.; Hemayet, H.; Ismet, A.J.; Tanzir, A.K.; Khalijah, A.; Jamil, A.S. Antinociceptive and Antioxidant Activity of Zanthoxylumbudrunga Wall (Rutaceae) Seeds. The Scientific World Journal 2014, 3(7) 1–7.
- Uddin, M.; Rahman, M.; Mitra, K.; Akter, R. Preliminary Phytochemical Analysis and in Vitro Antioxidant Activities of Methanol Extract of Argyreia Argentea (Roxb). International Journal of Applied Research in Natural Products 2014, 7(1), 1–7.
- Jiri, S.; Marketa, R.; Olga, K.; Petr, S. Fully Automated Spectrometric Protocols for Determination of Antioxidant Activity: Advantages and Disadvantages. Molecules 2010, 15, 8618–8640.
- Katalini´c, V.; Smole Možina, S.; Skroza, D.; Generali´c, I.; Abramoviˇc, H.; Miloš, M.; Ljubenkov, I.; Piskernik, S.; Pezo, I.; Terpinc, P.; Boban, M. Polyphenolic Profile, Antioxidant Properties and Antimicrobial Activity of Grape Skin Extracts of 14 Vitis Vinifera Varieties Grown in Dalmatia (Croatia). Food Chemistry 2010, 119, 715–723.
- Gulcin, I.; Bursal, E.; Sehitoglu, M.; Bilsel, M.; Goren, A. Polyphenol Contents and Antioxidant Activity of Lyophilized Aqueous Extract of Propolis from Erzurum, Turkey. Food and Chemical Toxicology 2010, 48, 2227–2238.
- Jagtap, U.; Panaskar, S.; Bapat, V. Evaluation of Antioxidant Capacity and Phenol Content in Jackfruit (Artocarpus Heterophyllus Lam.) Fruit Pulp. Plant Food Human Nutrition 2010, 65, 99–104.
- Seok-Yeong, Y.; Young-Jun, L.; Jong-Dai, K.; Suk-Nam, K.; Seong-Kap, L.; Jung-Young, J.; Hyo-Ku, L.; Jeong-Ho, L.; Ok-Hwan, L. Phenolic Composition, Antioxidant Activity, and Anti-Adipogenic Effect of Hot Water Extract from Safflower (Carthamus tinctorius L.) Seed. Nutrients 2013, 5, 4894–4907.
- Kunchandy, E.; Rao, M.N.A. Oxygen Radical Scavenging Activity of Curcumin. International Journal of Pharmaceutics 1990, 58, 237–240.
- Chew, A.; Jessica, J.; Sasidharan, S. Antioxidant and Antibacterial Activity of Different Parts of Leucas Aspera. Asian Pacific Journal of Tropical Biomedicine 2012, 2, 176–180.
- Višnja, K.; Sonja Smole, M.; Ivana, G.; Danijela, S.; Ivica, L.; Anja, K. Phenolic Profile, Antioxidant Capacity, and Antimicrobial Activity of Leaf Extracts from Six Vitis Vinifera L. Varieties International Journal of Food Properties 2013, 16, 45–60.
- Cora, D.; Bruce, G. Phytochemicals: Nutraceuticals and Human Health. Journal of the Science of Food and Agriculture 2000, 80, 1744–1756.
- Dhan, P.; Charu, G.; Girish, S. Importance of Phytochemicals in Nutraceuticals. Journal 420 of Chinese Medicine Research and Development 2012, 1, 70–78.
- Dorman, H.; Kosar, M.; Kahlos, K.; Holm, Y.; Hiltunen, R. Antioxidant Properties and Composition of Aqueous Extracts from Menthaspecies, Hybrids, Varieties, and Cultivars. Journal of Agricultural and Food Chemistry 2003, 51(16), 4563–4569.
- Zhao, H.; Fan, W.; Dong, J.; Lu, J.; Chen, J.; Shan, L.; Lin, Y.; Kong, W. Evaluation of Antioxidant Activities and Total Phenolic Contents of Typical Malting Barley Varieties. Food Chemistry 2007, 107, 296–304.
- Gulcin, G.; Sat, B.; Elmastas, M.; Kufreviouglu, I. Comparison of Antioxidant Activity of Clove (Eugenia Caryophylata Thunb) Buds and Lavender (Lavandula Stoechas L). Food Chemistry 2004, 87, 393–400.
- El-Sayed, S.; Salih, A.; Mohamed, M.; Mortada, M.; Eman, A. Phytochemical Studies and Evaluation of Antioxidant, Anticancer, and Antimicrobial Properties of Conocarpus Erectus L. Growing in Taif, Saudi Arabia. European Journal of Medicinal Plants 2012, 2(2), 93–112.
- Ilhami, G.; Fevzi, T. S.; Beyza, S.; Ercan, B.; Gökhan, B.; Ahmet G. Polyphenol Contents and Antioxidant Properties of Medlar (Mespilus Germanica L.). Records of Natural Products 2011, 5, 158–175.
- Raghuveer, R.; Sindhoori, T.; Sanjeeva, K.; Raju, C.; Valya, N. Evaluation of in-Vitro Antioxidant and Free Radical Scavenging Activities of Punica Granatum Pericarp Extract. International Journal of Pharmaceutical and Phytopharmacological Research 2011, 1(2), 49–55.
- Lin, E.; Chou, H.; Kuo, P.; Huang, Y. Antioxidant and Antiproliferative Activities of Methanolic Extracts of Perilla Frutescens. Journal of Medicinal Plants Research 2010, 4, 477–483.
- Li, C; Lin, E. Antiradical Capacity and Reducing Power of Different Extraction Method of Areca Catechu Seed. African Journal of Biotechnology 2010, 9, 7831–7836.
- Henry, J.F.; Kelvin, J.A.D.; Fulvio, U. How Do Nutritional Antioxidants Really Work: Nucleophilic Tone and Para-Hormesis Versus Free Radical Scavenging in Vivo. Free Radical Biology and Medicine 2014, 8, 1–27.
- Gülçin, Ö.; Küfrevioglu, M.; Oktay Buyukokuroglu, M. Antioxidant, Antimicrobial, Antiulcer, and Analgesic Activities Of Nettle (Urtica Dioica L.). Journal of Ethnopharmacology 2004, 90, 205–215.
- Smitha, M; Sainath, R.K.; Jordan, D.S.; Travis, O.G.; Jamie, L.A.; Gautam, M.; Krishna, R.M.; Narasimham, L.P. Phytochemical Antioxidants Modulate Mammalian Cellular Epigenome: Implications in Health and Disease. Antioxidants & Redox Signaling 2012, 17(2), 327–339.
- Ghiringhelli, F.; Reb, C.; Hichami, A.; Delmas, D. Immunomodulation and Anti-Inflammatory Roles of Polyphenols As Anticancer Agents. Anti-Cancer Agents in Medicinal Chemistry 2012, 12(8), 852–873.
- Korkina, L.; Kostyuk, V.; De Luca, C.; Pastore, S. Plant Phenylpropanoids As Emerging Anti-Inflammatory Agents. Mini-Reviews in Medicinal Chemistry 2011, 11, 823–835.