
Abstract
A fast method was developed for simultaneous detection and quantification of 12 phenolic compounds in mung bean, using reversed phase high-performance liquid chromatography. The method was optimized for mobile phase combination, elution gradient, detection wavelength, and solvent extraction. All the phenolic compounds (gallic acid, neochlorogenic acid, catechin, chlorogenic acid, caffeic acid, p-coumaric acid, t-ferulic acid, vitexin, isovitexin, myricetin, quercetin, and kaempferol) were eluted for 18 min and recovered within a limit as per International Council for Harmonization guidelines. The method showed good linearity with correlation coefficient of 0.998. The limit of detection and quantification of all the compounds ranges from 0.27 ± 0.01 to 3.65 ± 0.3µg/mL and 0.91 ± 0.1 to 12.17 ± 0.9µg/mL, respectively. Vitexin (28.10 ± 0.20 to 29.60 ± 0.6 mg/100 g raw material) and isovitexin (34.09 ± 0.14 to 36.83 ± 0.82 mg/100 g raw material) were the major phenolic compounds along with other phenolic compounds found in mung beans.
Introduction
Mung bean (Vigna radiata L.) is a commercial legume crop mostly used in Asian countries, valued for its high protein, mineral, and vitamin content. Its protein quality is better or comparable with other legumes such as chickpea, pigeon pea, peas, and green pea.[Citation1,Citation2] Mung bean extract has attracted a lot of interest in recent years due to its high total phenolic and flavonoid content, 1,1-diphenyl-2-picrylhydrazyl scavenging, antiproliferative, alcohol dehydrogenase, and tyrosinase inhibition activities. These properties may help to protect nucleic acids and proteins from oxidant damage, and thus prevent the development of human diseases.[Citation3] The aqueous extract of mung bean coat also helps to prevent the chances of lethal sepsis.[Citation4] Two of the major antioxidant components present in the mung bean, vitexin and isovitexin, have been reported to prevent the heat stress injury.[Citation5]
Reported studies have focused mainly on the total phenolic content of mung bean. Only a few studies estimated individual phenolic acid composition of the bean. Studies reveal that the mung bean is a good source of gallic acid, catechin, quercetin,[Citation6,Citation7] vitexin and isovitexin,[Citation8–Citation10] p-coumaric acid, ferulic acid,[Citation6,Citation7,Citation9,Citation11–Citation15] caffeic acid,[Citation6,Citation13,Citation15] kaempferol,[Citation6,Citation13] chlorogenic acid,[Citation7,Citation15] and neochlorogenic acid.[Citation13] Phenolic acid composition of mung bean has been estimated using thin layer chromatography. Semi-preparative high-performance liquid chromatography (HPLC) has also been employed for the enrichment and analysis of flavonoids (vitexin and isovitexin).[Citation8,Citation11] Ultra-performance liquid chromatography was carried out for the identification of phenolic acids in the mung bean.[Citation9] The effect of germination and soaking on the phenolic profile of the mung bean has been investigated by HPLC.[Citation6,Citation12] HPLC analysis was also employed for the investigation of phenolic acids, flavones, and flavonols present in Glycine max (L.) Merr., Vigna radiata L. and Medicago sativa L. seeds, pistachio hull, Artemisia herba-alba, haskap berries, and Stephania japonica.[Citation13,Citation16–Citation19] The above reported methods, however, have several limitations such as complex gradient,[Citation6,Citation9,Citation13,Citation14] complex mobile phase composition,[Citation7,Citation9,Citation14] and a long run time.[Citation13,Citation14,Citation20] A recent study was also carried out for the identification of phenolic compounds and to examine the correlation between the phenolic profile of different varieties. However, the two major phenolic compounds vitexin and isovitexin were not quantified.[Citation21] The present study is an attempt to develop a simple, rapid, reproducible, accurate, precise, and reliable reverse phase–high-performance liquid chromatography (RP–HPLC) method for the estimation of phenolic content in mung bean. The high-performance liquid chromatography photodiode array detection (HPLC–PDA) method was developed to identify gallic acid (hydroxybenzoic acid), neochlorogenic acid, chlorogenic acid, caffeic acid, p-coumaric acid, t-ferulic acid (hydroxycinnamic acids); catechin (flavanol); vitexin, isovitexin (flavones); myricetin, quercetin, kaempferol (flavonols) at a single wavelength simultaneously and was used to determine the phenolic compound in two varieties of mung bean. The method was also validated in terms of linearity, accuracy, precision, limit of detection (LOD) and limit of quantification (LOQ) according to International Council for Harmonisation (ICH) guidelines.[Citation22]
Material and methods
Chemicals
All standard phenolic compounds, i.e., gallic acid, neochlorogenic acid, catechin, caffeic acid, chlorogenic acid, p-coumaric acid, t-ferulic acid, vitexin, isovitexin, myricetin, kaempferol, and quercetin, were procured from Sigma Aldrich (St. Louis, USA). HPLC grade methanol, acetonitrile (ACN), water, ortho-phosphoric acid (OPA), and dimethyl sulfoxide (DMSO), acetic acid were purchased from Merck (Darmstadt, Germany). Solvents were filtered through 0.45 µm membranes (Cat No. HVLP04700, Millipore) and degassed prior to use in HPLC.
Stock solutions of standard compounds (1000 ppm) were prepared in DMSO. In order to ensure complete dissolution, the solution was sonicated for 5 min. The stock solution was diluted with methanol to give working solutions in concentrations ranging from 5 to 100 ppm for calibration. All the standards were stored in the dark at 4°C. Working solutions were filtered through 0.45 μm disk filters before calibration (Durapore HVLP, Millipore).
Plant Materials
The mung bean samples, TAARM-101 and HUM-1, were obtained from the Indian Institute of Pulse Research (IIPR), Kanpur. The grains were cleaned to remove dirt and unwanted foreign material before extraction of phenolic compounds.
Extraction
Extraction of phenolic compounds from the samples were carried out using previously described method.[Citation23] Briefly, a finely ground bean sample (2 g) was extracted using 10 mL ACN and 2 mL 0.1N HCl. Extraction was carried out for 2 h at room temperature, filtered, and concentrated using a vacuum evaporator. The residues were re-dissolved in methanol and analyzed for the identification and quantification of phenolic compounds.
HPLC-PDA
Analysis of mung bean extract was carried out using Waters HPLC integrated with photo diode array detector. The wavelength of detector scan range was set between 210–400 nm and the chromatograms were extracted at 270 nm. An analytical Hypersil octadecyl-silica (ODS) column (150 × 4.6 mm, Thermo Scientific) with thermostated compartment was used for the separation of compounds. The temperature of column oven was set as 30°C. Waters Empower 2 (Waters Pvt Ltd., USA) software was used for the operation of the system.
An elution gradient of 0.1% OPA (v/v; solvent A) and ACN (solvent B) were used at a flow rate of 1.0 mL/min as follows: Solvent A was decreased from 95 to 64% in 18 min and the initial conditions were further set at 95% (solvent A) in last 2 min. Twenty microliters of diluted and filtered mung bean extract was injected into the HPLC sample injection port. The chromatograms were extracted at 270 nm using a PDA detector. Data were analyzed using Empower software and the compounds were identified in accordance with the retention time and absorbance spectra of pure standards. Results were the mean of five replicates.
Method Validation
Stock solution containing 12 analytes were prepared and diluted to appropriate concentration in the range of 5–100 ppm for establishing calibration curves. For quantitative analysis, seven different concentrations of 12 analytes were injected five times. The calibration curves were obtained by plotting the peak areas versus concentration of each analyte. The relationship between concentrations of different phenolic compounds and peak area has been reported as a, b, and r values. Here a and b are the coefficient of the regression equation
where y corresponds to the peak area and x corresponds to the concentration of the particular phenolic compounds and in this case r represents the correlation coefficient of the equation.
For the LOD and LOQ determination, stock solution containing reference compounds were diluted to give series of appropriate concentrations with methanol and aliquots of the diluted solutions were injected. The limits of detection and quantification for all analytes were calculated on the basis of a signal-to-noise ratio (S/N) of 3 and 10, respectively. Measurements of intra-day variability in standard compounds and compounds present in sample were utilized to assess the repeatability and reproducibility of the developed method. Intra-day precisions of standard compounds and samples were expressed as relative standard deviation (RSD). Accuracy was expressed as recovery for the 12 polyphenols. It was determined by injecting the samples spiked with a known amount of standard compounds, using the proposed method.
Results and Discussion
Method Optimization: Chromatographic Conditions
Preliminary studies involved the testing of different mobile phases with different concentrations for appropriate chromatographic separation of different phenolic compounds under investigation. Initially, the analysis was carried out using ACN along with gradient combination of 2.5% acetic acid in water (v/v).[Citation24] With this method all the compounds were eluted within 2 min (). Then the method 1 () was used for the analysis. Again the same results were observed, i.e., all phenolic compounds were eluted collectively within 2 min (). Then the gradient was altered as described in (method 2), but no improvement was observed in the separation profile (). However, good chromatographic separation was observed by replacing 2.5% acetic acid with 0.1% orthophosphoric acid (OPA) and method 2. These chromatographic conditions render the elution of all phenolic compounds under investigation (gallic acid, neochlorogenic acid, catechin, chlorogenic acid, caffeic acid, p-coumaric acid, t-ferulic acid, myricetin, quercetin, and kaempferol) within the run time of 18 min (). Then the run time was reduced by keeping the gradient of the flow same (, method 4). This gradient led to separation of all the phenolic compounds () in the same way as observed in the case of method 2 with 0.1% OPA. For better separation and higher resolution, another change in the gradient was carried out (, method 3). With this gradient an increase in the run time, i.e., 22 min was observed and the tailing in the peaks representing neochlorogenic acid and catechin were also observed (). Thus, method 4 with 0.1% OPA was selected for further experiments.
TABLE 1 Method optimization: Chromatographic conditions
FIGURE 1 HPLC Chromatogram of standard solution (100 ppm) with different elution gradients A: ACN with gradient combination of 2.5% acetic acid; B: method 1; C: method 2; D: method 2 with 0.1% OPA; E: method 3. (1) gallic acid; (2) neochlorogenic acid; (3) catechin; (4) chlorogenic acid; (5) caffeic acid chlorogenic acid; (6) p-coumaric acid; (7) t-ferulic acid; (8) vitexin; (9) isovitexin: (not included); (10) myricetin; (11) quercetin; and (12) kaempferol.
FIGURE 3 Overlaid HPLC chromatogram of standard solution (100 ppm) at column temperature 30 and 35°C extracted at 270 nm. (1) gallic acid; (2) neochlorogenic acid; (3) catechin; (4) chlorogenic acid; (5) caffeic acid; (6) p-coumaric acid; (7) t-ferulic acid; (8) vitexin; (9) isovitexin: (not included); (10) myricetin; (11) quercetin; (12) kaempferol.
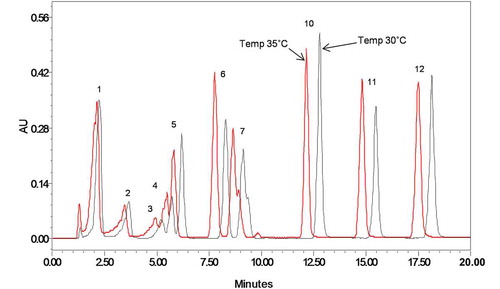
FIGURE 2 HPLC chromatogram extracted at 270 nm; A: standard solution 20 ppm, linear gradient (curve 6); B: standard solution 20 ppm, curved gradient (curve 7); C: mung bean variety TAARM-101; D: mung bean variety HUM-1. (1) gallic acid; (2) neochlorogenic acid; (3) catechin; (4) chlorogenic acid; (5) caffeic acid; (6) p-coumaric acid; (7) t-ferulic acid; (8) vitexin; (9) isovitexin; (10) myricetin; (11) quercetin; (12) kaempferol.
In previous studies, the column temperature was reported to have a crucial influence on the analysis time and resolution values of peaks, increase in the column temperature led to significant improvement in the analysis time and resolution values of the peaks.[Citation25–Citation27] During method development, separation profile of standard phenolic compounds were also studied at two column temperatures: 30 and 35°C (). A slight decrease in the retention time of compounds was seen with an increase in the column temperature from 30 to 35°C. However, no major change was observed in the separation profile, resolution, and peak shapes of phenolic compounds. Therefore, a column temperature of 30°C was selected for further study.
Method Optimization: Selection of Curve Gradient
Earlier studies have shown significant peak separation and increase in the S/N of the multi-component sample.[Citation25,Citation28] For better separation profile of phenolic compounds, a series of experiments were conducted with curved gradient 6 and curved gradient 7. Gradient 6 and 7 represents the linear and concave gradient curve profile respectively explained in detail in Supplement A.
An improved S/N and separation of phenolic compounds with increase in the retention time (20 min) was observed with curved gradient 7. However, we observed that two of the phenolic compounds, caffeic acid, and chlorogenic acid eluted at the same time and tailing in the initial peaks (). The curved gradient 6, i.e., linear gradient, was found to be appropriate as it was able to separate caffeic acid and chlorogenic acid. Thus, curved gradient 6 was used for further analysis.
Method Optimization: Selection of Detection Wavelength
In the previous studies, different absorption wavelengths have been reported for the quantification of different classes of phenolic compounds. Free phenolic acid and flavonoids were observed at 280 nm, whereas chlorogenic acid, ferulic acid, caffeic acid, and p-coumaric acid were detected at 320 nm and kaempferol and quercetin were observed at 360 nm.[Citation6] In another study, flavonoids, i.e., vitexin and isovitexin were detected at 280 nm[Citation8] and at 330 nm.[Citation9] Neochlorogenic acid, caffeic acid, p-coumaric acid, and ferulic acid were determined at 320 nm, whereas quercetin and kaempferol were monitored at 350 nm.[Citation13] In the present study for quantification of standard compounds, the chromatograms were extracted at 254, 270, 280, and 320 nm. Calibration was also performed at these wavelengths. The correlation coefficients for different compounds at selected wavelengths are reported in . Gallic acid and catechin peaks were not observed at 320 nm and similarly, catechin was observed only at higher concentrations from 40 to 100 ppm at 254 nm. All of the 12 compounds were observed in the chromatogram extracted at 270 and 280 nm. Based on the linearity of the calibration curve and high values of mean correlation coefficient, 270 nm was selected for the validation and quantification of the mung bean samples.
TABLE 2 Comparison of correlation coefficients (r) obtained after calibration at 254, 270, 280, and 320 nm
Method Optimization: Sample Extraction
Different procedures and complex solvent composition have been used for the extraction of different classes of phenolic compounds.[Citation29] However, we used a single method to extract different phenolic compounds. Initially extraction was carried out using acetone:water (1:1),[Citation30] 70% acetone,[Citation31] methanol,[Citation32] and acidic methanol.[Citation31] Extraction of phenolic compounds from the sample was also carried out using alkaline hydrolysis of sample and after acidification of sample the supernatant was extracted using ethyl acetate.[Citation33] With the all these methods only catechin, vitexin, and isovitexin were extracted (). However, we obtained best results using ACN and 0.1N HCL as the extraction solvent,[Citation23] and were able to extract nine phenolic compounds from the samples ().
FIGURE 4 HPLC chromatogram of sample extracted with different extraction solvent; A: acetone:water (50:50 v/v); B: acidic hydrolysis and ethyl acetate; C: acetone:water (70:30 v/v); D: acidic methanol; E: methanol: (8) vitexin; (9) isovitexin; (11) quercetin.
FIGURE 5a Absorption spectra of hydroxybenzoic acid, hydroxycinnamic acids, flavanol, flavones, and flavonols (20 ppm) from 210–400 nm.
FIGURE 5b Absorption spectra of hydroxybenzoic acid, hydroxycinnamic acids, flavanol, flavones, and flavonols (20 ppm) from 210–400 nm.
Elution Profile of Compounds Analyzed
The HPLC chromatogram of the compounds analyzed is given in . Generally, polarity is the primary factor responsible for the differential elution of analytes in RP–HPLC. Here in this study, the overall order of elution is as follows; hydroxybenzoic acid (HBA) (gallic acid), flavanol (catechin), hydroxycinnamic acid (HCA) (chlorogenic acid, caffeic acid, p-coumaric acid, t-ferulic acid), flavones (vitexin, isovitexin), and flavonols (myricetin, quercetin, kaempferol). A similar order of elution was reported for phenolic acid and HCA in other literature.[Citation34,Citation35] It was suggested that the presence of extra ethylenic chain in the HCA imparts more hydrophobicity which leads to the higher retention of these compounds in column. Also, the presence of one extra hydroxyl moiety in chlorogenic acid reduced its retention time as compared to caffeic acid.[Citation36] Retention time of flavonoids (vitexin, isovitexin, myricetin, quercetin, and kaempferol) is more as compared to the members of HBA and HCA family which may be attributed to the presence of 4-keto moiety in these compounds. The 4-keto functional group forms a non-polar, planar six membered ring with the hydroxyl group positioned at 5 which explains the later elution of these compounds.[Citation34] However, early elution of catechin at low ACN concentration can be explained by the absence of 4-keto group making this compound less hydrophobic. Early elution of heavy molecular weight vitexin and isovitexin before the myricetin, quercetin, and kaempferol can also be attributed to the additional hydroxyl group, which makes these compounds more polar as compared to myricetin, quercetin, and kaempferol.[Citation36]
Method Validation
The linearity, precision, accuracy, detection limits, and quantification limits of the proposed method were investigated. The statistical data for these parameters are given in . To test linearity, seven different concentrations of standard solutions were injected five times. Calibration curves were found to be linear in the range of 5–100 ppm for all the compounds under investigation. A high correlation coefficient (0.997–0.999) revealed a good linearity response for developed method (). LOD and LOQ for different compounds were calculated based on S/N of 3 and 10, respectively, as per the ICH guidelines. The LODs for all the 12 phenolic compounds were found in the range of 0.27 to 3.65 µg/mL and the LOQs were in the range of 0.91 to 12.17µg/mL (). This indicated that the proposed method exhibits good sensitivity for the quantification of phenolic compounds.
TABLE 3 Statistical data for method validation parameters
To test overall precision of the assay, the standard solutions and samples were injected five times. The maximum RSD was 1.62% for the standard solutions and 0.76% for the mung bean extracts, which demonstrated the good precision of the proposed method. The accuracy of the proposed method was expressed as the recovery of standard compounds spiked to the pre-analyzed mung bean extract, which was 96.51–99.77% with the RSD values ranging from 0.09 to 2.86%. These results are summarized in .
Quantitation
This optimized and validated method was used for the detection and quantification of phenolic compounds present in the extract of TAARM-101 and HUM-1 varieties of the mung bean. The presence of phenolic compounds in the extracts, was confirmed by comparing their retention times () and ultraviolet (UV) spectra ( and ) with those of standard compounds. A total nine phenolic compounds were found in both varieties. In comparison to other polyphenols, kaempferol (1.90 and 2.09 mg/100 g raw material) and myricetin (2.77 and 2.89 mg/100 g raw material; and ) were observed in small quantity which is also reported by Wang et al.[Citation20] Vitexin (28.10 and 29.60 mg/100 g raw material) and isovitexin (34.09 and 36.83 mg/100 g raw material) were the major phenolic compounds detected in both the varieties. This result is in concordance with previous studies where vitexin (4.37–150.0 mg/100 g) and isovitexin (3.73–110 mg/100 g)[Citation9,Citation10] were found to be the major phenolic compounds present in the different varieties of the mung bean. TAARM-101 and HUM-1 were found to be a good source of catechin (12.20 and 17.09 mg/100 g raw material) as compare to other varieties of mung bean (0.37–0.96 mg/100 g).[Citation7] Both the varieties were found to be a rich source of t-ferulic acid (25.71 and 21.57 mg/100 g). Extracts of these two varieties of the mung bean also showed the presence of significant amount of p-coumaric acid (8.29 and 28.22mg/100 g raw material), caffeic acid (9.20 and 5.47 mg/100 g raw material), and quercetin (7.66 and 3.17 mg/100 g raw material). Amount of these compounds were also found to be in the range as compare to the previously reported studies.[Citation6,Citation7,Citation12,Citation15,Citation20] It was found that variety HUM-1 (146.99 ± 0.8 mg/100 g raw material) has high total HPLC composition of polyphenols than variety TAARM-101 (129.96 ± 3.1 mg/100 g raw material; ).
TABLE 4 Compositional analysis and antioxidant capacity of mung bean extract (mg/100 g)
Conclusions
This article describes a novel HPLC method for the simultaneous determination of 12 phenolic compounds in mung bean extract. The developed method was optimized for the mobile phase gradient and combinations, column temperature, curved gradient, detection wavelength, extraction solvent, and extraction method. This method has advantages over the previous methods in terms of shorter run time and simpler gradient. This method has been verified for its linearity, precision, and accuracy. This method allows the complete separation of all the compounds with good resolution. Low LOD and LOQ values suggest that small quantities of the phenolic compounds can also be detected with this method. This proposed method has been successfully applied for the detection and quantification of phenolic compounds present in two mung bean varieties.
Supplemental Material
Download Zip (94.1 KB)Acknowledgments
Maninder Meenu gratefully acknowledges the grant of Senior Research Fellowship from the University Grant Commission (UGC), New Delhi, India. The authors would like to thank the Indian Institute of Pulses Research (IIPR), Kanpur for providing the germplasm of the mung bean.
SUPPLEMENTAL MATERIAL
Supplemental data for this article can be accessed on the publisher’s website.
Related Research Data
References
- Mubarak, A.E. Nutritional Composition and Antinutritional Factors of Mung Bean Seeds (Phaseolus Aureus) As Affected by Some Home Traditional Processes. Food Chemistry 2005, 89, 489–495.
- Anwar, F.; Latif, S.; Przybylski, R.; Sultana, B.; Ashraf, M. Chemical Composition and Antioxidant Activity of Seeds of Different Cultivars of Mungbean. Journal of Food Science 2007, 72, S503–S510.
- Kim, D.K.; Jeong, S.C.; Gorinstein, S.; Chon, S.U. Total Polyphenols, Antioxidant, and Antiproliferative Activities of Different Extracts in Mungbean Seeds and Sprouts. Plant Foods for Human Nutrition 2012, 67, 71–75.
- Zhu, S.; Li, W.; Li, J.; Jundoria, A.; Sama, A.E.; Wang, H. It Is Not Just Folklore, the Aqueous Extract of Mung Bean Coat Is Protective Against Sepsis. Evidence-Based Complementary and Alternative Medicine 2012, 2012, 10. DOI:10.1155/2012/498467
- Cao, D.; Li, H.; Yi, J.; Zhang, J.; Che, H.; Cao, J.; Yang, L.; Zhu, C.; Jiang, W. Antioxidant Properties of the Mung Bean Flavonoids on Alleviating Heat Stress. PLoS ONE 2011, 6, e21071.
- Pajak, P.; Socha, R.; Galkowska, D.; Roznowski, J.; Fortuna, T. Phenolic Profile and Antioxidant Activity in Selected Seeds and Sprouts. Food Chemistry 2014, 143, 300–306.
- Nair, R.M.; Thavarajah, D.; Thavarajah, P.; Giri, R.R.; Ledesma, D.; Yang, R.; Hanson, P.; Easdown, W.; Hughes, J.; Keatinge, J.D.H. Mineral and Phenolic Concentrations of Mungbean [Vigna Radiata (L.) R. Wilczek var. Radiata] Grown in Semi-Arid Tropical India. Journal of Food Composition and Analysis 2015, 39, 23–32.
- Li, H.; Cao, D.; Yi, J.; Cao, J.; Jiang, W. Identification of the Flavonoids in Mungbean (Phaseolus Radiatus L.) Soup and Their Antioxidant Activities. Food Chemistry 2012, 135, 2942–2946.
- Zhang, X.; Shang, P.; Qin, F.; Zhou, Q.; Gao, B.; Huang, H.; Yang, H.; Shi, H.; Yu, L. Chemical Composition and Antioxidative and Anti-Inflammatory Properties of Ten Commercial Mung Bean Samples. LWT–Food Science and Technology 2013, 54, 171–178.
- Yao, Y.; Cheng, X.; Ren, G. Contents of D-Chiro-Inositol, Vitexin, and Isovitexin in Various Varieties of Mung Bean and Its Products. Agricultural Sciences in China 2011, 10, 1710–1715.
- Sosulski, F.W.; Dabrowski, K.J. Composition of Free and Hydrolyzable Phenolic Acids in the Flours and Hulls of Ten Legume Species. Journal of Agricultural and Food Chemistry 1984, 32, 131–133.
- Naveena, N.; Bhaskarachary, K. Effects of Soaking and Germination of Total and Individual Polyphenols Content in the Commonly Consumed Millets and Legumes in India. International Journal of Food Sciences and Nutrition 2012, 2, 7049–7058.
- Silva, L.R.; Pereira, M.J.; Azevedo, J.; Goncalves, R.F.; Valentao, P.; P. Guedes de Pinho, P.B.; Andrade, Glycine Max (L.) Merr., Vigna Radiata L. and Medicago Sativa L. Sprouts: A Natural Source of Bioactive Compounds. Food Research International 2013, 50, 167–175.
- Yao, Y.; Cheng, X.; Wang, L.; Wang, S.; Ren, G. Biological Potential of Sixteen Legumes in China. International Journal of Molecular Sciences 2011, 12, 7048–7058.
- Yao, Y.; Yang, X.; Tian, J.; Liu, C.; Cheng, X.; Ren, G. Antioxidant and Antidiabetic Activities of Black Mung Bean (Vigna Radiata L.). Journal of Agricultural and Food Chemistry 2013, 61, 8104–8109.
- Garavand, F.; Madadlou, A.; Moini, S. Determination of Phenolic Profile and Antioxidant Activity of Pistachio Hull Using HPLC-DAD-ESI-MS As Affected by Ultrasound and Microwave. International Journal of Food Properties 2015. DOI:10.1080/10942912.2015.1099045
- Bourgou, S.; Tammar, S.; Salem, N.; Mkadmini, K.; Msaada, K. Phenolic Composition, Essential Oil and Antioxidant Activity in the Aerial Part of Artemisia Herba-Alba from Several Provenances: A Comparative Study. International Journal of Food Properties 2015. DOI:10.1080/10942912.2015.1040495
- Khattab, R.; Brooks, M.S.; Ghanem A.; Phenolic Analyses of Haskap Berries (Lonicera Caerulea L.): Spectrophotometry Versus High Performance Liquid Chromatography. International Journal of Food Properties 2015. DOI:10.1080/10942912.2015.1084316
- Uddin, M.N.; Ahmed, N.U.; Rahman, M.A.; Akter, R.; Akter, R. Antioxidative Potential of the Polyphenolics of Stephania Japonica var. Discolor (Blume) Forman: A Chromatographic (HPLC) and Spectrophotometric Measure. International Journal of Food Properties 2015. DOI:10.1080/10942912.2015.1048355
- Wang, M.L.; Gillaspie, A.G.; Morris, J.B.; Pittman, R.N.; Davis, J.; Pederson, G.A. Flavonoid Content in Different Legume Germplasm Seeds Quantified by HPLC. Plant Genetic Resources 2008, 6, 62–69.
- Kim, J.; Kim, E.; Lee, O.; Park, S.; Lee, B.; Kim, S.; Park, I.; Chung, I. Variation and Correlation Analysis of Phenolic Compounds in Mungbean (Vigna Radiata L.) Varieties. Food Chemistry 2013, 141, 2988–2997.
- I.C.H. Harmonized Tripartite Guideline. Validation of Analytical Procedure: Methodology (Q2B), International Conference on Harmonization, Geneva, Switzerland, November 6, 1997.
- Wang, H.J.; Murphy, P.A. Isoflavone Composition of American and Japanese Soybeans in Iowa: Effects of Variety, Crop Year, and Location. Journal of Agricultural and Food Chemistry 1994, 42, 1674–1677.
- Socha, R.; Juszczak, L.; Pietrzyk, S.; Galkowska, D.; Fortuna, T.; Witczak, T. Phenolic Profile and Antioxidant Properties of Polish Honeys. International Journal of Food Science and Technology 2011, 46, 528–534.
- Sharma, A.; Bhondekar, A.P.; Bari, S.S.; Gulati, A.; Kapur, P.; Singla, M.L. Development and Optimization of An HPLC Method for the Routine Analysis of Catechins, Caffeine, and Gallic Acid in Tea (Camellia Sinensis). Journal of Liquid Chromatography and Related Technologies 2011, 34, 2243–2255.
- Guillarme, D.; Nguyen, D.T.T.; Rudaz, S.; Veuthey, J.L. Recent Developments in Liquid Chromatography–Impact on Qualitative and Quantitative Performance. Journal of Chromatography A 2007, 1149, 20–29.
- Snyder, L.R.; Kirkland, J.J.; Glajch, J.L. Practical HPLC Method Development, 2nd Ed; Wiley-Interscience: New York, NY, 1997.
- Bansal, V.; Sharma, A.; Ghanshyam, C.; Singla, M.L. Rapid HPLC Method for Determination of Vitamin C, Phenolic Acids, Hydroxycinnamic Acid, and Flavonoids in Seasonal Samples of Emblica Officinalis Juice. Journal of Liquid Chromatography and Related Technologies 2015, 38, 619–624.
- Moore, J.; Hao, Z.; Zhou, K.; Luther, M.; Costa, J.; Yu, L.L. Carotenoid, Tocopherol, Phenolic Acid, and Antioxidant Properties of Maryland-Grown Soft Wheat. Journal of Agricultural and Food Chemistry 2005, 53, 6649–6657.
- Xu, B.; Chang, S.K.C. Effect of Soaking, Boiling, and Steaming on Total Phenolic Content and Antioxidant Activities of Cool Season Food Legumes. Food Chemistry 2008, 110, 1–13.
- Kajdzanoska, M.; Petreska, J.; Stefova, M. Comparison of Different Extraction Solvent Mixtures for Characterization of Phenolic Compounds in Strawberries. Journal of Agricultural and Food Chemistry 2011, 59, 5272–5278.
- Khattak, A.B.; Zeb, A.; Bibi, N.; Khalil, S.A.; Khattak, M.S. Influence of Germination Techniques on Phytic Acid and Polyphenols Content of Chickpea (Cicer Arietinum L.) Sprouts. Food Chemistry 2007, 104, 1074–1079.
- Sen, A.; Miller, S.S.; Arnason, J.T.; Fulcher, R.G. Quantitative Determination by High Performance Liquid Chromatography and Microspectro-Fluorimetry of Phenolic Acids in Maize Grain. Phytochemical Analysis 1991, 2, 225–229.
- Wulf, L.W.; Nagel, C.W. Analysis of Phenolic Acids and Flavonoids by High-Pressure Liquid Chromatography. Journal of Chromatography A 1976, 116, 271–279.
- Kermasha, S.; Goetghebeur, M.; Dumont, J.; Couture, R. Analyses of Phenolic and Furfural Compounds in Concentrated and Non-Concentrated Apple Juices. Food Research International 1995, 28, 245–252.
- Macheix, J.J.; Fleuriet, A. Phenolic Acids in Fruits. In Flavonoids in Health and Disease; Rice-Evans, C.A.; Paeker, L.; Eds.; Marcel Dekker, Inc.: New-York, NY, 1998; 35–60.