
Abstract
Starch was isolated from tamarind kernels, which are at present considered as waste. It was compared with corn and mung bean starch for its physicochemical, rheological, and morphological properties. Tamarind kernel starch showed significantly lower amylose content, light transmittance, solubility, and higher swelling power in comparison to corn and mung bean starch. The micrographs of tamarind kernel starch revealed its small oval shape granules with smooth surfaces. X-ray diffraction pattern of tamarind kernel starch was similar to corn starch with strong diffraction peaks at 15, 17, and 23° (2θ). Changes in storage modulus (Gʹ), loss modulus (Gʹʹ), and loss tangent (tan δ) during heating of starches showed the lowest peak Gʹ for tamarind kernel starch, whereas the highest was observed for corn starch. Changes in Gʹ and Gʹʹ during cooling, holding and subsequently heating were also studied. The frequency dependence of Gʹ and Gʹʹ of starches measured at 25 and 95°C revealed their weak gel behavior. During cooling tamarind kernel starch showed lower increase in Gʹ in comparison to other starches. Tamarind kernel starch was different from corn and mung bean starch in exhibiting highest peak, breakdown, and lowest setback viscosity. Tamarind seeds have potential as a relatively new, cheap, and underutilized source of starch in food applications.
INTRODUCTION
Tamarind (Tamarindus indica L.) is a member of dicotyledonous family Fabacea (Leguminosae) and grows naturally in tropical and subtropical regions. It is cultivated mainly for the pulp in the fruit, which is accepted as herbal medicine in parts of the world and used to prepare curries, flavor confections, and sauces.[Citation1] The fruit is an elongated pod with woody and brittle seeds surrounded by a brown pulp. India is the world’s largest producer of tamarind products. India produces about 0.3 million tons of tamarind yearly, of which the seed constitutes about 30–34% of the whole fruit.[Citation2] Tamarind seed is a by-product of the commercial utilization of the fruit. The seed is an underutilized raw material in the places where it is grown but there is a scope to make it useful. The seed comprises of seed coat (20–30%) and the kernel or endosperm (70–80%). The seeds are important source of carbohydrates, protein, fat, and valuable amino acids.[Citation3] Though the decorticated seed powder has been used as a low cost sizing material in jute and textile industries, there have been relatively few uses of seed powder in food formulations.[Citation2] The proper use of the seed may fetch better return to the pulp processing industries that in turn may help the people who cultivate the tree.
In the quest to find native starch with the necessary properties for the food industry with no genetic or chemical modification, starch from non-conventional sources such as mango kernels,[Citation4] bananas,[Citation5] etc., have been explored. No information is available on the starch isolated from tamarind kernels. To enhance utilization, we must understand the processing technique, the physicochemical properties of the tamarind seed, as well as of the useful extracted starch derived from tamarind seeds. In order to explore the unique starch of tamarind kernel and widen its industrial applications, the present investigation was undertaken. The study reports the isolation of starch from de-hulled tamarind kernels and its characterization for its physicochemical, pasting, rheological, and morphological properties. Tamarind kernel starch (TKS) is a novel starch and not previously reported. The properties of TKS were also compared with those of corn and mung bean starch. Corn starch was chosen for comparison, as it is the main commercial source of starch, whereas mung bean and tamarind belong to the same leguminosae family.
MATERIALS AND METHODS
Materials
Tamarind (variety PKM-1), corn, and mung beans were purchased from the local market in Amritsar, India. Chemicals and reagents used in the present study were of analytical grade.
Starch Isolation
Tamarind kernels were de-hulled manually. The starch was isolated from them by steeping them in water containing 0.16% sodium metabisulphite for 12 h at 50°C. The steep water was drained off, and kernels were ground in a laboratory blender. The ground slurry was then screened through a nylon cloth (100 mesh). The material left over the nylon cloth was washed thoroughly with distilled water. The filtrate slurry was allowed to stand for 2 h. The supernatant was removed by suction and the settled starch layer was re-suspended in distilled water and centrifuged in wide mouthed cups at 3000 rpm for 5 min. The upper non-white layer was scraped off. The white layer was re-suspended in distilled water and re-centrifuged three to four times. The starch was then collected and dried in an oven at 40°C for 12 h. The corn and mung bean starch was isolated following the method as described by Sandhu and Singh.[Citation6]
Chemical Composition
The isolated TKS was tested for its moisture, ash, fat, and protein content by employing the standard methods of analysis.[Citation7] Apparent amylose content of native and oxidized starches was determined by the rapid colorimetric method given by Williams et al.[Citation8] A starch sample (20 mg) was taken and 10 mL of 0.5 N KOH was added to it. The suspension was thoroughly mixed. The dispersed sample was transferred to a 100 mL volumetric flask and diluted to the mark with distilled water. An aliquot of test starch solution (10 mL) was pipetted into a 50 mL volumetric flask and 5 mL of 0.1 N HCl was added followed by the 0.5 mL of iodine reagent. The volume was diluted to 50 mL and the absorbance was measured at 625 nm. The measurement of the amylose was determined from a standard curve developed using amylose and amylopectin blends.
Swelling Power (SP; g/g) and Solubility (g/100 g)
SP and solubility were determined using method of Leach et al.[Citation9] One percent of the aqueous suspension of starch (100 mL) was heated in a water bath at 50, 60, 70, 80, and 90°C for 1 h with constant stirring. The suspension was cooled for 30 min at 30°C. The sample was then poured into pre-weighed centrifuge tubes, centrifuged at 3000 × g for 10 min, and the weight of the sediments was determined. For the measurement of solubility, the supernatants were poured into aluminum dishes and evaporated at 110°C for 12 h and the weight of the dry solids was determined.
Light Transmittance
Transmittance of native and modified tamarind starches was measured as described by Perera and Hoover.[Citation10] A 1% aqueous suspension of starch was heated in a water bath at 90°C for 1 h with constant stirring. The suspension was cooled for 1 h at 30°C. The samples were stored for 5 days at 4°C in a refrigerator and transmittance was determined every 24 h by measuring absorbance at 640 nm against a water blank with a Shimadzu UV-1601 spectrophotometer (Shimadzu Corporation, Kyoto, Japan).
Morphological Properties
Scanning electron micrographs (SEMs) were taken by a scanning electron microscope (Model EVOLS10 ZEISS, Oberkochen, Germany). Starch samples were suspended in ethanol to obtain a 1% suspension. One drop of starch–ethanol solution was applied on an aluminum stub using double-sided adhesive tape. An accelerating potential of 15 kV was used during micrography.
X-Ray Diffraction Analysis
X-ray diffraction analysis was conducted using an x-ray diffractometer (Philips, X’pert MPD high resolution XRD, Almelo, Netherlands). Starch samples were equilibrated at room temperature overnight in a chamber with saturated relative humidity. Diffractograms were obtained from 4° (2θ) to 30° (2θ) at a scanning speed of 4°/min with target voltage of 40 kV and 40 mA, respectively. The x-ray patterns were defined by the peak characteristics of a theoretical diffractogram given by Zobel et al.[Citation11]
Pasting Properties
The pasting properties of starches were evaluated using starch cell of a modular compact rheometer (Model 52, Anton Paar Co. Ltd., Austria). Viscosity profiles of starches were recorded using starch suspensions (6%, w/w; 15 g total weight). A programmed heating and cooling cycle was used where the samples were held at 50°C for 1 min, heated to 95°C at 6°C/min, held at 95°C for 2.7 min, before cooling from 95 to 50°C at 6°C/min and holding at 50°C for 2 min. Parameters recorded were pasting temperature, peak viscosity, trough viscosity, final viscosity, breakdown viscosity, and setback viscosity.
Rheological Properties
A modular compact rheometer (Model 52, Anton Paar Co. Ltd., Austria) equipped with a parallel plate (100 mm diameter) was used for measuring rheological properties of starch. The storage and loss moduli (Gʹ and Gʹʹ) and loss factor (tan δ) of starch (15% w/w) was measured. The gap size, strain, and angular frequency were set at 1.0 mm, 2%, and 10 rad/s, respectively. The starch suspension was heated from 45 to 95°C at a rate of 2°C/min.
The angular frequency dependence behavior was also measured at 25 and 95°C, respectively, with frequency sweeps over the range of 0.1 to 20 Hz at 2% strain. The 2% strain was in the linear visco-elastic region and Gʹ and Gʹʹ was measured. The effect of storage at 10°C for 10 h on rheological behavior of the starch paste was also studied. The starch slurry (15% w/w) was stirred for 30 min at 25°C on a magnetic stirrer and then heated at 95°C for 15 min in a water bath with mild agitation. Immediately after heating, the paste was poured on the rheometer plate preheated to 95°C and the excess material was wiped off with a spatula. The exposed sample edge was covered with a thin layer of silicon oil to prevent evaporation during heating. The measurements were taken during cooling of paste from 95 to 10°C, holding for 10 h at 10°C, and subsequently heating from 10 to 95°C. The scan rate of 2°C/min was used during the cooling and heating cycle.
Statistical Analysis
The data reported in the table are an average of triplicate observations. The data were subjected to one-way analysis of variance (ANOVA) using Minitab Statistical Software version 14 (Minitab Inc., USA).
RESULTS AND DISCUSSION
Physicochemical Properties
The isolated TKS had moisture, ash, fat, and protein contents of 10.9, 0.38, 0.47, and 0.69 g/100 g (dry weight basis), respectively. The low traces of non-starch components in TKS indicated its purity. The amylose content determined based on iodine and starch affinity is described as apparent amylose content.[Citation12]
The apparent amylose content of TKS was 14.2 g/100 g, which was significantly (p < 0.05) lower than corn (18.3 g/100 g) and mung bean starch (25.7 g/100 g; ). Amylose content is responsible for a number of factors that affect the SP, solubility, and gel forming property of the starch.[Citation13] TKS showed SP of 19.2 g/g at 90°C, which was significantly (p < 0.05) higher than the corn and mung bean starch (). However, the reverse pattern was observed for starch solubility values. At 90°C, the solubility of TKS was significantly (p < 0.05) lower than corn and mung bean starches (). The differences in the solubility of the starch samples may be due to the different morphologies, which is affected by the size of the starch particles, granule structure and amylose content.[Citation14,Citation15] SP and solubility provide an evidence of the magnitude of interaction between starch chains within the amorphous and crystalline domains and is influenced by the ratio of amylose to amylopectin.[Citation16] Tamarind starch paste showed the lowest light transmittance value of 2.2%, whereas mung bean starch paste had the highest (11.1%) value ().
TABLE 1 Amylose content, swelling power, solubility and light transmittance of tamarind kernel, corn, and mung bean starches
Morphological Properties
The SEM of TKS is shown in . The micrographs revealed small oval shape granules with smooth surfaces and no evidence of fissures. The length and breadth of the granules ranged between 2.9–6.15 and 2.9–6.01 µm, respectively. SEM for corn and mung bean starch are not shown as they are widely published elsewhere. Starch granules from tamarind kernels were very small when compared with that of corn and mung bean starch. Sandhu et al.[Citation17] reported shape of corn starch granules ranging from small to large and oval to polyhedral with their diameter from 6 to 30 µm. Kaur et al.[Citation18] reported granule diameter of 10–37 µm with average of 16.2–17.1 µm for mung bean starch. They reported large oval to small round shape of the starch granules with smooth surface. Granule size and shape are related to the biological source from which the starch is isolated.[Citation19] The difference in granule morphology may be attributed to the biological origin and physiology of the plant.[Citation20,Citation21] Starch granule size is reported to affect its physicochemical properties, such as crystallinity, solubility, pasting, and enzyme susceptibility.[Citation19]
FIGURE 1 Scanning electron micrographs of tamarind kernel starch.
X-Ray Diffraction
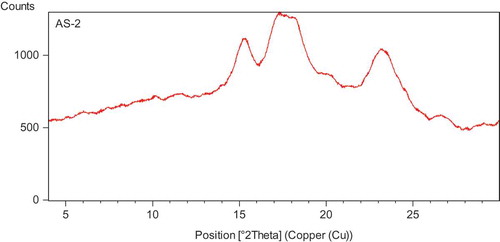
X-ray diffraction is used to study the presence and characteristics of the crystalline structure of the starch granules. In the diffraction spectra, TKS showed strong diffraction peaks at 15, 17, and 23° (2θ; ). Thus, TKS may be categorized under A-type x-ray diffraction pattern. The x-ray diffraction pattern of TKS was similar to those reported for cereal starches. Kaur et al.[Citation18] reported C-type diffraction pattern for legume starches, whereas A-type x-ray diffraction pattern has been reported for corn starch.[Citation22] Differences in diffraction patterns may be due to different growth conditions and maturity of the parent plant at the time of harvest, biological origin, amylose, and amylopectin content.[Citation23]
FIGURE 2 X-ray diffraction pattern of tamarind kernel starch.
Pasting Properties
The pasting properties of tamarind kernel, corn, and mung bean starch are reported in . All the starch suspensions showed gradual increase in viscosity upon heating followed by a drop and then again increase in viscosity upon cooling. The pasting behavior of TKS was similar with that of corn and mung bean starch. However, the peak, trough, and breakdown viscosity of TKS was significantly (p < 0.05) higher than corn and mung bean starch. Higher peak viscosity of TKS corroborated well with its higher SP. The increase in viscosity during the heating cycle is influenced by amylose, granular swelling, solubility, and the extent of friction between granules.[Citation23] However, the reverse was observed for setback viscosity. The final viscosity of TKS was significantly (p < 0.05) higher than corn starch but lower than mung bean starch. The pasting temperature of TKS was found in between mung bean and corn starch. Pasting properties are based on the starch granule size, crystal and molecular structure, and tightness of starch granules, which can, in turn, affect the amount of amylose leaching and granule swelling potential.[Citation24]
TABLE 2 Pasting properties of tamarind kernel, corn, and mung bean starches
TABLE 3 Rheological properties of tamarind kernel, corn, and mung bean starches
Rheological Properties
Rheology of starch slurry
– shows change in storage modulus (Gʹ), loss modulus (Gʹʹ), and loss tangent (tan δ) during heating for tamarind kernel, corn, and mung bean starch. Gʹ and Gʹʹ for starches increased during heating to a maximum followed by a drop. TKS showed lowest peak Gʹ, whereas the highest was observed for corn starch. The peak Gʹ of tamarind kernel, mung bean, and corn starch was 2295, 2708, and 3200 Pa, respectively (). The increase in Gʹ for the starches may be attributed to closely packed network of swollen starch granules. Hsu et al.[Citation25] reported that during heating starch granules swell followed by leaching of amylose molecules causing an increase in Gʹ to maximum value. This may be attributed to the formation of network of swollen starch granules. Peak Gʹʹ of TKS was found to be the highest, whereas corn starch had the lowest value. After reaching a maximum value between 75 to 77.5°C, Gʹ decreased for all starches, indicating that gel structure was destroyed during prolonged heating.[Citation26] The destruction was probably due to the melting of crystalline region remaining in the swollen starch granule, which deformed and loosened the particles.[Citation27] Another reason for the network collapse could have been the loss of interaction between particles and the network.[Citation25] All starches showed smoother curves for Gʹ at higher temperatures (i.e., above 80°C) which showed that the samples were not sticky. The peak viscosity temperature (TGʹ) of TKS was higher (77.5°C) and differed significantly (p < 0.05) from other starches.
FIGURE 3 (A) Changes in G′ for starches during heating; (B) Changes in G″ for starches during heating; (C) Changes in tan δ for starches during heating.
The frequency dependence of Gʹ and Gʹʹ of starches was measured at 25 and 95°C. At 25°C, both Gʹ and Gʹʹ showed frequency dependence; however, Gʹ was observed to be weakly dependent on frequency ( and ). Both moduli increased with increasing frequency with Gʹ greater than Gʹʹ over the entire frequency range studied. The behavior observed for tamarind as well as other starches were of typical weak gels. Gʹ of TKS overlapped with Gʹ of mung bean starch over the frequency range studied, whereas Gʹ of corn starch showed higher values. At 95°C, similar trend of frequency dependence was observed for Gʹ and Gʹʹ with starches showing typical weak gel behavior ( and ). However, Gʹ of TKS was higher over the frequency range in comparison to corn and mung bean starch.
FIGURE 4 (A) Angular frequency dependence of G′ at 25°C for starches; (B) Angular frequency dependence of G″ at 25°C for starches; (C) Angular frequency dependence of G′ at 95°C for starches; (D) Angular frequency dependence of G″ at 95°C for starches.
Rheology during cooling
Changes in Gʹ and Gʹʹ during cooling from 95 to 10°C, holding at 10°C for 10 h, and subsequently heating from 10 to 95°C are shown in . All starches showed elastic character (Gʹ) at the loading temperature of 95°C. Magnitude of Gʹ increased sharply during cooling, reaching the maximum at 10°C. TKS showed the lower increase in Gʹ in comparison to other starches (). The observed increase in Gʹ for starches can be attributed to the onset of intermolecular association of amylose chains released from the swollen granules.[Citation28] Chang et al.[Citation29] related the sharp increase in Gʹ during cooling to the onset temperature for the association of amylose. Evageliou et al.[Citation30] reported that the increase in Gʹ in final stages of cooling may be due to association of flexible strands into stiff helices. This makes it more difficult for individual molecules to move through the surrounding matrix of neighboring chains. During subsequent heating, Gʹ for starches increased to maximum followed by a decrease. The increase in Gʹ may be due to retrogradation of starch. Gʹ for TKS and corn starch decreased slowly in comparison to mung bean starch. The change in Gʹ for starches during holding at 10°C for 10 h is shown in . When Gʹ for starches was plotted against time, they showed increase and then a pseudoplateau value was reached after longer durations. TKS showed the lower pseudoplateau value which may be due to its lower gelation value. The rapid increase and pseudoplateau of Gʹ can be attributed to the rapid aggregation of amylose chains at the early stage and slow aggregation of amylopectin chains during long-term storage.[Citation28,Citation29]
FIGURE 5 (A) Changes in G′ for starches during cooling, holding at 10°C for 10 h and heating; (B) Changes in G′ during holding at 10°C for 10 h for starches.
CONCLUSIONS
Amylose content of TKS was lower than corn and mung bean starch. TKS showed A-type x-ray diffraction pattern similar to cereal starches and oval shape granules having smooth surfaces with no evidence of fissures. The length and breadth of TKS ranged between 2.9–6.15 µm. Pasting properties of TKS showed that its peak, trough and breakdown viscosity was higher than corn and mung bean starch. Gʹ of TKS was lower in comparison to other starches. Frequency dependence of Gʹ for TKS revealed its typical weak gel behavior. Rheological studies for starches were carried out during cooling, holding, and heating cycles. TKS showed lower increase in Gʹ in comparison to other starches. TKS could be successfully used as a low-cost replacement for corn starch as large amounts of seeds are presently discarded as waste. TKS should be more explored for its digestibility properties and chemical modifications so that this unique and novel starch can be efficiently utilized.
FUNDING
The financial support from University Grants Commission (UGC), New Delhi in the form of a research grant is gratefully acknowledged.
Additional information
Funding
Related Research Data
REFERENCES
- Siddhuraju, P. Antioxidant Activity of Polyphenolic Compounds Extracted from Defatted Raw and Dry Heated Tamarindus Indica Seed Coat. LWT–Food Science and Technology 2007, 40, 982–990.
- Kumar, C.S.; Bhattacharya, S. Tamarind Seed: Properties, Processing and Utilization. Critical Reviews in Food Science and Nutrition 2008, 48, 1–20.
- Shankaracharya, N.B. Tamarind-Chemistry, Technology, and Uses: A Critical Appraisal. Journal of Food Technology 1998, 35, 193–208.
- Kaur, M.; Singh, N.; Sandhu, K.S.; Guraya, H.S. Physicochemical, Morphological, Thermal, and Rheological Properties of Starches Separated from Kernels of Some Indian Mango Cultivars (Mangifera Indica L.). Food Chemistry 2004, 85, 131–140.
- Zhang, P.; Whistler, R.L.; BeMiller, J.N.; Hamaker, B.R. Banana Starch: Production, Physicochemical Properties, and Digestibility—A Review. Carbohydrate Polymers 2005, 59, 443–458.
- Sandhu, K.S.; Singh, N. Some Properties of Corn Starches II: Physicochemical, Gelatinization, Retrogradation, Pasting, and Gel Textural Properties. Food Chemistry 2007, 101, 1516–1524.
- AOAC. Official Methods of Analysis, 15th Ed; Association of Official Analytical Chemists: Washington, DC, 1990.
- Williams, P.C.; Kuzina, F.D.; Hlynka, I. A Rapid Calorimetric Procedure for Estimating the Amylose Content of Starches and Flours. Cereal Chemistry 1970, 47, 411–420.
- Leach, H.W.; McCowen, L.D.; Schoch, T.J. Structure of the Starch Granule I. Swelling and Solubility Patterns of Various Starches. Cereal Chemistry 1959, 36, 534–544.
- Craig, S.A.S.; Maningat, C.G.; Seib, P.A.; Hoseney, R.C. Starch Paste Clarity. Cereal Chemistry 1989, 66, 173–182.
- Zobel, H.; Young, S.; Rocca, L. Starch Gelatinization: An X-ray Diffraction Study. Cereal Chemistry 1988, 65, 443–446.
- Zhao, L.; Huang, J.; Man, J.; Huai, H.; Chen, Y.; Wei, C. Physicochemical Properties of Euryale Ferox Kernel Starches from Two Different Regions. International Journal of Food Properties 2016, 19, 289–299.
- Wu, Y.; Lin, Q.; Cui, T.; Xiao, H. Structural and Physical Properties of Starches Isolated from Six Varieties of Millet Grown in China. International Journal of Food Properties 2014, 17, 2344–2360.
- Uarrota, V.G.; Amante, E.R.; Demiate, I.M.; Vieira, F.; et al. Physicochemical, Thermal, and Pasting Properties of Flours and Starches of Eight Brazilian Maize Landraces (Zea Mays L.). Food Hydrocolloids 2013, 30, 614–624.
- Mweta, D.E.; Labuschagne, M.T.; Bonnet, S.; Swarts, J.; Saka, J.D.K. Isolation and Physicochemical Characterization of Starch From Coco Yam (Colocasia Esculenta) Grown in Malawi. Journal of Science of Food and Agriculture 2010, 90, 1886–1896.
- Blazek, J.; Copeland, L. Pasting and Swelling Properties of Wheat Flour and Starch in Relation to Amylose Content. Carbohydrate Polymers 2008, 71, 380–387.
- Sandhu, K.S.; Singh, N.; Kaur, M. Characteristics of the Different Corn Types and Their Grain Fractions: Physicochemical, Thermal, Morphological, and Rheological Properties of Starches. Journal of Food Engineering 2004, 64, 119–127.
- Kaur, M.; Sandhu, K.S.; Singh, N.; Lim, S.T. Amylose Content, Molecular Structure, Physicochemical Properties, and in Vitro Digestibility of Starches from Different Mung Bean (Vigna Radiata L.) Cultivars. Starch/Stärke 2011, 63, 709–716.
- Lindeboom, N.; Chang, P.R.; Tyler, R.T. Analytical, Biochemical, and Physicochemical Aspects of Starch Granule Size, with Emphasis on Small Granule Starches: A Review. Starch/Stärke 2004, 56, 89–99.
- Badenhuizen, N.P. The Biogenesis of Starch Granules in Higher Plants; New York, NY: Appeleton Crofts, 1969.
- Svegmark, K.; Hermansson, A.M. Microstructure and Rheological Properties of Composites of Potato Starch Granules and Amylose: A Comparison of Observed and Predicted Structure. Food Structure 1993, 12, 181–193.
- Abd Allah, M.A.; Foda, V.H.; Mahmoud, R.M.; Abou Arab, A.A. X-Ray Diffraction of Starches Isolated from Yellow Corn, Sorghum, Sordan, and Pearl Millet. Starch/Stärke 1987, 39, 40–42.
- Zhou, H.Y.; Wang, J.H.; Zhao, H.J.; Fang, X.S.; Sun, Y.H. Characterization of Starches Isolated from Different Chinese Baizhi (Angelica Dahurica) Cultivars. Starch/Stärke 2010, 62, 198–204.
- Huang, J.; Schols, H.A.; Soest, J.J.G.; Jin, Z.; Sulmann, E.; Voragen, A.G.J. Physicochemical Properties and Amylopectin Chain Profiles of Cowpea, Chickpea, and Yellow Pea Starches. Food Chemistry 2007, 101, 1338–1345.
- Hsu, S.; Lu, S.; Huang, C. Visco-Elastic Changes of Rice Starch Suspensions During Gelatinization. Journal of Food Science 2000, 65, 215–220.
- Tsai, M.L.; Li, C.F.; Lii, C.Y. Effect of Granular Structure on the Pasting Behaviors of Starches. Cereal Chemistry 1997, 74, 750–757.
- Eliasson, A.C. Viscoelastic Behavior During the Gelatinization of Starch I. Comparison of Wheat, Maize, Potato, and Waxy-Barley Starches. Journal of Texture Studies 1986, 17, 253–256.
- Miles, M.J.; Morris, V.J.; Orford, P.D.; Ring, S.G. The Role of Amylose and Amylopectin in the Gelation and Retrogradation of Starch. Carbohydrate Research 1985, 135, 271–281.
- Chang, Y.H.; Lim, S.T.; Yoo, B. Dynamic Rheology of Corn Starch–Sugar Composites. Journal of Food Engineering 2004, 64, 521–527.
- Evageliou, V.; Richardson, R.K.; Morris, E.R. Effect of Sucrose, Glucose, and Fructose on Gelation of Oxidized Starch. Carbohydrate Polymers 2000, 42, 261–272.