
Abstract
The effects of fish freshness (stored in ice for 0–18 days) on cook loss and shrinkage of grass carp (Ctenopharyngodon idellus) fillets following pasteurization treatments (70–90ºC, 0–60 min) were investigated. The cook loss and shrinkage of fish fillets increased with the severity of heat treatment, but decreased as the fish fillets became less fresh. A decrease in cook loss and shrinkage of fish muscles was tied to their changes in pH, total volatile base nitrogen and protein functionality. This study indicates the importance of using fish samples with consistent freshness in packaged pasteurized fish-based entrees.
INTRODUCTION
Cook loss and shrinkage of muscle foods, such as beef, pork, chicken, and fish, during thermal processing are among the most important quality attributes. Cook loss and shrinkage are not only directly related to sensory properties, in particular juiciness/dryness and toughness/tenderness as well as appearance of muscle foods, but are also tied to the loss of soluble nutrients and market value of these products. In addition, compared to other important quality attributes, such as texture and color, determination of cook loss and shrinkage are simpler and faster, and the results are usually more accurate, consistent and closely associated with sensory acceptability. For example, texture properties determined through compression, shear, or tensile forces are strongly dependent upon the test methods and equipment used and normally have large relative errors; similarly the color of muscle food may vary greatly between individual samples even when collected from the same batch.[Citation1]
Cook loss and shrinkage of meat or fish muscles are caused by heat induced protein denaturation, resulting in shrinkage of myofibers and collagen fibers and gelation of some soluble proteins.[Citation2] Cook loss and shrinkage of muscle foods are dependent upon both external factors, such as thermal processing conditions including heating temperature and time,[Citation3–Citation5] and internal factors which are physical and chemical properties of the tested samples. Among various factors tested about their effects on the cook loss and shrinkages of muscle foods, sample freshness is probably the least studied one, although samples with consistent freshness must be used in a well-designed experiment.
The effects of fish freshness on cook loss and shrinkage have been recognized as shown in some publications about the change in quality properties of fish muscles during cold storage.[Citation6–Citation9] However, there is a lack of systematic study using samples with well-controlled consistency to explain how cook loss and shrinkage are tied to the underlying chemical changes that occur immediately following the death of fish and with further changes in freshness during cold storage, in particular under a wide range of heating conditions. Understanding this phenomenon is becoming more important with the development of in-package pasteurization processes using either conventional retort heating or innovative dielectric heating which can occur over a wide range of thermal processing conditions, all of which could affect the overall sensory properties and market values of fish based entrees.
The purpose of this study was to use grass carp (Ctenopharyngodon idellus), one of the most widely cultured freshwater fish species in China, as a model system to investigate how the cook loss and shrinkage of fish fillets varying in freshness (stored in ice for 0, 1, 3, 7, 12, and 18 days) changed under different pasteurization treatments (70, 80, 90ºC, 0–60 min). The changes in pH, total volatile basic nitrogen (TVB-N), drip loss, and total soluble proteins (TSP) of fish muscles during storage were also evaluated in an attempt to explain the interactions of factors associated with freshness on cook loss and shrinkage.
MATERIALS AND METHODS
Sample Preparation
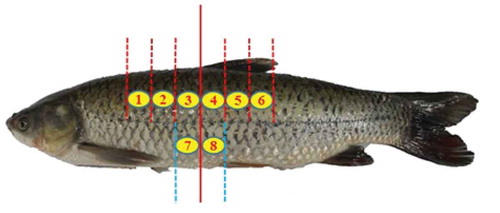
A total of 25 live grass carp (4047 ± 222 g) were purchased from a local vendor in Shanghai, China over a period of 6 months, and the vendor procured the fish from the same fish grower as per our request. One to three grass carp were obtained each time depending on the complexity of the experiments. Live grass carp were killed by a hard blow to the head, gutted, and cleaned. Using the insertion of the dorsal fin as the mid-line, the whole fish was cut into six steaks of 4 cm width (). After this, each steak was cut into half along the backbone, yielding a total of 12 portions. Fish portions were stored in ice for 0, 1, 3, 7, 12, or 18 days. After each period of storage time, part of the samples were used for the analysis of quality properties (including pH, TVB-N, TSP, and drip loss) and part of the samples for pasteurization treatments.
FIGURE 1 Sample locations of a grass carp (each cut was 4 cm width).
Determination of Moisture, Fat, and Proteins in Different Locations of Fish
Since the composition of fish fillets from different locations of a fish may vary, this would lead to sample inconsistency and affect both chemical and physical attributes of fish fillets during processing and storage.[Citation10] To ensure sample consistency, white muscles from 16 different locations of grass carp were analyzed for moisture, protein, and fat. These included 12 samples from the dorsal area (above the lateral line of fish) of each of the 12 fish portions mentioned above, and four samples from the ventral area of the two middle portions of the fish (). A total of four fish were analyzed in this manner, and duplicate measurements were conducted for each sample from the tested location of a fish.
The moisture contents of fish muscles were analyzed based upon an oven drying method.[Citation11] In brief, ca. 3.0000 g of minced white muscle was heated at 102°C for about 12 h until reaching a constant weigh. The fat contents of fish muscles were determined based upon an acid hydrolysis method,[Citation12] involving the use of HCl to hydrolyze fish muscles and petroleum ether to extract fat. The protein contents of fish muscles were analyzed using a Kjeldahl method with an automatic Kjeldahl apparatus (Kjeltec-8400, Foss, Copenhagen, Denmark).[Citation11] A conversion factor of 6.25 was used to calculate the amount of protein based on total nitrogen content.
Determination of pH, TVB-N, TSP, and Drip Loss
During storage, white muscles from the dorsal area of fish were analyzed for changes in pH, TVB-N, TSP, and drip loss. The values of pH and TVB-N are important chemical indicators for fish freshness, while TSP is tied to proteolysis and protein denaturation occurring during fish storage. The drip loss of fish muscle during storage might directly account for the change in cook loss of fish muscle during storage. The experiments were repeated four times using samples collected from four different fish, and triplicate measurements were conducted each time for each tested parameter.
To determine the pH of fish muscle, a mixture of 10 g of fish muscle and 100 mL of distilled water was homogenized (F6/10, FLUKO Equipment Shanghai Ltd., Shanghai, China) at a speed of 15,000 rpm for 30 s, and then filtered. Following this, a digital pH meter (pH-3C, Shanghai Leici Ltd., Shanghai, China) was used to measure the pH of the filtrate, reported as the pH of fish.[Citation13,Citation14]
To determine the TVB-N value of fish muscle, the filtrate of homogenized muscle (ca. 2.00 g sample in 20 mL water) was mixed with 25 mL of 10 g/L MgO and then distilled in an automatic Kjeldahl apparatus (Kjeltec-8400, Foss, Copenhagen, Denmark). The distillate was collected in a flask containing a 1% boric acid solution and titrated with a 0.1 N HCl to determine the amount of nitrogen (mg/100 g muscle).[Citation15]
The TSP of fish muscle was determined based upon the method of Joo et al.,[Citation16] and the detailed procedure was described in an earlier publication.[Citation3]
The drip loss of a fish portion is its weight loss in percentage after being stored in ice for a specific period of time.[Citation17] The tested fish portion was patted dried with paper towels to remove excess moisture before being weighed.
Thermal Treatments, Cook Loss, and Area Shrinkage
Before heat treatments, two square fillets (30 mm in length and 6 mm in thickness) were sliced from the dorsal area of a fish portion. Each fillet was vacuum sealed (YS-6,Yongsheng Ltd., Fujian, China) in a retort pouch (Weixi pack Ltd., Jiangsu, China), and then heated in a water bath (HAAKE PC300, Thermo Fisher Scientific, Waltham, MA, USA) at 70, 80, or 90ºC for 2, 5, 10, 30, or 60 min. The heating temperature and time were selected to cover a wide range of protocols used in cooking and in-packaging pasteurization.[Citation18,Citation19] After thermal treatments, the pouches were immediately immersed into a mixture of ice and water to rapidly cool them. Heat treated samples were patted dried with paper towels before being weighed, and then their photographic images were taken. The cook loss was defined as the loss of sample weight in percentage due to the heat treatment. The area shrinkage was defined as the decrease of surface area of a fish fillet in percentage calculated based on the images of raw and heat treated fish fillets, and the sample area was determined using ImageJ software version 1.46 (National Institute of Health, Bethesda, MD, USA). Since the surface areas for two sides of a cooked fish fillet may not be the same, an average of these two areas was used as the final surface area of the fish fillet.
A total of 24 square fillets could be obtained from each fish, which was not enough to complete one set of the experiments for cook loss and shrinkage at a specific temperature (e.g., 70ºC, 0–60 min, 5 variations) in one storage cycle (0–18 d, 6 variations). Thus, two fish were used for such a cycle: one for the heat treatments at a specific temperature involving samples stored in ice for 0–7 days, and the other for the heat treatments involving samples stored for 12 and 18 days. Triplicate experiments were conducted for each heat treatment.
Statistical Analysis
One-way analysis of variance (ANOVA) was used to evaluate whether there was significant difference (p ˂ 0.05) in the composition of different fish portions and in chemical properties (e.g., pH, TVB-N) of fish fillets stored for different time periods (Matlab 7.0.1, Mathworks Inc., Natick, USA).
RESULTS AND DISCUSSION
Moisture, Fat, and Protein Content in Muscle from Different Locations of Fish
–2c shows the average of moisture, fat, and protein content of white muscle from different locations () of four fish. There was no significant difference in composition among the six dorsal muscle portions, with an average of 79.2% (± 0.1%, standard deviation for muscles from six different locations) moisture, 19.4% (± 0.2%) protein, and 1.2% (± 0.1%) fat. However, white muscle from the ventral locations (labeled as 7 and 8 in and ) had a significant higher level of fat (2.6%), and somewhat lower level (although not significant) of moisture (78.2%) and protein (19.1%). In addition, variance among four fish was noticeable in : the average water content of dorsal muscles ranged from 77.3–80.4%, protein ranged from 18.6–20.3%, and fat from 0.8–1.7%.
FIGURE 2 Effects of locations of fish muscle portions on a: moisture, b: protein, and, c: fat content of white muscle (n = 4), and d: difference in moisture content at different locations of four fish ( shows the portions and front side of the fish). No significant difference in composition was found in different portions except that the lipids content in portions 7 and 8 (Fig. 2c) were significant different from that in portions 1–6.
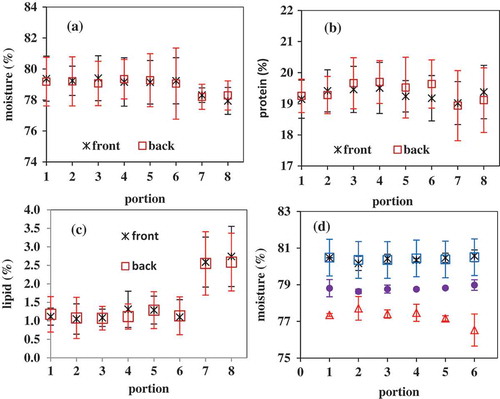
Since a relatively large sample size was required in this study, sample variance due to the difference in each individual fish is unavoidable, and we tried to minimize the sample variance by using a similar size of grass carp from the same supplier. In addition, muscle close to the head and tail generally have higher levels of moisture than those in proximity to the dorsal fin, which would likely lead to higher cook loss and shrinkage.[Citation10] Therefore, only dorsal white muscles from the six selected locations around the dorsal fin were used for the later experiments to ensure greater sample consistency.
Change in pH, TVB-N, TSP, and Drip Loss of Fish Muscle During Storage
The pH of grass carp muscle slightly decreased from 6.80 (± 0.02) to 6.72 (± 0.02) during the first 3 days of ice storage, and then slowly increased to 6.85(± 0.02) up to 18 days of storage (). Liu et al.[Citation15] reported a similar change of pH for grass carp stored at 0ºC, decreasing from about 6.74 to 6.68 in the first 3 days and then increasing to 6.85 on the 21st day. The postmortem pH drop was mainly attributed to the anaerobic degradation of glycogen to lactic acids in muscles, which depends on the stress before slaughter, fish species, seasons, and storage conditions.[Citation15,Citation20] In general, after an extended period of storage (>1 week), microbial spoilage and postmortem autolysis in fish muscle would lead to an accumulation of base compounds, therefore, an increase of pH after an initial pH drop.[Citation15, Citation20–Citation22]
FIGURE 3 Change in pH and TVB-N of fish muscle during ice storage (n = 4). The vertical bars represent the standard deviations. The pH values or TVB-N with different letters were significant different (p ˂ 0.05).
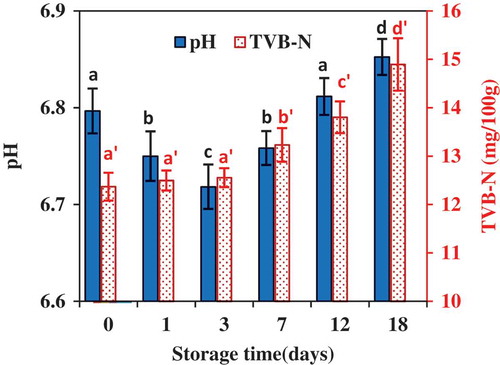
TVB-N is composed of ammonia, methylamine, dimethylamine, and other volatile amines, and has been used as a standard indicator for fish spoilage in some countries.[Citation15] For example, the maximum allowed level of TVB-N for freshwater fish is 20 mg/100 g, and for marine fish is 30 mg/100 g based upon a Chinese standard for fish.[Citation23] As shown in , The TVB-N of grass carp muscle remained stable (12.3 ± 0.3 mg/100 g, 12.5 ± 0.2 mg/100 g to 12.6 ± 0.2 mg/100 g) during the first 3 days of ice storage, and then continuously increased to 14.9 ± 0.54 mg/100 g at the end of 18 days of ice storage, but all below the maximum allowed level of 20 mg/100 g. An increase of TVB-N with time during ice storage is commonly found in an array of fish muscle. For examples, Castillo-Yanez et al.[Citation22] found that TVB-N in tilapia (Oreochromis niloticus) increased from 24.2 to 38.4 mg/100 g after 18 days of ice storage, Sharifian et al.[Citation24] observed an increase of TVB-N in tiger tooth croaker (Otolithes ruber) from 15.3 to 35.5 mg/100 g after 19 days, and Zhu et al.[Citation25] showed that TVB-N in crisp grass carp (Ctenopharyngodon idellus C. et V) increased from about 9 mg/100 g to 20.4 mg/100 after 10 days of ice storage. The increase of TVB-N in fresh fish muscle during ice storage was due to microbial activities leading to the degradation of proteins and non-protein nitrogenous compounds.[Citation15] There was no significant difference (p < 0.05) in TVB-N among fish samples stored for 0, 1, and 3 days, indicating that no obvious spoilage occurred during the first 3 days of ice storage,[Citation26] which was consistent with the results discussed above for the change in pH of fish muscle during ice storage.
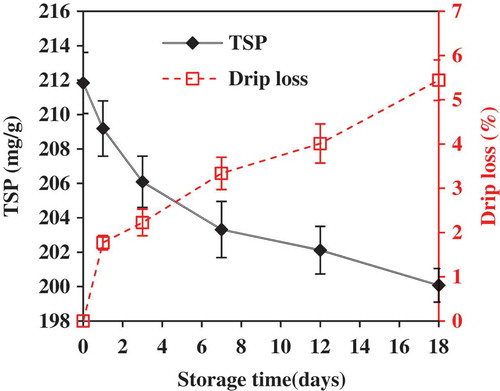
The levels of TSP slightly decreased from 211.8 ± 1.8 to 200.1 ± 1.0 mg/g, while drip loss slightly increased to 5.5 ± 0.5% during the 18 days of ice storage (). Among a few publications on the change in protein solubility of fish muscles during cold storage, the reported results were quite different depending upon fish species and types of proteins studied. The change in protein solubility showed a trend of decrease,[Citation6,Citation27] or increase first but then decrease[Citation28] during 2–3 weeks of ice storage. An increase in protein solubility during storage is generally attributed to the proteolysis happening within hours of postmortem that weaken fibrous linkage,[Citation19] while a decrease in protein solubility is believed to be caused by protein denaturation leading to exposure of more hydrophobic sites and thereafter, aggregation of protein molecules.[Citation27,Citation28] Protein denaturation and proteolysis have opposite impacts on the protein solubility of fish muscles, and the net effect depends upon fish species and freshness. The increase in drip loss during storage was very likely attributed to the protein denaturation leading to a decrease in the water holding capacity of myofibrillar proteins.
FIGURE 4 Change in total soluble proteins and drip loss of fish muscle during ice storage. The vertical bars represent the standard deviations (n = 4).
Cook Loss As Affected by Fish Freshness, Heating Time, and Temperature
shows that cook loss of fish fillets increased with heating time and temperature, although most of the cook loss occurred during the first few minutes of heating. Similar results were observed for Atlantic cod (Gadus morhua),[Citation29] pink salmon (Onchorychus gorbuscha),[Citation5] and blue mussel (Mytilus edulis).[Citation1] Cook loss and shrinkage of fish muscle is generally considered as the result of heat-induced protein denaturation and consequently shrinkage of myofibrillar protein. Higher heating temperature or longer heating time led to greater denaturation, and therefore, higher cook loss and shrinkage.[Citation1,Citation5]
FIGURE 5 Cook loss of fish muscle as affected by ice storage time (0–18 d) and the severity of heat treatment (n = 3).
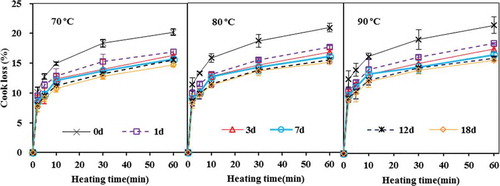
More importantly, shows that the freshness of fish muscle affects the cook loss. Under the same heat treatment, the cook loss of fish fillets previously stored in ice decreased as the storage time increased. For example, after being heated for 10 min at 80ºC, the cook losses of fish muscles were 15.8% (±0.7%, day 0), 13.0% (±0.5%, day 1), 12.6% (±0.4%, day 7), 11.2% (±0.3%, day 18), respectively; while after being heated for 60 min, the corresponding cook losses were 20.8% (±0.7%, day 0), 17.6% (±0.3%, day 1), 16.0% (±0.2%, day 7), 15.1% (±0.2%, day 18), respectively. Since the drip loss of fish muscle during cold storage may account for the decrease in cook loss of fish fillets as they became less fresh, the cook loss was adjusted to exclude the effect of drip loss by dividing the measured cook loss by a factor (1 minus drip loss). The adjusted cook loss of fish fillets showed very similar trend as that in (data not shown here), indicating that the drip loss was not the main reason for a decrease in cook loss as fish fillets became less fresh.
The cook loss of fish muscle as affected by fish freshness or cold storage conditions have been recognized in a few studies,[Citation6–Citation9] which, however, accounted for a very small part of the overall postmortem quality changes in the reported studies. The relevant experiments on cook loss were generally over-simplified, and the samples used were not well-controlled to optimize the sample consistency in these studies. In addition, the reported studies only address the cook loss of fish muscle or minced fish meat heated at a specific temperature for a fixed period of time. The use of one heating temperature and time does not reflect how the cook loss is influenced by heating conditions, and it is almost impossible to quantitatively compare results from different research groups applying different heat treatments. Furthermore, the impact of cold storage temperature condition prior to heat treatments on the cook loss have been quite inconsistent among the limited number of publications in this area. For examples, Fan et al.[Citation8] reported that the cook loss of black carp (Mylopharyngodon piceus) fillets previously stored at 4ºC for up to 12 days showed fluctuation (neither increased nor decreased) with an increase of storage time. Shi et al.[Citation9] indicated that the cook loss of silver carp (Hypophthalmichthys molitrix) stored up to 3 days in ice prior to thermal treatments tended to increase with the storage time. However, the study of Hong et al.[Citation7] using fish muscle close to the head of bighead carp (Aristichthys nobilis) showed that the cook loss of fish muscle decreased with the ice storage time for up to 9 days, but then increased until the 21st day.
The underlying mechanism leading to a decrease in cook loss as fish fillets became less fresh is still unclear. Here, we propose that myofibril and sarcomere were slowly broken down due to postmortem proteolysis during cold storage, which resulted in a less extent of muscle contraction upon heating and, therefore, less shrinkage of myofibrillar protein and water/cook loss. The impact of fish freshness on quality attributes such as cook loss should not be overlooked, and using fish muscles at different stages of freshness may result in inconsistent and even contradictory results. For example, the cook loss of 0-day fish muscle heated at 70ºC for 5–60 min were higher than those stored for 1 or more days and heated at 90ºC for the same time period; but as common knowledge, higher heating temperature should have resulted in greater cook loss. Therefore, to obtain consistent results on cook loss of fish muscle, samples should be collected from the same postmortem stage of fish.
Area Shrinkage as Affected by Fish Freshness and Heat Treatments
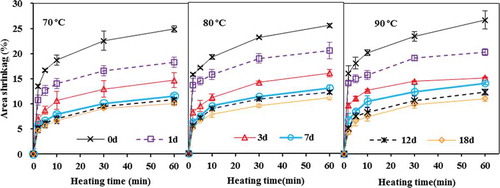
shows the effect of storage time, heating time and temperature on the area shrinkage of fish fillets. Similar to cook loss, the area shrinkage increased with heating time and temperature, and continuously decreased during 18 days of ice storage. A linear relationship was found between area shrinkage and cook loss (RCitation2 = 0.82). The similarity between the cook loss and area shrinkage of grass carp muscle as affected by ice storage and heat treatments was due to the same underlying mechanism governing these two quality attributes, which are tied to heat induced protein denaturation and shrinkage of myofibrillar proteins.
FIGURE 6 Area shrinkage of fish muscle as affected by ice storage time (0–18 d) and the severity of heat treatment (n = 3).
CONCLUSIONS
The cook loss and area shrinkage of fish fillets were not only affected by the severity of a pasteurization heat treatment, but also tied to the cold storage condition prior to the heating and the mechanism behind this was likely linked to postmortem proteolysis leading to less extent of muscle contraction upon heating. This study indicates that using fish with inconsistent freshness results in variability in cook loss and shrinkage following thermal treatments, which affects sensory properties and marketability of packaged pasteurized fish based entrees or meals.
FUNDING
This study was funded by the USDA-NIFA 2011-68003-20096, Shanghai Ocean University and the Washington State University Agricultural Research Center.
Additional information
Funding
Related Research Data
REFERENCES
- Ovissipour, M.; Rasco, B.A.; Tang, J.; Sablani, S.S. Kinetics of Quality Changes in Whole Blue Mussel (Mytilus Edulis) During Pasteurization. Food Research International 2013, 53, 141–148.
- Tornberg, E. Effects of Heat on Meat Proteins—Implications on Structure and Quality of Meat Products. Meat Science 2005, 70, 493–508.
- Niu, L.; Rasco, B.A.; Tang, J.; Lai, K.; Huang, Y. Relationship of Changes in Quality Attributes and Protein Solubility of Ground Beef Under Pasteurization Conditions. LWT–Food Science and Technology 2015, 61, 19–24.
- Ofstad, R.; Kidman, S.; Myklebust, R.; Hermansson, A-M. Liquid Holding Capacity and Structural Changes During Heating of Fish Muscle: Cod (Cadus Morhua L.) and Salmon (Salmo Salar). Food Structure 1993, 12, 163–174.
- Kong, F.; Tang, J.; Rasco, B.; Crapo, C. Kinetics of Salmon Quality Changes During Thermal Processing. Journal of Food Engineering 2007, 83, 510–520.
- Sarma, J.; Srikar, L.N.; Vidyasagar, R.G. Effect of Ice Storage on the Functional Properties of Pink Perch and Oil Sardine Meat. Journal of the Science of Food and Agriculture 1999, 79, 169–172.
- Hong, H.; Luo, Y.; Zhou, Z.; Bao, Y.; Lu, H.; Shen, H. Effects of Different Freezing Treatments on the Biogenic Amine and Quality Changes of Bighead Carp (Aristichthys Nobilis) Heads During Ice Storage. Food Chemistry 2013, 138, 1476–1482.
- Fan. H.; Luo, Y.; Yin, X.; Bao, Y.; Feng, L. Biogenic Amine and Quality Changes in Lightly Salt- and Sugar-Salted Black Carp (Mylopharyngodon Piceus) Fillets Stored at 4ºC. Food Chemistry 2014, 159, 20–28.
- Shi, C.; Cui, J.; Luo, Y.; Zhu, S.; Zhou, Z. Post-Mortem Changes of Silver Carp (Hypophthalmichthys Molitrix) Stored at 0°C Assessed by Electrical Conductivity. International Journal of Food Properties 2015, 18, 415–425.
- Kong, F.; Tang, J.; Rasco, B.; Crapo, C.; Smiley, S. Quality Changes of Salmon (Oncorhynchus Gorbuscha) Muscle During Thermal Processing. Journal of Food Science 2007, 72, S103–S111.
- National Food Safety Standard, Ministry of Health of the People’s Republic of China. GB 5009. 3–2010, Determination of Moisture in Foods; GB5009.5–2010, Determination of Protein in Foods.
- AOAC 948.15. Fat (crude) in Seafood, Acid Hydrolysis Method. In Official Methods of Analysis of AOAC International, 17th ed.; Horwitz, W.; Ed.; Association of Official Analytical Chemists: Arlington, VA, 2000.
- Goulas, A.E.; Kontominas, M.G. Effect of Salting and Smoking-Method on the Keeping Quality of Chub Mackerel (Scomber Japonicus): Biochemical and Sensory Attributes. Food Chemistry 2005, 93, 511–520.
- Fan, W.; Chi, Y.; Zhang, S. The Use of a Tea Polyphenol Dip to Extend the Shelf Life of Silver Carp (Hypophthalmicthys Molitrix) During Storage in Ice. Food Chemistry 2008, 108, 148–153.
- Liu, D.; Liang, L.; Xia, W.; Regenstein, J.M.; Zhou, P. Biochemical and Physical Changes of Grass Carp (Ctenopharyngodon Idella) Fillets Stored at –3 and 0ºC. Food Chemistry 2013, 140, 105–114.
- Joo, S.T.; Kauffman, R.G.; Kim, B.C.; Parka, G.B. The Relationship of Sarcoplasmic and Myofibrillar Protein Solubility to Colour and Water-Holding Capacity in Porcine Longissimus Muscle. Meat Science 1999, 52, 291–297.
- Wilkinson, R.J.; Paton, N.; Porter, M.J.R. The Effects of Pre-Harvest Stress and Harvest Method on the Stress Response, Rigor Onset, Muscle pH, and Drip Loss in Barramundi (Lates Calcarifer). Aquaculture 2008, 282, 26–32.
- Sun, X.; Tang, J.; Wang, J.; Rasco, B.A.; Lai, K.; Huang, Y. Formation of Advanced Glycation Endproducts in Ground Beef Under Pasteurisation Conditions. Food Chemistry 2015, 172, 802–807.
- Aamir, M.; Ovissipoura, M.; Rasco, B.; Tang, J.; Shyam Sablani, S. Seasonality of the Thermal Kinetics of Color Changes in Whole Spinach (Spinacia Oleracea) Leaves Under Pasteurization Conditions. International Journal of Food Properties 2014, 17, 2012–2024.
- Delbarre-Ladrat, C.; Chéret, R.; Taylor, R.; Verrez-Bagnis, V. Trends in Postmortem Aging in Fish: Understanding of Proteolysis and Disorganization of the Myofibrillar Structure. Critical Reviews in Food Science and Nutrition 2006, 46, 409–421.
- Li, K.; Luo, Y.; Shen, H. Postmortem Changes of Crucian Carp (Carassius Auratus) During Storage in Ice. International Journal of Food Properties 2015, 18, 205–212.
- Castillo-Yanez, F.J.; Jimenez-Ruiz, E.I.; Canizales-Rodriguez, D.F.; Marquez-Rios, E.; Montoya-Camacho, N.; Ruiz-Cruz, S.; Ocano-Higuera, V.M. Postmortem Biochemical Changes and Evaluation of the Freshness in the Muscle of Tilapia (Oreochromis Niloticus) During the Storage in Ice. Journal of Fisheries and Aquatic Science 2014, 9, 435–445.
- GB2733. 2005. Hygienic Standard for Fresh and Frozen Marine Products of Animal Origin. Ministry of Health of the People’s Republic of China. Standards Press of China: Beijing, China.
- Sharifian, S.; Zakipour, E.; Mortazavi, M.S.; Arshadi, A. Quality Assessment of Tiger Tooth Croaker (Otolithes Ruber) During Ice Storage. International Journal of Food Properties 2011, 14, 309–318.
- Zhu, Z.; Ruan, Z.; Li, B.; Meng, M.; Zeng, Q. Quality Loss Assessment of Crisp Grass Carp (Ctenopharyngodon Idellus C. et V) Fillets During Ice Storage. Journal of Food Processing and Preservation 2013, 37, 254–261.
- Ruiz-Capillas, C.; Moral, A. Sensory and Biochemical Aspects of Quality of Whole Bigeye Tuna (Thunnus Obesus) During Bulk Storage in Controlled Atmospheres. Food Chemistry 2005, 89, 347–354.
- Dileep, A.O.; Shamasundar, B.A.; Binsi, P.K.; Badii, E.; Howell, N.K. Effect of Ice Storage on the Physicochemical and Dynamic Viscoelastic Properties of Ribbonfish (Trichiurus spp) Meat. Journal of Food Science 2006, 70, E537–E544.
- Mehta, N.K.; Elavarasan, K.; Reddy, A.M.; Shamasundar, B.A. Effect of Ice Storage on the Functional Properties of Proteins from a Few Species of Fresh Water Fish (Indian Major Carps) with Special Emphasis on Gel Forming Ability. Journal of Food Science and Technology 2014, 51, 655–663.
- Skipnes, D.; Johnsen, S.O.; Skara, T.; Sivertsvik, M.; Lekang, O. Optimization of Heat Processing of Farmed Atlantic Cod (Gadus Morhua) Muscle with Respect to Cook Loss, Water Holding Capacity, Color, and Texture. Journal of Aquatic Food Product Technology 2011, 20, 331–340.