
Abstract
In the present work, the hydration and retro-gradation of mixtures of wheat starch and fructooligosaccharides in diluted hydrated matrixes were discussed. Rapid Visco-Analyzer, differential scanning calorimeter, Fourier transform-infrared spectroscopy, scanning electron microscopy, and x-ray diffraction were used to determine the properties of the mixture of wheat starch and fructooligosaccharides. Swelling of the wheat starch showed significant changes when the addition of fructooligosaccharides surpassed 0.1 g/g starch. Water absorption index showed obvious change but there was no regular variation. The water solubility index of starch increased after adding the fructooligosaccharides and the highest value was up to 19.85 as compared with the control (3.61). There was no significantly change for the pasting parameters of the mixture. Fructooligosaccharides significantly affected the enthalpy of wheat starch from the result of differential scanning calorimeter analysis, and enlarged the freezing scope of the mixture gel (from –23.09 ± 0.25ºC to –38.85 ± 0.32ºC). The melting enthalpy of sample with fructooligosaccharides decreased by 9.9 J/g as compared with the control. Fourier transform-infrared spectroscopy results showed that there were no obvious differences between the samples with or without fructooligosaccharides except that the O–H stretching vibration of hydrogen bond of the mixture gel strengthened after storage for 2 or 4 days. Scanning electron microscopy results indicated fructooligosaccharides should be conductive for starch to form fine gel structures and could inhibit the retrogradation of wheat starch. X-ray diffraction spectrum further illustrated the fructooligosaccharides could interfere with the retrogradation of wheat starch during storage.
INTRODUCTION
Oligosaccharides are soluble in water and around 0.3–0.6 times as sweet as sucrose. The sweetness of oligosaccharides depends on chemical structure, the degree of polymerization and the contents of mono- and di-saccharides in the mixture. The low sweetness makes them suitable as substitution for sucrose in foods for the person with diabetics, heart disease or thrombosis.[Citation1] The viscosity of oligosaccharides usually increases with their molecular weight and lead to improve body and mouthfeel. They also act as humectant to alter the freezing temperature of frozen foods and may affect the glass-transition temperature of foods.[Citation2] Oligosaccharides are easy to incorporate into processed foods because they do not bind minerals. Many of them have also been shown to be strong inhibitors of starch retrogradation.[Citation3,Citation4]
The important group of oligosaccharides is non-digestible sugars, including fructooligosaccharides (FOS), galactooligosaccharides (GOS), lactulose, soybean oligosaccharides, lactosucrose, isomalto-oligosaccharides (IMO), xylo-oligosaccharides (XOS), and palatinose. All these oligosaccharides present prebiotic characteristics and have been increasingly added to foods all over the world.[Citation5–Citation7]
FOS is a common name for fructose oligomers, mainly composed of kestose, nystose, and kestopentaose, in which fructosyl units are bound by a β-linkage at the position of sucrose and in which the degree of polymerization is less than 5.[Citation8] FOS has a number of health benefits and physicochemical properties[Citation9Citation10] and has got more and more wide application in food products as substitutes of sugar and lipid.[Citation11–Citation14] FOS has been classified as dietary fibers from not only an analytical but also physiological point-of-view. Due to the non-digestibility of FOS, they are found to be suitable for consumption by diabetics.[Citation15]
The caloric value of FOS is estimated to be 1.5 kcal/g.[Citation15] Although FOS can be used for either its nutritional advantages or technological properties, they are often applied for a dual benefit: an improved organoleptic quality and a better-balanced nutritional composition. Handa et al.[Citation16] investigated the physicochemical properties of FOS enriched cookies and found a reduction in the breaking strength as the FOS added as a sugar substitute from 40–80%. Another study conducted by Gallagher et al. where raffinose was used in short dough cookies at a level of 20–30% sugar replacement. The values for dough hardness were found to be lower than those obtained for the standard biscuit, and Peak force values of the reduced sugar biscuits were found to be significantly lower than the control biscuit, indicating a lower snapping characteristic, and therefore, softer eating characteristics.[Citation17]
Many studies have reported that the effects of FOS/inulin on the rheological properties of dough. Water absorption of dough decreased with the increase of inulin contents because of different degrees of polymerization of inulin.[Citation18–Citation20] Dough development time and stability were significantly increased with the addition of 1–4% inulin resulting in a strengthening of the dough,[Citation21] while the dough volume at maximum development was lower than the control.[Citation22] And the addition of FOS/inulin resulted in an increase in dough elasticity and increased its stability.[Citation23] Shorter chain inulins have less effects on dough rheology. About 5% addition of FOS seems achievable without too many detrimental consequences on dough machinability.[Citation24] Therefore, introducing prebiotics in flour products may be appealing for some reasons but it also may be a technical challenge.
On the basis of previous work, this article is about to investigate the effect of FOS on hydration properties of wheat starch and gel; crystallization and melting characteristics of mixture of FOS and wheat starch gel after freezing. We want to obtain the mechanism of FOS regulating the hydration properties of wheat starch, in order to provide some theoretical references, technology platform of solving processing technology problems, and quality problems during the application of FOS.
MATERIAL AND METHODS
Materials
Wheat starch was purchased from a local market (Xinxiang Wheat Starch factory, Xinxiang, China). FOS (including around 95% kestose and nystose, and a small amount of sucrose, fructose) was purchased from Henan Tianrun Biological Technology Co., Henan, China. Other reagents and chemicals were of analytical grade. Rapid Visco-Analyzer (RVA) analysis, DSC analysis, Fourier transform-infrared spectroscopy (FT-IR) analysis were conducted at Henan Institute of Science and Technology, and x-ray diffraction (XRD) analysis was conducted at Henan Normal University.
Measurement of Hydration Properties of Wheat Starch
The swelling volume was determined according to the method by Gularte and Rosell[Citation25] and Hera et al.[Citation26] with some modifications. Wheat starch (1.000 ± 0.005 g) with different content of FOS (0.05, 0.10, 0.15, 0.20, and 0.25 g) were placed in a stoppered graduated glass cylinder and mixed with distilled water (10 mL), then kept at 25ºC for 24 h. The swelling volume was calculated by dividing the total volume of the swollen sample and the original dry weight of the sample. The water binding capacity (WBC, defined as the amount of water retained by the sample under low-speed centrifugation) was determined as described by Hera et al.[Citation26] WBC was expressed as grams of water retained per gram of solid. The hydration properties of the mixture were analyzed in triplicate.
Measurement of Hydration Properties of Wheat Starch Gel
Water absorption index (WAI), swelling power (SP), and water solubility index (WSI) of the mixture gel of wheat starch and FOS were determined following the method of Hera et al.[Citation26] and Rosell et al.[Citation27] Three replicates were made for each sample. Residues (Wr) and dried supernatants (Ws) were weighed and WSI or SP, solubility index and SP were calculated as follows equations:
where Wi was the sample weight (g, db). Values were the average from three replicates.
RVA Analysis
Pasting properties of the wheat starch were measured by RVA (RVA-Tecmaster, Newport Scientific Pty. Ltd., Warriewood, Australia) according to the method of Zeng et al. with some modifications.[Citation28] Each sample was prepared by adding 3 g wheat starch, FOS by a certain proportion (0.1, 0.2, 0.3, 0.4, and 0.5 g), and 25 g distilled water. Parameters settings: Temperature was maintained at 50°C for 1 min, then heated to 95°C in 3.7 min. After that, the temperature was maintained at 95°C for 2.5 min and then cooled from 95 to 50°C in 3.8 min. At last, the sample was maintained at 50°C for 2 min. The rotating speed of the paddle was 160 rpm during determination except the paddle speed was 960 rpm at the first 10 s. The RVA parameters including peak, trough, final, breakdown (peak minus trough), setback (final minus trough) viscosity, peak time, and pasting temperature were obtained. Peak was the maximum viscosity during heating. Trough stood for the lowest viscosity in the RVA profile. Final viscosity meaned the viscosity of starch paste at the end of the determination curve. Breakdown reflected the thermal stability of the paste during holding at 95ºC. Setback indicated the hardness of gel paste by the end of the time of measurement. Peak time was when the viscosity had just come up to the peak. Pasting temperature should be the temperature when the starch started to swell. The hot starch gel was reserved for scanning electron microscopy (SEM) and XRD determination.
DSC Analysis
Samples were prepared
60 mg starch, FOS by a certain proportion (0, 4, 6, 8, and 10 mg), and 120 mg distilled water were mixed uniformly and then equilibrated in a refrigerator at 4°C for 24 h.
Thermal properties analysis
Thermal properties were determined by using the method of Zeng et al.[Citation29] with a differential scanning calorimeter (DSC, Q200, TA Instruments, USA). Samples (15 mg) were precisely weighed in the aluminum pans and sealed. The heating rate was at the rate of 10°C per min over the temperature range of 30–100°C. Enthalpy change (ΔH), gelatinization onset temperature (To), peak temperature (Tp), and conclusion temperature (Tc) were analyzed.
Frozen features analysis
The freezing point and the melting properties of starch gel were also measured by DSC.[Citation28] The 5 mg starch gel was taken and scanned from 40 or 60°C to –40°C at the rate of 10°C per min. After holding 5 min at –40°C, the samples were heated to 40°C at the rate of 10°C per min. An empty pan was used as the reference standard. The freezing point, melting enthalpy (MΔH), melting onset temperature (MTo), melting peak temperature (MTp), and melting conclusion temperature (MTc) were analyzed. Three replicates of each sample were analyzed.
FT-IR Analysis
In order to further determine the structure of starch gel with or without FOS, the FT-IR spectra were determined according to the method of Li et al.[Citation30] using FT-IR (Nicolet 470, PerkinElmer Inc. USA). The spectra were recorded in transmission mode from 4000 to 400 cm–1 (mid-infrared region) at a resolution of 0.44 cm–1. The sample was diluted with KBr (1:100, w/w) before acquisition and the background value from pure KBr was acquired before the sample was scanned.
SEM Analysis
Wheat starch gel (contained different ratio of FOS) was prepared according to the pasting properties. The hot starch gel was poured into a Petri dish with diameter 50 mm, then cooled to room temperature. The gel was then stored in a refrigerator at 4°C for different time (2, 4, and 6 days). Before determination, the stored gel was cut into slices (about 2 mm) and lyophilized with a freeze drier (alpha1-2LD, Marin Christ Co., Osterode, Germany).
SEM micrographs was recorded with a Quanta 200 environmental scanning electron microscope (FEI Company, Hillsboro, Oregon, USA). The slices were placed on SEM specimen stubs with double adhesive tape. The micrographs were obtained with an accelerating potential of 15 kV under low vacuum. The micrographs obtained were used to detect any changes to the starch granules.[Citation30]
XRD Analysis
The freeze-dried starch gel was smashed and sifted in a griddle with screen of 150 µm. The sifts was collected for XRD analyzing according to the method of Sun et al.[Citation31] Three replications were analyzed for each parameter and the mean was reported.
Statistical Analysis
The data obtained in this study were expressed as the mean of three replicate determinations and standard deviation (SD) by the use of DPS software (version 7.05). Statistical comparisons were carried out using Dixson test. p-Values of <0.05 were considered to be significant.
RESULTS AND DISCUSSION
Hydration Properties of Wheat Starch and Gel
FOS significantly impacted on the hydration of wheat starch (). Swelling increased with the increase of FOS addition, and there were significant difference when the addition of FOS surpassed 0.1 g/g starch. WBC showed no significant change with lower addition of FOS. When the content of FOS exceeded 0.15 g/g starch the wheat starch strongly retained the absorbed water. WAI and SP were used to assess the water absorption during thermal treatment. From , WAI was significantly decreased from 11.13 to 8.55 g/g with lower addition of FOS (only 0.05 g/g starch). The values increased with the increase of FOS addition, while decreased when the addition of FOS was over 0.10 g/g starch, the highest WAI (11.21 g/g) was obtained at 0.15 g FOS addition. The same tendency was observed in the swelling powder (first decreased from 11.55 to 9.74 g/g, then increased to 13.59 g/g). Oligosaccharides can exhibit the structure-making effect on their surrounding water,[Citation32] and effectively lower the mobility of water molecules hydrogen-bonded with saccharides.[Citation33] There might exist an interaction in the aqueous solution among water, wheat starch and FOS, thus bonded more water that the control wheat starch. Presumably, the addition of FOS affects the water uptake ability of wheat starch. WSI showed significant increase after added the FOS and the highest was obtained at the sample FOS 0.15 g/g starch.
TABLE 1 FOS affecting hydration properties of wheat starch
RVA
Pasting parameters of the wheat starch were listed in . From , when the addition of FOS was 0.1 g/3 g starch, all the pasting parameters changed little compared with the control. While the amount of FOS was 0.2 g/3 g starch, the peak, trough, breakdown, final and setback increased obviously. These results were different from the results of Rodriguez-Sandoval et al.[Citation34] which reports that when FOS was used at levels of 9, 17, and 29% of sour cassava starch replacement, the peak, breakdown, final, and setback viscosities of starch–FOS mixtures were lower than those of sour cassava starch due to the lower starch content. One reason may be that wheat starch is different from the sour cassava starch in many ways, such as shape, size, the ratio of amylose/amylopectin, and so on. Another possible explanation is the addition of FOS was different each other, so FOS show different behaviors. The highest peak, trough, final were found in the samples of FOS 0.5 g/3 g starch, and the breakdown and setback were found in the samples of FOS 0.4 g/3 g starch. FOS did not obviously impact on peak time. Compared with the control, the past temperature slightly decreased with the increase of the amount of FOS and the lowest was found in FOS 0.4 g/3 g starch.
TABLE 2 FOS effect on pasting properties of wheat starch
DSC
summarized the thermal parameters of wheat starch added a certain proportion of FOS. There was an endotherm peak centered at 65.41ºC (±0.42ºC) for wheat starch was observed. △H for all starch samples significantly increased with the increase of content of FOS and the highest △H was up to 4.689 ± 0.11 J/g. The To and Tp showed no obvious difference between the control and samples with FOS, while the Tc changed when the content of FOS altered. The lowest Tc (80.92ºC) was found in the sample with FOS 0.3 g/3 g starch.
TABLE 3 Effect of FOS on thermal parameters of wheat starch
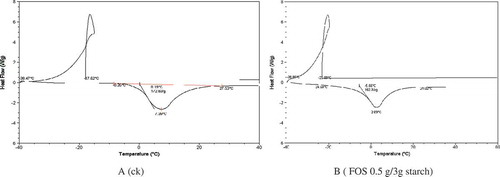
There was a strange loop in the DSC curve. The reason was that the freezing speed was fast, and in the process of freezing, crystal nucleus were formatted, and at the same time, heat was released, so the temperature was raised. But the rising rate was less than the freezing rate of the temperature, thus, the temperature continued to fall. Then the loop was formatted. After the thermal measurement, the freezing point and melting properties of starch gel were scanned by DSC. From , the range of freezing temperature of control was between –17.62 ± 0.2ºC and –38.47 ± 0.3ºC, while FOS enlarged the scope (from –23.09 ± 0.3ºC to –38.85 ± 0.3ºC). In addition, the ranges of melting temperature of the control and FOS sample were also different, –8.62 ± 0.3ºC to 27.53 ± 0.3ºC for control sample and –24.59 ± 0.3ºC to 24.02 ± 0.3ºC for FOS sample. However, the △H of sample with FOS decreased by 9.9 J/g compared with the control.
FIGURE 1 Effect of FOS on freezing point and melting properties of wheat starch gel.
FT-IR
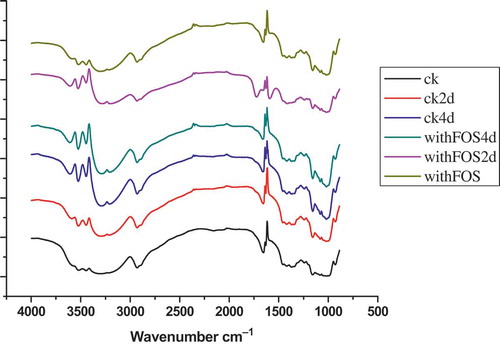
In general, O–H stretching vibration of hydrogen bond association appears in the range of 3650–3200 cm–1. As shown in , the peaks at 3600, 3500, and 3405 cm–1 could be attributed to O–H bond stretching, respectively, and 2,930 cm–1 to C–H bond stretching, while the peaks at 1420 and 1366 cm–1 were attributable to the bending modes of H–C–H, C–H, and O–H. The peaks at 1300~1000 cm–1 were attributed to C–O–H stretching. The peaks at 1155, 1097, and 1019 cm–1 were assigned as the C–O bond stretching. The bands at 1047 and 1022 cm–1 were associated with the ordered and amorphous structures of starch, respectively. The ratio of absorbance 1047:1022 cm–1 was used to quantify the degree of order in starch samples.[Citation14] The bands at 930~900 cm–1 were attributed to D-glucopyranosyl ring vibrational modes, 844 ± 10 cm–1 to the C–H absorbance of the D-glucopyranosyl rings and 766 ± 10 cm–1 to D-glucopyranosyl ring stretching. The 1670~1600 cm–1 bands were assigned to H2O bending vibrations. However, the O–H stretching vibration of the mixture gel with FOS strengthened more than that of the control sample after 2 storage days according to the peaks at 3600, 3500, 3405 cm–1. It was proved that the less amount of hydrogen bonding formed. The less hydrogen bonds form, the lower retrogradation rate is. This verified the lowest retrogradation rate of wheat starch blended with FOS.[Citation35]
FIGURE 2 FT-IR curves of wheat starch gel with different content of FOS.
SEM
presented the pore structure of starch gel with or without FOS. From , each plot was obtained at the same magnification (100×), so the size of gel pore was easily observed. In each plot there was a straight line on the right corner to specify the size of the gel pore. The gel pores in control () were obviously larger than those ones in samples with FOS (). During storage, the size of gel pore increased with the increase of storage time, and the pore of control samples was always larger than that of the samples with FOS (–). These results indicated that FOS should be conductive for starch to form fine gel structure and was benefit for inhibiting the retrogradation of wheat starch.
FIGURE 3 Scanning electron microscopy of gel structure stored several days. A: ck (0 day); B: FOS (0 day); C: ck (2 days); D: FOS (2 days); E: ck (4 days); F: FOS (4 days); G: ck (6 days); H: FOS (6 days).
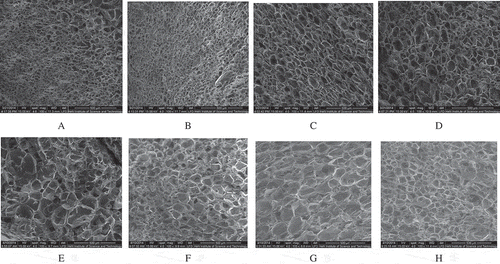
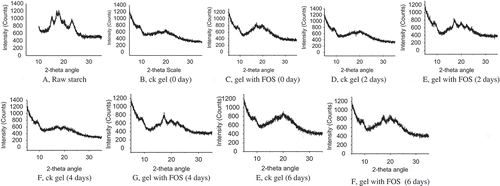
FIGURE 4 Effect of FOS on XRD pattern of the retrograded wheat starch (stored at 4ºC for 2, 4, and 6 days). A: Raw starch; B: ck gel (0 day); C: gel with FOS (0 day); D: ck gel (2 days); E: gel with FOS (2 days); F: ck gel (4 days); G: gel with FOS (4 days); E: ck gel (6 days); F: gel with FOS (6 days).
XRD
showed effect of FOS on XRD pattern of the retrograded wheat starch. After stored at 4ºC for several days the starch gel, with or without FOS, were performed on XRD instrument to determine the retrogradation characteristics. The XRD results showed that the raw starch displayed typical A-type X-ray diffraction patterns at 2-theta angle with the first peak around 15°, the second peak near 18°, and the third main reflection around 23°. However, the A-type crystallinity of raw starch was destroyed after gelatinization, while the gel with FOS retained some crystal characteristic at 2-theta angles 17 and 20° and the degree of crystallinity decreased. For all the samples, the degree of crystallinity increased with the increase of storage time of gel. The characteristic peak of ck gel located around 17 and 21° for storage 2, 4, and 6 days. While the samples with FOS located around 17, 21, and 23° for storage 2, 4, and 6 days, respectively. This indicated that FOS could interfere with the retrogradation of wheat starch. In addition, the degree of crystallinity of all the samples increased during storage.
CONCLUSION
The effect of FOS on the hydration and retrogradation properties of wheat starch and gel depended on the content of FOS in the mixture. Swelling of the wheat starch and WAI and WSI of wheat starch gel changed greatly than that of the control. FOS significantly affected the melting enthalpy of wheat starch and the melting enthalpy of sample with FOS decreased by 9.9 J/g. In addition, FOS could enlarge the freezing scope of the wheat starch gel. Although the O–H stretching vibration of hydrogen bond of the mixture gel strengthened after storage 2 days or 4 days according to FT-IR analysis, SEM and XRD results illustrated that FOS could greatly interfere the retrogradation of wheat starch gel.
ACKNOWLEDGMENT
The authors are grateful for being able to conduct the experiments at the Engineering Laboratory of Grain Resources Deep Utilization of Henan Province, China.
FUNDING
This study was funded by Program for Innovative Research Team (in Science and Technology) of University of Henan Province (13IRTSTHN006), National Natural Science Foundation of China (Grants 31571667), Joint Fund for Fostering Talents of National Natural Science Foundation of China and Henan province (Grants U1204315), Science and Technology Projects in Henan Province (12B550003, 13A550288, 14A550011), China and Key Teachers Funding Scheme in Henan Province (2010GGJS-141).
Additional information
Funding
REFERENCES
- Kazemipoor, M.; Cordell, G.A.; Sarker, M.M.R.; Radzi, C.J.B.W.M.; Hajifaraji, M.; En Kiat, P. Alternative Treatments for Weight Loss: Safety/Risks and Effectiveness of Anti-Obesity Medicinal Plants. International Journal of Food Properties, 2015, 18, 1942–1963.
- Schaller‐Povolny, L.A.; Smith, D.E.; Labuz, T.P. Effect of Water Content and Molecular Weight on the Moisture Isotherms and Glass Transition Properties of Inulin. International Journal of Food Properties 2009, 3, 173–192.
- Gudiel-Urbano, M.; Goñi, I. Effect of Fructooligosaccharide on Nutritional Parameters and Mineral Bioavailability in Rats. Journal of the Science of Food and Agriculture 2002, 82, 913–917.
- Wang, Y.; Zeng, T.; Wang, S.E.; Wang, W.; Wang, Q.; Yu, H.X. Fructo-Oligosaccharides Enhance the Mineral Absorption and Counteract the Adverse Effects of Phytic Acid in Mice. Nutrition 2010, 26, 305–311.
- Jaime, L.; Martínez, F.; Martín-Cabrejas, M.A.; MolláE López-Andréu, F.J.; Waldron, K.W.; Esteban, R.M.; Study of Total Fructan and Fructooligosaccharide Content in Different Onion Tissues. Journal of the Science of Food and Agriculture 2001, 81, 177–182.
- Voragen, A.G.J. Technological Aspects of Functional Food-Related Carbohydrates. Trends in Food Science & Technology 1998, 9, 328–335.
- Jovanovic-Malinovska, R.; Kuzmanova, S.; Winkelhausen, E. Oligosaccharide Profile in Fruits and Vegetables As Sources of Prebiotics and Functional Foods. International Journal of Food Properties, 2014, 17, 949–965.
- Blanch, M.; Goñi, O.; Sanchez-Ballesta, M.T.; Escribano, M.I.; Merodio, C. Characterisation and Functionality of Fructo-Oligosaccharides Affecting Water Status of Strawberry Fruit (Fragraria Vesca cv. Mara de Bois) During Postharvest Storage. Food Chemistry 2012, 134, 912–919.
- Arai, S. Global View on Functional Foods: Asian Perspectives. British Journal of Nutrition 2002, 88, 139–143.
- Lai, P.; Shiau C.J.; Wang, C.C.R. Effects of Oligosaccharides on Phase Transition Temperatures and Rheological Characteristics of Waxy Rice Starch Dispersion. Journal of the Science of Food and Agriculture 2012, 92, 1389–1394.
- Peressini, D.; Sensidoni, A. Effect of Soluble Dietary Fibre Addition on Rheological and Bread Making Properties of Wheat Doughs. Journal of Cereal Science 2009, 49, 190–201.
- Korus, J.; Grzelak, K.; Achremowicz, K.; Sabat, R. Influence of Prebiotic Additions on the Quality of Gluten-Free Bread and on the Content of Inulin and Fructooligosaccharides. Food Science and Technology International 2006, 12, 489–495.
- Schaller‐Povolny, L.A.; Smith, D.E.; Labuza, T.P. Effect of Water Content and Molecular Weight on the Moisture Isotherms and Glass Transition Properties of Inulin. International Journal of Food Properties 2000, 3, 173–192.
- Coussement, P.A.A.; Inulin and Oligofructose: Safe Intakes and Legal Status. Journal of Nutrition 1999, 129, 1412–1417.
- Roberfroid, M.B. Caloric Value of Inulin and Oligofructose. Journal of Nutrition 1999, 129, 1436–1437.
- Handa, C.; Goomer, S.; Siddhu, A. Physicochemical Properties and Sensory Evaluation of Fructooligosaccharide Enriched Cookies. Journal of Food Science and Technology 2012, 49, 192–199.
- Gallagher, E.; O’Brien, C.M.; Scannell, A.G.M.; Arendt, E.K. Evaluation of Sugar Replacers in Short Dough Biscuit Production. Journal of Food Engineering 2003, 56, 261–263.
- Karolini-Skaradzinska, Z.; Bihuniak, P.; Piotrowska, E.; Wdowik, L. Properties of Dough and Qualitative Characteristics of Wheat Bread with Addition of Inulin. Polish Journal of Food and Nutrition Sciences 2007, 57, 267–270.
- Hager, A.; Ryan, L.A.M.; Schwab, C.; Gaenzle, M.G.; O’Doherty, J.V.; Arendt, E.K. Influence of the Soluble Fibres Inulin and Oat Beta-Glucan on Quality of Dough and Bread. European Food Research and Technology 2011, 232, 405–413.
- Meyer, D.; Peters, B. Enhancing the Nutritional Value of Bread with Inulin. Agro Food Industry Hi-Tech 2009, 20, 48–50.
- Karolini-Skaradzinska, Z.; Bihuniak, P.; Piotrowska, E.; Wdowik, L. Properties of Dough and Qualitative Characteristics of Wheat Bread with Addition of Inulin. Polish Journal of Food and Nutrition Sciences 2007, 57, 267–270.
- Wang, J.S.; Rosell, C.M.; de Barber, C.B. Effect of the Addition of Different Fibres on Wheat Dough Performance and Bread Quality. Food Chemistry 2002, 79, 221–226.
- Rosell, C.M.; Santos, E.; Collar, C. Physical Characterization of Fiber Enriched Bread Doughs by Dual Mixing and Temperature Constraint Using the Mixolab (A(R)). European Food Research and Technology 2010, 231, 535–544.
- Morris, C.; Morris, G.A. The Effect of Inulin and Fructo-Oligosaccharide Supplementation on the Textural, Rheological, and Sensory Properties of Bread and Their Role in Weight Management: A Review. Food Chemistry 2012, 133, 237–248.
- Gularte, M.A.; Rosell, C.M. Physicochemical Properties and Enzymatic Hydrolysis of Different Starches in the Presence of Hydrocolloids. Carbohydrate Polymers 2011, 85, 237–244.
- De la Hera, E.; Gomez, M.; Rosell, C.M. Particle Size Distribution of Rice Flour Affecting the Starch Enzymatic Hydrolysis and Hydration Properties. Carbohydrate Polymers 2013, 98, 421–427.
- Rosell, C.M.; Yokoyama, W.; Shoemaker, C. Rheology of Different Hydrocolloids–Rice Starch Blends. Effect of Successive Heating-Cooling Cycles. Carbohydrate Polymers 2011, 84, 373–382.
- Zeng, J.; Gao, H.; Li, G. Functional Properties of Wheat Starch with Different Particle Size Distribution. Journal of the Science of Food and Agriculture 2014, 94, 57–62.
- Zeng, J.; Li, G.; Gao, H.; Ru, Z. Comparison of A and B Starch Granules from Three Wheat Varieties. Molecules 2011, 16, 10570–10591.
- Li, G.; Zeng, J.; Gao, H.; Li, X. Characterization of Phosphate Monoester Resistant Starch. International Journal of Food Properties 2011, 14, 978–987.
- Sun, J.; Zhao, R.; Zeng, J.; Li, G.; Li, X. Characterization of Destrins with Different Dextrose Equivalents. Molecules 2010, 15, 5162–5173.
- Uedaira, H. The Effect of Sugars on the Stability of Protein Structure. Sen-i Gakkaishi 1981, 37, 436–443.
- Kawai, H.; Sakurai, M.; Inoue, Y.; Chujo, R.; Kobayashi, S. Hydration of Oligosaccharides: Anomalous Hydration Ability of Trehalose. Cryobiology 1992, 29, 599–606.
- Rodriguez-Sandoval, E.; Landi Franco, C.M.; Manjarres-Pinzon, K. Effect of Fructooligosaccharides on the Physicochemical Properties of Sour Cassava Starch and Baking Quality of Gluten-Free Cheese Bread. Starch/Stärke 2014, 66, 678–684.
- Lian, X.; Zhu, W.; Wen, Y.; Li, L. Xiaoshuang Zhao. Effects of Soy Protein Hydrolysates on Maize Starch Retrogradation Studied by IR Spectra and ESI-MS Analysis. International Journal of Biological Macromolecules 2013, 59, 143–150.