
Abstract
This study evaluated the rheological behavior of Burkina Faso honey and the use of exponential and polynomial models to predict the influence of chemical composition and temperature on the viscoelastic parameters: complex viscosity (η*) and loss modulus (G’’). Samples were first characterized by evaluating: water activity, 5-hydroxy methyl furfural, sugars (fructose, glucose, and sucrose), electrical conductivity, moisture, and color. Dynamic rheological properties were obtained at different temperatures (5, 10, 15, 20, 25, 30, and 40°C). All the honeys displayed Newtonian behavior. Complex viscosity and loss modulus can be predicted based on the chemical composition and temperature using polynomial models (R2 > 98.00%).
INTRODUCTION
In Burkina Faso, situated in West Africa, beekeeping activities have increased in the last years, thanks in part to the installation of beekeeping promotion centers, sponsored by beekeeper organizations.[Citation1] These activities are helping in the production of honey, and therefore, are playing an important role in society by creating sustainable livelihoods. The current development in Burkina honey production is reflected in the number of scientific articles published in recent years. For example, different authors studied the impact of storage conditions on the physicochemical characteristics of Burkina Faso honey;[Citation1] the impact of climatic changes on nectar considering honey production by honeybee colonies in a specific zone of Burkina Faso;[Citation2] the compliance of international standards related to the importation and sale of honey in Burkina Faso.[Citation2]
As far the authors know, there is no research related to the rheological properties of honey from this country. Knowledge about the rheological behavior of viscous food stuff is useful in quality and process control.[Citation3] The rheological properties influence the sensory quality of honey and also affect a number of technological operations, such as heating, mixing, filtering, hydraulic transport, and packaging.[Citation3–Citation6] The importance of measuring the rheological properties of honey is reflected in the volume of research published in the last decade about honey from different countries.[Citation4,Citation5] For this reason, the aim of this study was to predict the influence of chemical composition and temperature on the viscoelastic parameters of honey (complex viscosity: η* and loss modulus: G’’) using the exponential model and the polynomial model. As honey rheology is directly related to different chemical parameters,[Citation3,Citation5,Citation6] samples were first characterized from a chemical point-of-view.
MATERIALS AND METHODS
Honey Samples
Honey (18 samples) from three different places (Kampène, Bouroum-Bouroum, and Passena) in the Poni region situated in the Southwestern region of Burkina Faso were provided by beekeepers. The tropical savanna climate (Aw by Köppen-Geige) is characteristic of this region with monthly mean temperatures above 27ºC, and a long dry season. The representative vegetation in this area is based on bush-like plants for example yams (Dioscorea spp.) and trees such as the néré (Parkia biglobosa), the karité (Vitellaria paradoxa), the baobab (Adansonia digitate L.), and the caïlcédrat (Khaya senegalensis). As the rheological parameters of honeys can be influenced by the presence of crystals and air bubbles,[Citation7,Citation8] they were warmed up to 55°C before being used, and kept in flasks at 30°C to remove air bubbles that could interfere with rheological studies.[Citation4]
Physicochemical Analyses
The physicochemical properties (5-hydroxy methyl furfural [HMF], moisture, electrical conductivity) and Pfund color, were determined according to the harmonized methods of the international honey commission.[Citation9] HMF was analyzed by the high-performance liquid chromatography–ultraviolet (HPLC-UV) chromatographic methodology using a column ZORBAX Eclipse Plus C18 (4.6 × 150 mm, 5 μm particle size) purchased from Agilent (Agilent Technologies, USA). Water-methanol (90:10, v:v) was used as the mobile phase for this analysis
The detector was set to 285 nm. The EZChrom Elite system software was used for HMF data processing. Moisture content was determined by refractrometry (Abbe-type model T1 Atago, USA) and the Chataway table. Electrical conductivity was obtained by conductimetry (Crison Instrument, Barcelona, Spain, model C830). Color was determined with a millimeter Pfund scale C 221 honey color analyzer (Hanna Instruments, Spain).
Water activity (aw) was measured at 25°C (±0.2°C) using an electronic dewpoint water activity meter, Aqualab Series 4 model TE (Decagon Devices, Pullman, Washington, USA), equipped with a temperature-controlled system.[Citation10] Sugars content (glucose, fructose, and sucrose) were analyzed in a high performance anion exchange chromatography with pulsed amperometric detection (HPAEC-PAD) high-resolution ionic chromatograph with a pulsed amperometric detector (PAD; Bioscan, Methrom, Switzerland) and a Metrosep Carb chromatographic column (styrene divinylbenzene copolymer, 4.6 × 250 mm). Carbohydrates were eluted with NaOH 0.1N at a flow rate of 1 mL min−1.[Citation11] Quantification of sugars was realized using external standards constructing the corresponding calibration curves. All analyses were performed in triplicate.
Viscoelastic Measurement
A RheoStress 1 rheometer (ThermoHaake, Germany) was used to determine the dynamic rheological properties of honey samples at different temperatures (5, 10, 15, 20, 25, 30, and 40°C), by means of a parallel plate system (Ø 60 mm) with a gap of 500 µm. The measurement at each temperature was carried out twice using a fresh sample of honey. The sample was loaded, and left for 5 min to allow the sample to reach the desired temperature. To obtain the linear viscoelastic range, the stress sweeps were run at 1 Hz first. A stress of 1 Pa, which was in the linear viscoelastic region, was chosen. The frequency sweeps were performed over the range w = 0.62 – 62.83 rad/s. The experimental data were used to calculate storage (or elastic) modulus (G’), loss (viscous) modulus (G’’), and complex viscosity () using Rheowin Job software (v. 2.93, Haake, Germany).
Statistical Analysis
The variables were weighted with the inverse of the standard deviation of all objects in order to compensate for the different scales of the variables. The proposed models were made using SPSS trial version, Excel 2007, Statgraphics trial version, and Design Expert trial version. To verify the suitability of the models, the average absolute deviation (AAD; Eq. [Citation1]) was calculated:
RESULTS AND DISCUSSION
Physicochemical Characterization
Different physicochemical parameters were analyzed
HMF, moisture, electrical conductivity, Pfund color, water activity content, and sugars content (glucose, fructose, and sucrose). HMF (hydroximethylfurfural) is considered the best indicator of warming or natural ageing as they cause a progressive increment in its level. In the present work the HMF content of Burkina Faso samples ranged between 1.02 and 35.60 mg/kg, lower than those reported by other authors in honey from this country.[Citation1,Citation2] In this article, none of the samples exceeded the overall permitted limit of 80 mg/kg for tropical honey and even the limit of 40 mg/kg established as acceptable for other types of honey;[Citation12] even though the yearly average temperature of Burkina Faso is around 27–28ºC. Therefore, the samples analyzed can be considered to be quite fresh honey. With respect to the moisture, the values of the samples varied from 17.9 to 22.1 g/100 g, which exceeds the limit of 20 g/100 g established by the Council Directive relating to honey.[Citation12] These values can be considered to be normal in honey although special attention should be paid to those that exceed this limit due to the higher tendency to ferment.
Electrical conductivity (related to mineral salt content, organic acids, proteins and polyols,) ranged between 683 and 1022 μS/cm. Most of the samples could be considered to be honeydew honey since they surpassed 800 μS/cm.[Citation12] This matches with the high Pfund color values, which varied between 91 and 150. These values were in the same range as those reported by other authors for Burkina Faso honey.[Citation1,Citation2] With respect to water activity, the values ranged between 0.61–0.66, higher than the values reported by other authors in tropical honey.[Citation13] The level of glucose plus fructose sugars (62–78 g/100 g), and sucrose sugar (1–2 g/100 g) correspond to the values considered as adequate in pure honey.[Citation12]
Rheological Properties of Honey
shows the rheograms for three honeys, each from one of the different areas studied in the Poni region of Burkina Faso: (1) Kampène, (2) Bouroum-Bouroum, and (3) Passena. It can be observed that the rheological parameters analyzed (complex viscosity (η*), loss modulus (G’’), and storage modulus (G’) are strongly influenced by temperature. The values of the rheological parameters (G’, G”) increased with the frequency applied to the sample, showing that G’’ had a greater magnitude than G’, which can be observed in . The honey has a higher viscous viscoelastical behavior than an elastic one. The elastic component of the viscoelastical behavior of honey is a negligible one. Regarding the complex viscosity (η*), the values were not influenced by the frequency applied, which is specific for a Newtonian fluid. Therefore, it can be ascertained that the honey behaved as a Newtonian fluid () as in honey from other countries such as Romania[Citation4] and Spain.[Citation5,Citation14] The evolution of phase angle (δ) proved the Newtonian behavior of honey because its values are close to 90° for all the honeys at all the temperatures analyzed.
FIGURE 1 Rheological behaviour of honey: (1) Kampène, (2) Bouroum Bouroum, and (3) Passena; a (complex viscosity); b (loss modulus); c (elastic modulus); 5°C (◊); 10°C (□); 15°C (Δ); 20°C (×); 25°C (ж); 30°C(O); 40°C (+).
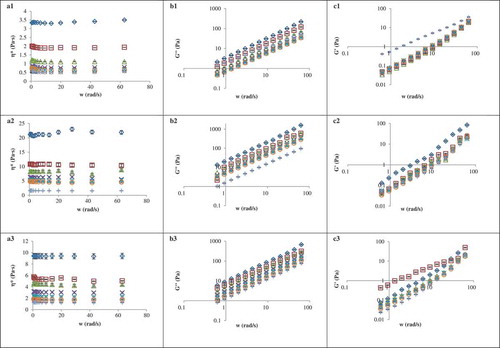
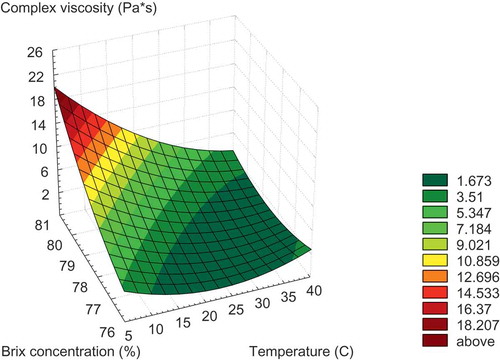
FIGURE 2 Influence of temperature and concentration on complex viscosity of honey from Burkina Faso.
Because G’ has a lower magnitude than G’’, it is considered that it has less importance for honey.[Citation15] Consequently, different authors noted that the elastic behavior of honey seems to be less important than its viscous behavior.[Citation16] The rheological properties of honey can also be affected by other factors such as the polymeric compounds and sugars, since the solutions of glucose and fructose have different rheological properties.[Citation3,Citation4,Citation17] Below, the complex viscosity and loss modulus modeling, based on temperature, chemical composition influence using different models (exponential and polynomial models) are presented.
Viscosity Modeling
Effect of temperature
The influence of temperature on the complex viscosity of honey is described using the Arrhenius model, which is:
where η*0 is a constant, R is the gas constant [kJ·mol–1·K–1], and Ea activation energy (an energy barrier to flowing) [kJ·mol–1], T is absolute temperature [K]. With respect to activation energies, their magnitude ranged between 41.07–48.58 kJ/mol. These values are strongly influenced by the moisture content; decreasing with the increase in the moisture content. The activation energies for the Burkina Faso honey presented in this study are smaller than those reported in the case of Romanian honeys[Citation4] and in Spanish honeys[Citation3,Citation5] due to the higher moisture content of Burkina Faso honey than the honeys from Romania and Spain. The data were fitted well to the Arrhenius model (the regression coefficients are around 0.99).
Effect of concentration
The influence of the sugar concentration (C), expressed in °Brix, on the complex viscosity of honey was described by Power law (Eq. [Citation3]):
and exponential models (Eq. [Citation4]):[Citation15]
where C is the concentration in °Brix and ,
are constants. The model parameters have been computed using non-linear regression. According to the regression coefficients values (R2) both models are suitable for predicting the influence of concentration on complex viscosity of honey. In order to calculate the model constants, the viscosity data were fitted to Eqs. (3–4) by non-linear regression. The resulting values of the constants are presented in . The coefficients of regression (R2) are very similar, so the two models are suitable for describing the effect of the soluble solids on honey viscosity. However, using the absolute average deviation it seems that the Power law model is more suitable for predicting the influence of concentration on the complex viscosity of honey.
TABLE 1 Effect of °Brix concentration (C) on the complex viscosity of honey from Burkina Faso at different temperatures (T)
For a given temperature, the activation energy (Ea) for flow is influenced by soluble solid content, which can be described by several models.[Citation18] In the present work, two models have been used (Eq. [Citation5] and Eq. [Citation6]).
where, A1, A2, B1, and B2 are constants. The activation energies and the model parameters were computed by non-linear regression. The coefficients of regression (R2) of the two models proposed above are the same. Computing the AAD of the activation energies, it can be observed that the exponential model was better than the Power law model in describing the dependency of Ea on °Brix concentration.
Combined effect of temperature and concentration
In practice, it is useful to obtain a general equation of the combined influence of the temperature and concentration on complex viscosity of honey.[Citation19] shows the combined influence of temperature and concentration on honey viscosity: the plot is made up using the experimental data of complex viscosity in function of the temperature (5–40°C) and concentrations (76–81 °Brix) used. In this article, two models of complex viscosity of honey were investigated (Eq. [Citation7] and Eq. [Citation8]) as there was reported in the case of other honeys from other countries:[Citation3,Citation5]
The data used in the two equations were fitted to these models by the non-linear regression, and the values of the model constants were determined. The complex viscosity predictions with temperature and °Brix concentration achieve coefficients of regression between 0.644 and 0.898 (). The average absolute deviation (AAD) confirms that the suitable model corresponds to Eq. (7). Therefore, for the interval of °Brix concentrations and temperatures (T) studied, the following equation (Eq. [Citation9]) is suggested for evaluating honey viscosity:
TABLE 2 Combined effect of °Brix concentration and temperature on the complex viscosity of honey from Burkina Faso
Polynomial modeling of viscosity
The data model which predicts the complex viscosity of honey according to its chemical composition (sugars, non-sugars components, moisture content, etc.) and temperature was made using a 3rd degree polynomial equation with seven variables. The measured and predicted values were compared to check the appropriateness of the model. The equation of the model is as given (Eq. [Citation10]):
where is the complex viscosity predicted, b0 is a constant that fixes the response at the central point of the experiments, bi is a regression coefficient for the linear effect terms, bij is an interaction effect term, bii is a quadratic effect term, and biii is a cubic effect term. The operating region and the levels of the design variables, key factors, are shown as actual and coded values in .
TABLE 3 Correspondence between actual and coded values of design variables
A 3rd order polynomial equation with seven variables for viscosity was obtained as follows based on the design variables (Eq. [Citation11]):
The coefficient of regresion of the proposed model (p = 0.005) represents 99.38% (R2 adjusted 98.87%, ADD = 16.60). In the measured and predicted values of viscosity are represented. Acording to Eq. (10), it can be observed that moisture content and non-sugar substances do not influence the equation. Fructose and temperature have a negatively linear influence while glucose has a positive one.
FIGURE 3 Measured versus predicted values on complex viscosity of honey from Burkina Faso.
Loss Modulus Modeling
Influence of temperature
The influence of temperature on honey loss modulus was also studied using the Arrhenius model.
where G0 is a constant, R is the gas constant [kJ·mol–1·K–1], and Ea activation energy (the energy barrier to flowing) [kJ·mol–1], T is absolute temperature [K]. The activation energy (Ea) values, calculated by the Arrhenius model ranged between 24.09 and 48.11 kJ/mol. G’’ influenced the magnitude of the activation energy. The activation energy is negatively correlated with moisture. In terms of regression coefficients they were greater than 0.99 for all the samples analyzed.
Effect of concentration
The influence of the concentration (C, °Brix) on the honey loss modulus can be described by Power law (Eq. [Citation13]):
And the exponential model (Eq. [Citation14]):[Citation15]
where C is the concentration in °Brix and,
are constants. With the aim of calculating the model constants, the loss modulus data were fitted to Eqs. (13 and 14) by non-linear regression. The values of the parameters are presented in . According to the ADD values, it seems that the Power law model is more suitable for predicting the loss modulus evolution than the exponential model.
TABLE 4 Effect of °Brix concentration (C) on the loss modulus of honey from Burkina Faso at different temperatures (T)
Considering the mean relative deviation, it appears that the exponential models are more suitable for predicting the influence of the concentration on the magnitude of loss modulus. For a given temperature, the activation energy for flow depends on the soluble solid content which can be described using several models.[Citation18] In the present work, two models were applied (Eqs. [15] and [Citation16]):
where ,
,
, and
are constants. The Ea values and the concentration of the corresponding honey were fitted to Eqs. (15 and 16) by non-linear regression in order to determine the model parameter).The coefficients of regression (R2) of the two models proposed above are the same (R2 = 0.91). The Power law model is more suitable for predicting the activation energy value because of the much lower ADD values (12.55 in the case of Eq. [15], and 30.56 in the case of Eq. [15]).
Combined effect of temperature and concentration
It is advantageous to obtain an equation describing the combined effect of temperature and concentration on the viscoelastic parameter.[Citation19] The combined effect of temperature and concentration on loss modulus is shown in . The following models for loss modulus were investigated (Eqs. [17] and Citation18]):
FIGURE 4 Influence of temperature and concentration on loss modulus of honey from Burkina Faso.
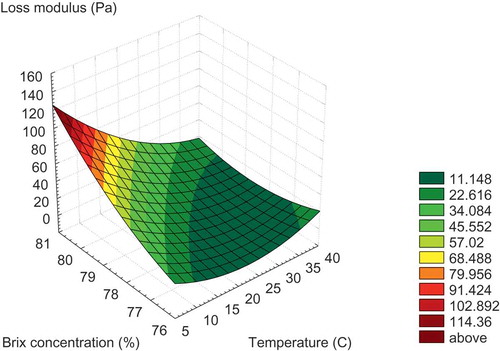
The loss modulus, concentration, and temperature data were fitted to these models by the nonlinear regression and the values of the model constants were calculated. The values of these constants are shown in . In the case of the loss modulus predictions, according to the temperature and concentration, the regression coefficients ranged between 0.550 and 0.908. The ADD value indicates that Eq. (17) was the most appropriated model in the case of Spanish honey.[Citation3] Therefore, for the interval of °Brix concentrations and temperatures (T) studied, the following equation (Eq. [Citation19]) is suggested to evaluate the loss modulus (G’’) of honey:
TABLE 5 Combined effect of °Brix concentration and temperature on the loss modulus of honey from Burkina Faso
The activation energy of the honey complex viscosity (Eq. [Citation8]) and the activation energy of honey loss modulus (Eq. [Citation19]) are quite similar. This fact confirms that the honey is indeed a Newtonian fluid.
Polynomial modelling of loss modulus
The data model for the prediction of loss modulus (G’’) of honey according to the chemical composition, moisture content and temperature was made using a 3rd degree polynomial equation with seven variables as in the case of honey viscosity. The equation of the model is (Eq. [20]):
where is the loss modulus predicted, b0 is a constant that fixes the response at the central point of the experiments, bi is the regression coefficient for the linear effect terms, bij is an interaction effect term, bii is a quadratic effect term, and biii is a cubic effect term. A 3rd order polynomial equation with seven variables for loss modulus was obtained, based on the design variables (; Eq. [21]):
The regression coefficient for the polynomial model is 98.87 (R2 adjusted 97.94, p = 0.005, ADD = 19.34). The measured and predicted values of loss modulus are plottedin . In the case of Eq. (21) it can be observed that fructose and temperature have a linear negative influence while glucose has a positive influence. The moisture content and non-sugar substances do not have an influence on the model.
FIGURE 5 Measured versus predicted values on loss modulus of honey from Burkina Faso.
CONCLUSIONS
The Burkina Faso honey displayed Newtonian behavior at all the temperatures analysed (5, 10, 15, 20, 25, 30, and 40°C). The loss modulus had a higher magnitude than the storage modulus, displaying a solid-like behavior (G’’ ≫ G’). The polynomial modeling was indeed a good tool for predicting the complex viscosity and the loss modulus; correlation coefficients higher than 98% were observed, 99.38% in the case of complex viscosity, and 98.87% in the case of loss modulus. Fructose and temperature have a negative linear influence on loss modulus and complex viscosity, and therefore, on the prediction of both of these factors, while glucose has a positive influence.
FUNDING
The authors thank the Universitat Politècnica de València for funding the project “Seguridad alimentaria en la Región Suroeste de Burkina Faso. Capacitación en manipulación, transformación y conservación de alimentos locales, y contra la malnutrición infantil (BONALIMENT2013)”, in the framework of the Program ADSIDEO of the Àrea de Cooperació al Desenvolupament.
Additional information
Funding
Related Research Data
REFERENCES
- Nombré, I.; Schweitzer, P.; Boussim, J.I.; Rasolodimby, J.M. Impacts of Storage Conditions on Physicochemical Characteristics of Honey Samples from Burkina Faso. African Journal of Food Science 2010, 4(7), 458–463.
- Schweitzer, P.; Nombré, I.; Kwamé, A.; Boussim, J. Physico-Chemical and Labeling Control of Imported Honeys in Burkina Faso. Food and Nutrition Sciences 2013, 4, 1266–1270.
- Oroian, M.; Amariei, S.; Escriche, I.; Leahu, A.; Damian, C.; Gutt, G. Chemical Composition and Temperature Influence on the Rheological Behaviour of Honeys. International Journal of Food Properties 2014, 17(10), 2228–2240.
- Oroian, M. Physicochemical and Rheological Properties of Romanian Honeys. Food Biophysics 2012, 7(4), 296–307.
- Oroian, M.; Amariei, S.; Escriche, I.; Gutt, G. Rheological Aspects of Spanish Honeys. Food and Bioprocess Technology 2013, 6(1), 228–241.
- Yanniotis, S.; Skaltsi, S.; Karaburnioti, S. Effect of Moisture Content on the Viscosity of Honey at Different Temperatures. Journal of Food Engineering 2006, 72(4), 372–377.
- Bhandari, B.; Arcy, B.D.; Chow, S. Rheology of Selected Australian Honeys. Journal of Food Engineering 1999, 41(1), 65–68.
- Mossel, B.; Bhandari, B.; D’Arcy, B.; Caffin, N. Use of Arrhenius Model to Predict Rheological Behaviour in Some Australian Honeys. LWT–Food Science & Technology 2000, 33, 545–552.
- Bogdanov, S.; Martin, P.; Lullmann, C. Harmonised Methods of the International Honey Commission; Swiss Bee Research Centre: FAM, Liebefeld, 2002.
- Chirife, J.; Zamora, M.C.; Motto, A. The Correlation Between Water Activity and % Moisture in Honey. Fundamental Aspects and Application to Argentine Honeys. Journal of Food Engineering 2006, 72, 287–292.
- Juan-Borrás, M.; Domenech, E.; Hellebrandova, M.; Escriche, I. Effect of Country Origin on Physicochemical, Sugar, and Volatile Composition of Acacia, Sunflower, and Tilia Honeys. Food Research International 2014, 60, 86–94.
- Council Directive 2001/110 Relating to Honey. Official Journal of the European Communities L10 2002, 47–52.
- Elbanna, K.; Attalla, K.; Elbadry, M.; Abdeltawab, A.; Gamal-Eldin, H.; Ramadan, M.F. Impact of Floral Sources and Processing on the Antimicrobial Activities of Different Unifloral Honeys. Asian Pacific Journal of Tropical Disease 2014, 4(3), 194–200.
- Oroian, M.; Amariei, S.; Escriche, I.; Gutt, G. A Viscoelastic Model for Honeys Using the Time–Temperature Superposition Principle (TTSP). Food and Bioprocess Technology 2013, 6(9), 2251–2260.
- Doublier, J.L.; Cuvelier, G. Gums and Hydrocolloids: Functional Aspects. In Carbohydrates in Food (2nd ed.). A. C. Eliasson; Ed.; Taylor & Francis Group/LLC-CRC Press: Boca Raton, FL, 2006; 233–272.
- Yoo, B. Effect of Temperature on Dynamic Rheology of Korean Honeys. Journal of Food Engineering 2004, 65(3), 459–463.
- Kang, K.M.; Yoo, B. Dynamic Rheological Properties of Honeys at Low Temperatures As Affected by Moisture Content and Temperature. Food Science and Biotechnology 2008, 17(1), 90–94.
- Giner, J.; Ibarz, A.; Garza, S.; Xhian-Quan, S. Rheology of Clarified Cherry Juices. Journal of Food Engineering 1996, 30(1), 147–154.
- Ibarz, A.; Pagan, J.; Miguel Sanz, R. Rheology of Clarified Fruit Juices. II: Blackcurrant Juices. Journal of Food Engineering 1992, 15(1), 63–73.