
ABSTRACT
Evaluation of canning quality of beans is commonly carried out by simple visual inspection that is time-consuming, resource intensive, and biased by the experience of the panelist. Moreover, there is not a standard scale to rate visual quality traits of canned beans. In this research, a machine vision system was implemented and tested for automatic inspection of color (COL) and appearance (APP) in canned black beans. Various color and textural image features (average, standard deviation, contrast, correlation, energy, and homogeneity from red, green, blue, lightness, red/green, yellow/blue, hue, saturation and value color scales) were extracted from beans and brine images, and evaluated to predict the quality rates for COL and APP of a group of bean panelists using multivariate statistics. Sixty-nine commercial canned black bean samples from different brands and markets were used for analysis. In spite of the “fair” agreement among the sensory panelists for COL and APP, as determined by multi-rater Kappa analysis, machine vision data based on partial least squares regression model showed high predictive performance for both COL and APP with correlation coefficients of 0.937 and 0.871, and standard errors of 0.26 and 0.38, respectively. When a classification was performed based on both COL and APP traits, a support vector machine model was able to sort the samples into two sensory quality categories of “acceptable” and “unacceptable” with an accuracy of 89.7%. Using simple color and texture image data, a machine vision system showed potential for the automatic evaluation of canned black beans by COL and/or appearance as a professional visual inspection.
Introduction
Black beans (Phaseolus vulgaris L.) are grown and consumed widely in diverse regions of the world.[Citation1] In the United States, the average annual production of black beans, which was around 90 thousand metric tons in 1999–2003, has shown a tremendous growth in recent years with 2009–2013 figures as 154 thousand metric tons,[Citation2] due in part to increased exports to Mexico. Increased popularity of black beans among U.S. consumers due to their nutritional value, culinary attributes, low cost, and sustainable production have also contributed to this trend.[Citation3] Black beans are commonly consumed as a canned product in different presentations such as in brine or sauce, refried beans, and soup among others.[Citation4]
Among the sensory traits, color and appearance play a key role in the quality definition of canned black beans for several reasons. Color and appearance are the first sensations that the consumer perceives, and are commonly used as quick indicators for the acceptance or rejection of the canned beans. During canning and processing, beans are prone to loss of seed color and firmness, skin breakage, and seed splitting in different degrees.[Citation5] The preparation conditions cause structural changes in cells that have a bearing on consumer and processor preferences, and hence, processing requirements (e.g., in soaking and cooking conditions) for improving the visual and internal quality of canned beans. Color retention represents an integral component of canning quality in black beans. The black color is due the presence of anthocyanins in the seed coat. These compounds are water soluble and readily leach out of seed during soaking and thermal processing thereby the final canned product may appear discolored grey or brown which affects consumer acceptance of the canned beans.[Citation6] Finally, consumers have specific preferences about color and appearance of canned black beans.[Citation7] Hence, evaluation of canning quality of black dry beans presents unique challenges because of the nature of black bean color and impact on its sensory attributes after processing.[Citation8,Citation9]
In practice, evaluation of canning quality is frequently carried out by simple visual inspection which is in general time-consuming and resource intensive, and also biased by the experience of the panelist, and even for trained inspectors, it is made more difficult since specific standard charts for rating color and appearance quality of canned black beans are not available yet in the trade. Colorimeters and spectrophotometers are also used for measuring color in research labs and some industrial facilities, which allow accurate and reproducible measurements of the colors (in XYZ, RGB [red, green, blue], and L*a*b* [lightness, red/green, yellow/blue] color spaces including chrome and hue) not influenced by the observer or surroundings. However, their main disadvantages are that the surface color must be quite uniform or homogeneous, and that many locations on the sample must be measured to obtain a representative color profile.[Citation10] In addition, with canned beans, these instrumental techniques do not give information about the quality appearance involving seed integrity, incident of splitting, defects, and uniformity of the bean seeds.
An interesting alternative is computerized image analysis techniques, also known as computer vision or machine vision, which can offer an objective measure for color and appearance among other physical factors from a single digital image.[Citation11] Basically, the system consists of standard illuminants, a digital still or video camera for image acquisition, and computer software for image processing and analysis. The implementation of the technique must consider a color calibration and camera characterization of the imaging setup with the aim to guarantee standard measurements of color, as they are obtained using a conventional colorimeter.[Citation12] Today, the tendency in research labs and the food industry is to implement simple sensing techniques for quality assessment and control that are objective, reproducible, as well as non-invasive. The impact of computer tools in the field of sensory evaluation was previously discussed by Roos[Citation13] and Risvik and Rogers.[Citation14] Johansen et al.[Citation15] tested the prediction of sensory properties (appearance, mouthfeel, and perceived texture) of low-fat yogurt and cream cheese using surface images. More recently, automatic non-invasive food freshness estimators in leafy vegetables based on machine vision and image analysis showed that luminance statistics were highly correlated with freshness ratings for a cabbage leaf.[Citation16,Citation17] Until now, to our knowledge, machine vision has not been used for predicting sensory quality ratings in canned black beans.
In addition to color, the evaluation of local image information such as textural properties of an image are important for several image processing applications and analysis. The meaning of the term texture in image processing is completely different from the usual meaning of texture in foods. Image texture can be defined as the spatial organization of intensity variations in an image at various spectral wavelengths.[Citation18] The spatial and spectral patterns of a gray scale or intensity image would provide unique 2D spatial features or signatures for each sample. Thus by analyzing the images using image texture parameters which provide summary information about the regularity or uniformity, local variation and pattern organization of the pixel intensity values on the image, we may ascertain or quantify automatically some critical structural and topographic changes in processed beans that are related to color and appearance of the canned samples.
Therefore, the objectives of this study were: (1) to implement a color calibrated imaging system for acquisition and analysis of images of processed black beans, (2) to evaluate the potential of RGB, L*a*b*, HSV (hue, saturation, value), and gray scale intensity parameters (average and standard deviation) and their image texture information (contrast, correlation, energy, and homogeneity from each color scale) to characterize and to predict five quality categories for color and appearance of commercial canned black beans, and (3) to evaluate the feasibility of a simple statistical classifier to sort canned black beans by color and appearance into “acceptable” and “unacceptable” quality groups.
Materials and Methods
Bean Samples and Experimental Procedure
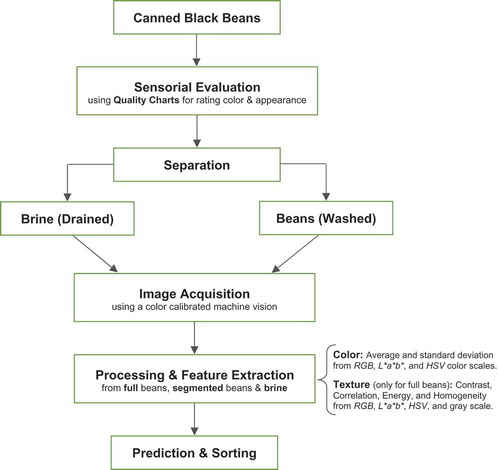
Canned black beans from 18 different brands and five markets surrounding Lansing, Michigan, USA, with different production dates (including those labeled as reduced sodium [13 samples], no salt added [nine samples], organic [eight samples)], low calorie [16 samples], and those without special indication or referred to a “regular” [23 samples]) were collected for this study. Thus, a total of 69 bean samples were evaluated by a panel test using a color (COL) and appearance (APP) charts of rates specially developed for this purpose. The quality charts with 5-point rating scale for COL and APP were designed based on a preliminary test using a similar set of commercial canned beans, and taking into consideration the wide variability in COL and APP found in canned black beans in the area of Lansing, Michigan. A machine vision system was also implemented and calibrated for image acquisition, processing and measurement of standard color and textural parameters for the full field of view or segmented regions of interest in the image. The digital images of beans (after draining and washing) and their brine were then preprocessed and the image data extracted for prediction of the sensory quality rates and classification tests. depicts the experimental procedure for the quality evaluation of commercial canned black beans.
Figure 1. Experimental procedure for automatic quality evaluation of black beans.
Sensory Analysis
Upon opening, canned beans were visually evaluated for overall appearance (i.e., seed shape, splits, clumps, color uniformity, and visual aspects such as surface texture and color and composition of brine), and for black color retention (or discoloration) by an expert sensory panel of 17 persons on a 5-point Hedonic scale or categories for COL and APP represented on charts specially developed for canned black beans. The sensory testing panel consisted of eight women (ages, 28–45 years) and nine men (ages, 32–55 years) among postgraduate students, technicians, researchers, and professors at Michigan State University working in bean breeding, production, and canning. Panelists were selected by their vast experience in quality of raw and processed beans; and before the sensory test, they received both written and verbal instructions on the evaluation procedure using the COL and APP quality charts. After a preliminary practice test, the sensory test was carried out and the resultant APP and COL scores were then averaged across judges for each sample and used in further prediction and sorting analyses. Sensory and sensing evaluations were made on contents of all opened cans within a 5-hour time period. Additionally, in order to evaluate the accuracy and consistency of the panelists’ ratings, three samples coming from a large can were independently included and labeled to be tested by the panelists.
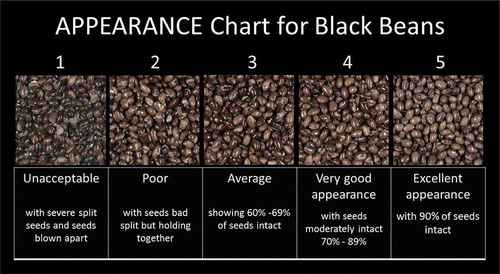
It should be noted that the visual appearance scores were redefined from the seminal work conducted by Hosfield and Uebersax[Citation19] as: 1: unacceptable; 2: poor; 3: average; 4: very good; and 5: excellent appearance. The color scores were defined as: 1: very light (brown); 2: light (dark brown or light grey); 3: average (gray-black and brown-black); 4: dark (medium black); and 5: very dark (black uniform). The selected images included in the COL and APP charts were those representing the average scores of a group of 13 panelist from a preliminary experiment using a similar set of commercial canned black beans. and show the developed COL and APP quality charts for canned black beans used for the sensory test.
Figure 2. Color chart for black beans representing five typical categories found in commercial canned beans (note that the color categories were reproduced using the same bean image with different tones).
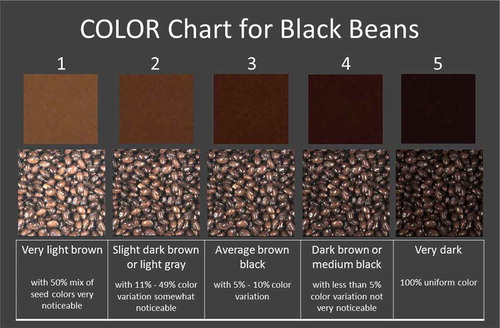
Figure 3. Appearance chart for black beans after drained representing five typical quality categories found in commercial canned beans.
In addition, the Free-marginal Multirater Kappa () method was used for the estimation of agreement between the raters or bean panelists. Multirater
is a statistical measure of inter-rater agreement for qualitative items, and it is recommended when raters are not restricted in the number of cases that can be assigned to each category, which is often the case in the typical agreement study.[Citation20] The method is independent on their marginal distributions of frequency rates, such that allows for analysis of distributions of cases into categories with high degree of asymmetry. Values of Kappa can range from –1.0 to 1.0, with –1.0 indicating perfect disagreement below chance, 0.0 indicating agreement equal to chance, and 1.0 indicating perfect agreement above chance. One possible interpretation of Kappa suggested by Feinstein and Cicchetti[Citation21] is: <0 = less than chance agreement; 0.01–0.2 = slight agreement; 0.21–0.40 = fair agreement; 0.41–0.60 = moderate agreement; 0.61–0.80 = substantial agreement; 0.81–0.99 = almost perfect agreement. The analysis was carried out using the interactive online Kappa calculator freely available from Randolph.[Citation20]
Image Acquisition System
The implemented machine vision system has three main components: an illumination source, a color digital camera (CDC), and an image processing software package. The lighting system consisted of two parallel lamps with three fluorescent tubes per lamp (model T4, Fluorescent 8-Watt 13-5/8” fixture set, 3-prong unit, SavioLighting, Inc., Framingham, MA, USA) with a color temperature of 6400 K (day light) and covered with plastic light diffuser. Both lamps (17 and 1/2” long) were situated 35 cm above the sample, and the angle between the camera lens and the lighting source axis was approximately 45º (viewing/illuminating geometry of 0/45), since diffuse reflection responsible for the color occurs at this angle. The CDC was a Canon model EOS Rebel T3i digital single-lens reflex camera (Canon, Melville, NY, USA) mounted on a stand vertically over the background at a distance of 10 and 3/4”. The camera was connected to the universal serial bus (USB) port of a personal computer (Dell Computer Corporation, Round Rock, TX, USA) provided with a remote shooting software EOS Utility from Canon (version 2.10 for Windows, Canon) to adjust the camera settings, visualize, and acquire the digitalized images directly from the computer.
Also, considering the effect of ambient illumination which is critical in achieving reproducible imaging conditions, the sample illuminators and the CDC were placed inside a metallic box whose internal walls were painted black to avoid external light and reflections. Then, a standard grey card (20 × 25 cm2) with 18% of reflectance (Neutral Test Card, Kodak, Rochester, NY, USA) was used as a white reference to set the white balance of the CDC and to standardize the illumination intensity level on the system background. A mean CIELAB L*-value of 50 ± 1 in the image histogram of this card ensured the 18% reflectance of the acquisition system. Prior to acquiring images, the lighting system was switched on for 30 min for its stabilization. Images were captured using the following camera settings: manual exposure mode with the lens aperture value at f = 5.6, speed at 1/40 s (zoom and flash functions were off), resolution of 1728 × 1728 pixels, and storage in JPEG format using the CDC mode image-recording quality “small size” and “fine quality” (“small1/fine”). All the algorithms for image preprocessing, segmentation, color characterization, color space transformation, color, and texture image feature evaluations of canned beans were performed using the image processing toolbox of MATLAB v7.5 (The MathWorks, Inc., Natick, MA, USA).
Color Calibration and Characterization of the Imaging System
Color calibration is concerned with setting the imaging system to a known state producing consistent and reproducible color values; and characterization is the relationship between image primaries, RGB, and a device-independent color space specified by the International Commission on Illumination (CIE), such as the CIE XYZ, or CIE L*a*b* (CIELAB).[Citation22] In this sense, one way to use a digital camera as a colorimeter is to find a model, often some type of regression, which directly maps RGB values to CIE XYZ or CIELAB values. The use of a common target-based color characterization, in the calibration of machine vision system, solves many of the problems that have to do with color matching. The basic idea of color target-based characterization is to use a reference target that contains a certain number of color samples of known tristimulus values which are contrasted with the output average signals captured in standard illumination conditions by an imaging sensor.[Citation23]
The CDC characterization was performed following the procedure detailed by Valous et al.[Citation12] First, the CDC sensor responses were evaluated using the standard color rendition chart ColorChecker (Gretag-Macbeth, New Windsor, NY, USA), which is a checkerboard array of 24 scientifically prepared colored patches (4 × 4 cm2) in a wide range of colors (white, black, dark skin, light skin, blue sky, foliage, blue flower, bluish green, orange, purplish blue, moderate red, purple, yellow green, orange yellow, blue, green, red, yellow, magenta, cyan, and four shades of grey). The ColorChecker was photographed using the implemented machine vision to obtain the input device RGB signals in the theoretical range of 0–255. In our experiments, the camera RGB values for each color patch were calculated by averaging RGB values of 80% of the pixels in the patch, excluding the boundary pixels. Analysis of the relationships between RGB results from the machine vision and the CIE tristimulus values from the ColorChecker (expressed as sRGB D65) confirmed the common non-linearity observed between both RGB signals. Then, the polynomial transform procedure proposed by Hong et al.[Citation23] was used to match the known CIE values. This procedure is frequently used for CDC signal correction (if required, for non-linear relationships and offsets) and characterization of the spectral sensitivities of digital still cameras and recording devices.
The polynomial modelling uses the least squares fitting technique to derive the coefficients of [3×n] polynomial transfer matrices, whose performance is iteratively evaluated. The choice of a calibration polynomial (P[3×n]) is examined to achieve a reasonable degree of modeling accuracy. The mapping from normalized (0–1) and linearized RGB camera responses [rgb] to CIE XYZ can be represented by:
where [XYZ] is a [24×3] matrix of tristimulus values from the ColorChecker, [rgb] is a [24×n] matrix of augmented linearized camera responses, and [C] is a [n×3] matrix of coefficients to be determined. The coefficients of the polynomials were determined using pseudo-inverse methods.[Citation21] The idea behind using polynomials is that the vector P[3×n]can be expanded by adding more terms, so that better results can be achieved. In this study, the following polynomials were tested:
Then, using the recommended coefficients by the Rec. ITU-R BT. 709-5,[Citation24] the calibrated [XYZ] values are mapped to the sRGB (D50) system by:
and from that to CIE L*a*b* color space (or CIELAB D50 2° observer)[Citation25] using the makecform (‘srgb2lab’) function implemented in MATLAB v7.5. In food research, color is frequently represented using the L*a*b* color space. This color model is considered approximately uniform, and hence, its use is essential for applications where the results must match those of the human perception. For comparisons among the tested polynomials, the CIELAB color differences, [Citation25] were computed by the equation:
Feature Extraction from Full and Segmented Regions of Interest
Feature extraction is performed to obtain image parameters of canned bean images in the terms of color and texture. Three types of images were analyzed for predicting COL and APP rates in canned beans: (1) the full color image of beans after draining and washing; (2) the segmented foreground bean regions after draining and washing, aimed to eliminate the image background as well as the shaded bean seeds in the deeper layers of the image; and (3) the full image of the brine. depicts a representative set of the three types of images of commercial canned beans used for analysis. It should be noted that color analysis was performed on the three types of images (Color (full seed), Color (segmented seed), and Color (full brine)), and the image texture analysis only on the full image of beans (Texture (full seed)). Preliminary prediction tests with textural parameters showed a significantly higher performance using the full image compared with those using the segmented and brine image types.
Figure 4. Original and preprocessed images of canned black beans and brine. A: Original color image after draining and washing, B: segmented beans from the original image (with black background), and C: brine.
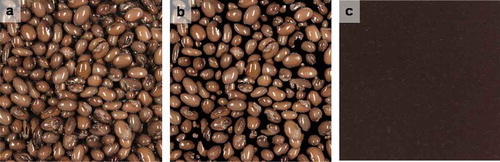
The segmented images () were obtained applying a marker-controlled watershed segmentation procedure implemented for this purpose. The procedure involved morphological operations (opening and closing by reconstruction) to clean up the image, and the binarization using the combination of L*, a*, and b* intensity images of the CIELAB color space since the combination of these bands better represented the shape and contours of the bean seeds’ foreground in the image.
Color analysis
18 measurements of color were extracted from the three types of images: the average intensity of RGB, L*a*b*, and HSV color channels and their standard deviations. The HSV channels were obtained using the “rgb2hsv” function implemented in MATLAB v7.5.
Image texture analysis
A total of 40 textural measurements based on the computation of a grey level co-occurrence matrix (GLCM) were extracted from the full image of beans. The GLCM represents the distribution of co-occurring values over an image at a given offset. Mathematically, a GLCM is a matrix of size (
is the number of grey levels) defined for a displacement of d-pixels along a given direction
. The entry
of this matrix is the number of occurrences of a pair of grey levels,
and
, for the specified displacement. Once the GLCM is defined, 28 textural descriptors can be evaluated as proposed by Haralick et al.[Citation18] However, we only chose four descriptors, namely, contrast, the correlation, energy, as well as the homogeneity, which showed the lowest possible correlation with each other. Thus, the intensity images of RGB, L*a*b*, HSV, and gray scale were analyzed using four independent directions,
= 0, 45, 90, 135º, with a distance of d = 1; but to guarantee rotation invariance measurements, only the average of the four directions were used in further analysis. The GLCM parameters were computed by the following equations:
where and
are the means, and
and
are the standard deviations. Contrast measures the local variations between a pixel and its neighbor over the whole image; so higher contrast values indicate large local variations. Correlation is a measure of how correlated a pixel is to its neighbor over the whole image; correlation is 1 or –1 for a perfectly positively or negatively correlated image. Energy measures the textural uniformity of the image, i.e., the repetition of pixel pairs, energy is 1 for a constant image. Finally, homogeneity returns a value that measures the closeness of the distribution of elements in the GLCM to the GLCM diagonal, homogeneity is 1 for a diagonal GLCM.
Model Development for Prediction and Classification
Partial least squares regression (PLSR) is a widely used chemometric method for building calibration models. PLS components are computed under the constraint of maximization of covariance between inputs and outputs. Hence, it can provide a set of orthogonal factors that have the best predictive power from the combinations of different methods with an increased number of variables. In this study, individual set of image features of color and texture and their combination were tested for predicting the COL and APP rates.
Prior to model development, the set of beans were first sorted for their quality traits, the sorted samples were then divided into two groups: 75% of the samples were used for calibration and the remaining 25% samples were used for prediction. In this study, the best predictive performance (i.e., for selecting the appropriate number of latent variables) for PLSR models was determined by full cross-validation of the calibration set until the root-mean-square error of cross-validation (RMSECV) had the lowest value. After a calibration model was developed, it was then used to predict the independent set of samples that had not been used in calibration. For a given analysis, however, the calibration and prediction results may vary depending on how the calibration and prediction samples are actually selected. To better evaluate the performance, we ran calibrations and predictions four times. After calibration and prediction had been done for the first time, a second set of 25% samples was taken out from the original calibration set of samples, and it was used for prediction in the second run. The procedure was repeated until all samples had been taken out for prediction once. Mean values for number of latent variables or factors, correlation coefficient, and standard error for the calibration and validation data sets (i.e., and
,
and
, respectively) were calculated to test the performance of the image features. Finally, t-test was performed on the average SEPs for the four runs of individual sets and their combinations to determine their statistical differences.
Classification was also carried out for sorting the COL and APP data of canned beans into two quality groups: “acceptable” or “unacceptable” categories using a non-linear support vector machine (SVM) classifier. The classification models were built and tested using the COL and APP traits independently and also in combination. The two categories were defined by setting a suitable threshold of 3.2 to prevent an imbalance in the number of samples for each quality group, and so improve the assessment of the robustness of the model. Thus, the canned samples with average scores lower or equal to 3.2 were considered as a single “unacceptable” quality group; representing the bean samples with the lowest preference in APP and/or COL by the panelists. The remaining samples, those with scores higher than 3.2 represented the group of beans which panelists would consider acceptable in APP and COL.
SVM classifier is based on the concept of decision planes that define decision boundaries. That is, SVM constructs a set of hyperplanes in a multidimensional space, which can be used for separate between a set of objects having different class memberships. A good separation is achieved by the hyperplane that has the largest distance to the nearest training-data point of any class (so-called functional margin), since in general the larger the margin the lower the generalization error of the classifier. In a non-linear SVM a kernel trick is used to construct the optimal hyperplane, allowing the algorithm to fit the maximum-margin hyperplane in a transformed feature space.[Citation26] In this study, a SVM based on a Gaussian radial basis function was performed using the codes from Balu Matlab Toolbox[Citation27] run in MATLAB v7.5. The best subset of image features after preprocessing (that leads to the smallest classification error) was found using the sequential forward selection (SFS) algorithm. Similar to the PLSR analysis, the performance of the classifier is tested for an independent set of samples rotating the training and test data four times; each time 75% of the data was used to train and the rest (25%) for test. This sampling procedure was repeated in random five times. The average values for latent variables for the models and their overall performance (i.e., standard error and correlation coefficient for testing) were reported for comparisons.
Results and Discussions
Color Characterization of the Machine Vision System
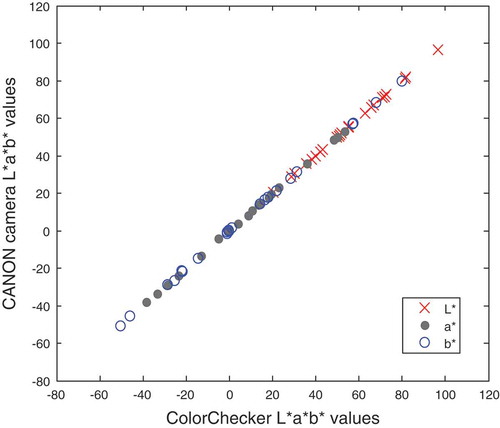
shows the relationship between CIE L*a*b*-values for ColorChecker and CDC after transformations using a polynomial 20-by-3. The average from the 24 patches for the evaluated range of polynomials,P[3×11], P[3×14], P[3×17], and P[3×20] was 2.5, 2.2, 1.4, and 0.4, respectively. Since the minimum threshold value (or just noticeable difference) detected by the human eye is generally accepted to be around 1
, the selected polynomial was P[3×20] that considers 20-by-3 coefficients. It was the polynomial model used by the machine vision system for characterizing each pixel of the acquired RGB color image of canned beans. The proposed matching function showed a perfect correlation of 1.0 between standard and sensor as observed in , allowing us for reproducible, consistent, and standard measurements of color in different color spaces.
Figure 5. Relationship between CIE L*a*b* values (CIELAB D50 2° observer) for ColorChecker and CDC camera after transformations using a polynomial 20-by-3.
Thus, color can be rapidly and accurately analyzed by computerized image analysis techniques. The technique not only offers a methodology for measurement of uneven coloration but it can also be applied to the measurement of other attributes of total appearance. In addition to the evaluation of color, the implemented machine vision allows for detection, segmentation, and analysis of morphological or geometrical features (size and shape) of beans, defect detection, and textural parameters of the image on raw or processed dry bean seeds. An integral characterization of the surface of canned beans that identifies and quantifies those traits that are desirable by consumers as well as defects, could provide a useful tool in the quality control of the canning process.
Characterization of Commercial Test Beans
Overall commercial canned beans in this study showed distinctive differences in physical traits such as seed color, appearance, and size; but also noticeable differences in uniformity within the same can of beans as well as the color characteristics and composition of the brine. Discoloration and broken seeds percent were the traits with the highest variability among the evaluated traits. presents the distribution of the data sets for APP and COL rates of canned black beans. Both APP and COL had Gaussian-shaped distributions, although some non-uniformities on the extremes of both histogram rates are observed. The panelists’ scores were in general lower for APP (ranging from 1.1 to 4.5) than for COL (ranging from 1.5 to 5) given average values of 3.1 and 3.3, respectively, but with coefficient of variations, or (CV; %), of 24.1% for APP and 22.9% for COL. The distribution peaks were found around the 3.5 score; in between the average brown black (score 3) and dark brown or medium black (score 4) for COL, and in between the average appearance (score 3; showing 60–69% of seeds intact) and very good appearance (score 4; with grains moderately intact 70–89% of seeds intact) for APP. The uneven distributions for the first three categories as well as the comments received from the panelist confirmed the difficulty for scoring canned beans belonging to these categories, i.e., between 1 or 2 and 2 or 3 quality rates. In addition, correlation analysis showed some correlation between COL and APP rates (R = 0.379, p-value = 0.0018); giving an indication that in spite of the evaluation of APP separate from COL by the sensory panel, there is a tendency with human vision to involve to some extent the COL information (i.e., discoloration and non-uniformity) of the analyzed samples. However, overall the COL and APP rates can be considered independent and complementary in the quality definition of canned black beans. This result reveals the importance of the proposed COL and APP quality charts used in this study ( and ), which helped for focusing on the important features related to each trait, and also for determining the factors perceived as different by the judges.
Figure 6. Distribution of visual appearance and color rates of canned black beans using the proposed color charts.
Additionally, a wide distribution in the quality scores among samples labeled as: reduced sodium, no salt added, low calorie, organic, and regular samples was observed. summarizes the main statistics for color and appearance rates of the different types of canned black beans tested in this study. It should be noted from the average values from these particular sets of canned black beans that higher color retention was obtained from reduced sodium samples, followed by the organic and low fat groups. But contrary to color, appearance seems to be better in no salt added samples. However, considering the non-uniform number of samples for each group and unknown specific characteristics during processing in commercial samples, a formal study testing these technological variables is needed to draw accurate conclusions.
Table 1. Statistics of the data sets for color and appearance rates of the different types of canned black beans.
Agreement Among Raters: Kappa Analysis
An important analysis in sensory evaluation is to determine the concordance among panelist. shows the overall agreement and Kappa analysis among panelists for COL and APP of canned black beans based on 5, 3, and 2 quality categories. The 3-quality categories were obtained considering the scores 1 and 2 as well as 4 and 5 as single quality groups; and the 2-quality categories considering the scores 1 and 2 as well as 3, 4, and 5 as single quality groups. In general, better concordance among raters was observed for rating COL than APP as indicated by the overall agreement and Kappa values. As expected, decreasing the number of quality categories for rating canned beans the overall agreement using the original 5-categories improved from 38.5–74.3% for COL and from 32.3–68.8% for APP when 2-categories were considered for analysis (see ). The multi-rater Kappa analysis revealed a “fair” agreement among raters for both 5-quality categories ( of 0.23 for COL and 0.21 for APP) and 3-quality categories (
of 0.28 for COL and 0.24 for APP). However, using only 2-categories the Kappa analysis significantly improved to a “moderate” agreement among raters for COL (
= 0.49) and APP (
= 0.41).
Table 2. Overall agreement and Kappa analysis among 17 panelists for visual color and appearance of canned black beans at different categories.
It should be noted that a reasonable agreement was obtained with 3-categories; however, the computed Kappa values were low and closer to those considering the original 5-categories. Kappa is affected by prevalence of the finding under consideration much like predictive values are affected by the prevalence of the quality scores under consideration,[Citation21] and hence, these parameters in such situations need to be interpreted with caution. Panelists agreed that the most difficult samples to rate were those in between the scores 1 and 2 and in between 2 and 3 for both COL and APP, which likely increased the differences in the rater’s opinion when 5-categories or 3-categories were tested for concordance among panelists. A previous study by Kelly and Schabenberger[Citation28] based on 7-visual appearance categories suggested the need to adjust the current evaluation procedure and implement an adequate panelists’ training to allow for a better discrimination in quality within the canned black bean samples.
Additionally, when the three bean samples coming from the same container (with average rates of 4.1 and 2.8 for APP and COL, respectively) were compared to evaluate the accuracy and consistency of the panelists’ ratings, it was observed that 35.3% of the 17 panelists gave the same rate to the three samples, 41.2% two times, and 23.5% different rates for APP. A similar analysis for COL revealed that only 17.6% of the panelists gave the same rate to the three samples, 70.6% two times, and 11.8% different rates. For this particular sample, sensory evaluation of COL was more difficult than APP likely due to the involved range of categories for COL (around rates 2 and 3) and APP (around rate 4) for the evaluated beans, confirming the observation by panelists that samples in the lower quality categories were more difficult to rate.
PLS Predictions of Color and Appearance Traits
In this research, the prediction performance of COL and APP traits using machine vision data on commercial canned black beans, which are routinely visually assessed by the canners after canning, were tested and compared. and summarize the PLS prediction performance for COL and APP, respectively, using the color scales (i.e., R, G, B, L*, a*, b*, H, S, V, their standard deviations) from the full and segmented image of bean seeds and brine, and textural parameters (i.e., contrast, correlation, energy, and homogeneity) from the full image, and their combinations.
Table 3. Calibration and prediction results for color of canned black beans using the average pixel intensity data and standard deviation, and their texture image information extracted from R, G, B, L*, a*, b*, H, S, and V color scales.
The technique appeared promising for predicting visual COL ratings and APP ratings. Results show that in spite of the relatively “fair” sensory agreement among the panelists’ ratings for the COL and APP traits, PLSR models using color and texture image features independently or in combination were able to predict COL ratings with values ranging from 0.873 to 0.937,
from 0.42 to 0.26, and
from 1.9 to 2.9, respectively (). Prediction of APP ratings were in general lower due to the high variation of the panelist response, with
values ranging from 0.806 to 0.871,
from 0.47 to 0.38, and
from 1.6 to 2.0, respectively () Combination of color and textural data extracted separately from the full image of beans, segmented beans, and brine improved the predictions results. Also, the inclusion of texture features from images improves the resolution of the prediction performance for COL rates prediction.
Table 4. Calibration and prediction results for appearance of canned black beans using textural image information (i.e., contrast, correlation, energy, and homogeneity) and their combination with color information extracted from R, G, B, L*, a*, b*, H, S, and V color scales.
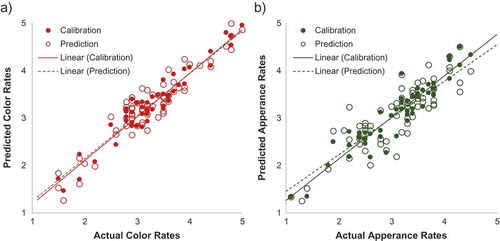
For better visualization of the performance of the PLSR models for COL and APP, shows the best prediction results using the machine vision technique, i.e., the combination of color (segmented seed + brine) and texture(full seed) for both traits. The fitted regression lines for the calibration and prediction data sets overlap well in all the range. From these plots we can visually confirm that better correlations are obtained for COL predictions ( = 0.937,
= 0.26,
= 2.9) using seven optimal principal components than those for APP (
= 0.871,
= 0.38,
= 2.0) using eight optimal components when all color and textural image information were combined together and used in the model building. In spite of the low agreement among panelist for COL and APP rates using 5-categories, overall results revealed promising opportunities for evaluating these external quality traits using a machine vision technique.
Figure 7. Predictions for visual color and appearance rates A and B, respectively, using color (segmented seed + brine) and image textural features (contrast, correlation, energy, homogeneity) extracted from RGB, L*a*b*, HSV, and gray intensity channels.
Recently, the feasibility of visible-near infrared (Vis/NIR) spectroscopy technique for predicting visual appearance and color ratings among other canning quality attributes from “intact dry beans” based on PLSR models[Citation6] were evaluated. In this study, Vis/NIR spectra of intact dry bean seeds harvested and processed in three consecutive seasons (2010, 2011, and 2012) was collected. In parallel, measurements with conventional colorimeter were also performed on “drained canned beans” and used in further comparisons. The results showed low accuracy and inconsistent results for APP rates ( < 0.566,
= 0.52) among the harvest seasons and combination using either Vis/NIR or colorimeter. Moderate predictions, however, were found for COL using Vis/NIR (ranging from
= 0.533–0.758,
= 0.69–0.52, respectively). The best predictions were found for COL using the data from the colorimeter and with a small number of latent variables (ranging from 3 to 7) since these measurements were carried out on the canned bean samples. These were consistent among seasons with
values ranging from 0.796 to 0.907 and
from 0.44 to 0.31, respectively. Hence, comparisons with the current results demonstrated better performance using the implemented machine vision technique which can be explained for the larger field of view or resolution evaluated on a bean sample image compared with the small area measured by a colorimeter.
While machine vision technique is promising for assessing bean canning quality as predicted by expert human inspection, improvements in the definition of standard charts for rating COL and APP, and so the agreement among panelists, are needed in order to develop more accurate prediction models for practical applications at the industry.
Classification of Canned Black Beans into Two Quality Groups
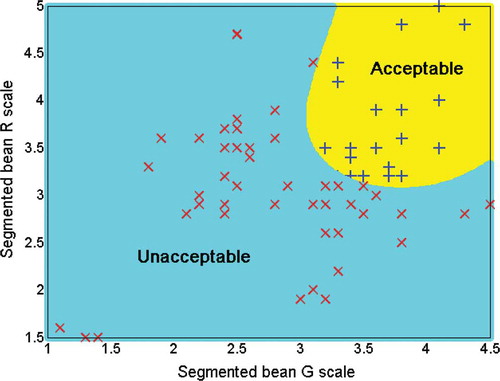
To test the capability of the extracted image information for modeling the bean COL and APP rating scores of a group of experienced panelists, the sensory rates for both traits were split in “acceptable” and “unacceptable” categories and classified applying the SVM method. Thresholds are essential for classifying beans into distinct market quality classes, since they impact, to some degree, the expected canning quality of a market class. In this study, the cut off quality threshold for both COL and APP were set to a rates higher than 3.2 for “acceptable” and equal or lower than 3.2 for “unacceptable” canned beans. presents the classification results of commercial canned black beans sorted into “acceptable” and “unacceptable” by COL and APP and their combination using the best selected color and texture image features. The SVM models successfully predicted two categories of quality rates for COL and APP and their combination of canned black beans, even when the panelists’ agreement was only moderate. Using only three image features for COL (two from the segmented seed color and one from the image texture) as well as for APP (one from the segmented seed color, one from the image texture, and one from the brine color), average classification performance for COL and APP were of 97.2 and 93.9%, respectively. Sorting the beans by COL and APP simultaneously, four image features (three from the segmented seed color and one from the brine color) were needed reaching a classification performance of 89.7%. depicts the performance of classification using only the two best selected image features by the SFS method in sorting by COL and APP commercial canned black beans into “acceptable” and “unacceptable” qualities. Therefore, it can be concluded that simple color and texture image features extracted from images of beans showed potential for the automatic prediction and sorting of canned black beans by color and appearance as a professional visual inspection.
Table 5. Classification results of commercial canned black beans into “acceptable” and “unacceptable” qualities based on color, appearance, and their combination using color and textural image features.
Figure 8. Example of using the two best selected image features by the sequential forward selection method in sorting by color and appearance commercial canned black beans into “acceptable” and “unacceptable” qualities. The decision line was carried out using a support vector machine classifier.
Conclusions
The feasibility of a machine vision technique for predicting the quality of commercial canned beans was explored. Canned black beans (Phaseolus vulgaris L.) were evaluated for various color and textural features extracted from drained/washed beans and brine images to predict and sort the quality rates of color and appearance. A multi-rater Kappa analysis revealed a “fair” agreement among raters ( of 0.23 for COL and 0.21 for APP); however, the information flow deriving from digital color image processing showed potential to predict based on PLSR models the quality rates for APP and COL of a group of bean panelists with accuracies of 93.7 and 87.1%, respectively. Also, using a SVM model with the color information of
,
,
for segmented beans and
for brine, it was possible to sort 69 canned black bean samples into two sensory quality categories of “acceptable” and “unacceptable” with an accuracy of 89.7%. Simple multivariate statistical techniques and color image features were as predictive in sorting the quality of COL and APP of canned black beans as professional visual perception. Machine vision techniques shows promise for online quality prediction and sorting of canned black beans. Finally, overall results showed that statistical modeling of sensorial preferences for APP and COL using color image data could be used to predict and sort the quality rates of experienced raters of canned black beans in practical industrial application. However, it is necessary to reiterate the importance of the development of suitable quality charts for COL and APP of canned beans, as those proposed here, with the aim of improving the design and development of robust mathematical models for automatic prediction and sorting of bean qualities.
Acknowledgments
This research was carried out as a part of the USDA Agricultural Research Service’s in-house project 3635-21430-009-00D, Improved Quality in Dry Bean Using Genetic and Molecular Approaches. The authors would also like to thank Mr. Scott Shaw for his technical support in the testing of bean samples.
References
- Siddiq, M., & Uebersax, M.A. Dry Beans And Pulses Production And Consumption—An Overview. In Dry Beans and Pulses Production, Processing and Nutrition; Siddiq, M.; Uebersax, M.A.; Eds.; Blackwell Publishing: Oxford, UK, 2012; 3–22.
- USDA-ERS. (U.S. Department of Agriculture, Economic Research Service). Vegetables and Pulses Outlook No. (VGS-354): Special Article, Commodity Highlight: Dry Beans, 2014. http://www.ers.usda.gov/media/1680744/vgs-354-sa1.pdf ( accessed July 30, 2015).
- Mitchell, D.C.; Lawrence, F.R.; Hartman, T.J.; Curran, J.M. Consumption of Dry Beans, Peas, and Lentils Could Improve Diet Quality in the U.S. Population. Journal of the American Dietetic Association 2009, 109, 909–913.
- White, B.L.; Howard, L.R. Canned Whole Dry Beans and Bean Products. In Dry Beans and Pulses Production, Processing, and Nutrition; Siddiq, M.; Uebersax, M.A.; Eds.; Blackwell Publishing: Oxford, UK, 2012; 23–54.
- Bushey, S.M.; Hosfield, G.L. A Test to Predict Color Loss in Black Bean During Thermal Processing. Annual Report of the Bean Improvement Cooperative 2007, 50, 41–42.
- Mendoza, F.A.; Cichy, K.; Lu, R.; Kelly, J.D. Evaluation of Canning Quality Traits in Black Beans (Phaseolus Vulgaris L.) by Visible/Near-Infrared Spectroscopy. Food and Bioprocess Technology 2014, 7, 2666–2678.
- Hosfield, G.L. Genetic Control of Production and Food Quality Factors in Dry Bean. Food Technology 1991, 45, 98–103.
- Cichy, K.A.; Fernandez, A.; Kilian, A.; Kelly, J.D.; Galeano, C.H.; Shaw, R.S.; Brick, M.; Hodkinson, D.; Troxtell, E. QTL Analysis of Canning Quality and Color Retention in Black Beans (Phaseolus Vulgaris L.). Molecular Breeding 2014, 33, 139–154.
- Zareifard, M.R.; Savard, T.; Marcotte, M.; Lecompte, J.-Y.; Grabowski, S. Combined Effects of Mild Acidification and Thermal Treatment on Color and Texture of Green Beans. International Journal of Food Properties 2015, 18, 1847–1867.
- Mendoza, F. Characterization of surface appearance and color of some fruits and vegetables using image analysis. Ph.D. Thesis, 2005, Department of Chemical Engineering and Bioprocess. Pontificia Universidad Católica de Chile. http://www.lth.se/fileadmin/livsmedelsteknik/pershemsidor/collab/THESIS2005_FMendoza_UC-Chile.pdf ( accessed July 30, 2015).
- Mendoza, F.; Dejmek, P.; Aguilera, J.M. Calibrated Color Measurements of Agricultural Foods Using Image Analysis. Postharvest Biology and Technology 2006, 41, 285–295.
- Valous, N.A.; Mendoza, F.; Sun, D.-W.; Allen, P. Colour Calibration of a Laboratory Computer Vision System for Quality Evaluation of Pre-Sliced Hams. Meat Science 2009, 81, 132–141.
- Ross, E.P. Impact of Computers on Sensory Evaluation: Past, Present, and Future. Food Quality and Preference 1989, 1, 165–170.
- Risvik, E.; Rogers, R. Sensory Analysis: A View on the Use of Computers. Food Quality and Preference 1989, 1, 81–85.
- Johansen, S.M.B.; Laugesen, J.L.; Janhøj, T.; Ipsen, R.H.; Frøst, M.B. Prediction of Sensory Properties of Low-Fat Yoghurt and Cream Cheese from Surface Images. Food Quality and Preference 2008, 19, 232–246.
- Wada, Y.; Arce-Lopera, C.; Masuda, T.; Kimura, A.; Dan, I.; Goto, S.; Tsuzuki, D.; Okajima, K. Influence of Luminance Distribution on the Appetizingly Fresh Appearance of Cabbage. Appetite 2013, 54, 363–368.
- Arce-Lopera, C.; Masuda, T.; Kimura, A.; Wada, Y.; Okajima, K. Luminance Distribution as a Determinant for Visual Freshness Perception: Evidence from Image Analysis of a Cabbage Leaf. Food Quality and Preference 2013, 27, 202–207.
- Haralick, R.M.; Shanmugam, K.; Dinstein, I. Textural Features for Image Classification. IEEE Transactions on Systems, Man, and Cybernetics 1973, 3, 610–621.
- Hosfield, G.L.; Uebersax, M.A. Variability in Physico-Chemical Properties and Nutritional Components of Tropical and Domestic Dry Bean Germplasm. Journal of the American Society for Horticultural Science 1980, 105, 246–252.
- Randolph, J.J. Free-Marginal Multirater Kappa: An Alternative to Fleiss’ Fixed-Marginal Multirater Kappa. In Proceedings of the Learning and Instruction Symposium 2005, Joensuu University, October 14–15, 2005, Joensuu, Finland.
- Feinstein, A.R.; Cicchetti, D.V. High Agreement But Low Kappa: I. The Problems of Two Paradoxes. Journal of Clinical Epidemiology 1990, 43, 543–549.
- Westland, S.; Ripamonti, C.; Cheung, V. Computational Colour Science Using MATLAB® (2nd Ed.). John Wiley and Sons, Ltd.: Chichester, UK, 2012; Chapter 10.
- Hong, G.; Luo, R.M.; Rhodes, P.A. A Study of Digital Camera Colorimetric Characterization Based on Polynomial Modeling. Color Research and Application 2001, 26, 76–84.
- ITU. Rec. ITU-R BT. 709-5. Parameter Values for the HDTV Standards for Production and International Programme Exchange. International Telecommunication Union (ITU). pp. 30, 2002. http://www.itu.int/publications/bookshop/index.html ( accessed July 30, 2015).
- CIE. Colorimetry—Official Recommendations of the International Commission on Illumination, CIE Publication No. 15.2; CIE Central Bureau: Vienna, Austria, 1986.
- Boser, B.E.; Guyon, I.M.; Vapnik, V.N. A Training Algorithm for Optimal Margin Classifiers. In COLT ‘92 Proceedings of the 5th Annual Workshop on Computational Learning Theory. Pittsburgh, PA, July 27–29, 1992; 144–152.
- Mery, D. BALU: A Toolbox for Computer Vision, Pattern Recognition, and Image Processing, 2011. http://dmery.ing.puc.cl/index.php/balu ( accessed July 30, 2015).
- Kelly, J.D.; Schabenberger, O. Analysis of the Effect of Judges’ Experience on Canning Quality of Four Major Commercial Dry Beans Classes. Michigan Dry Bean Digest 1998, 23, 18–19.