
ABSTRACT
Four samples of instant yeast powder were evaluated by epifluorescence light microscopy, microbial tests, gasography, the Henry-Simon pressure meter, and baking. All of the results showed that yeast (A) showed the highest number of green cells (178 ± 7), the highest number of viable yeast (15 × 1010 cfu/mg), the highest amount of CO2 production (163 ± 2 mL/3 h and 875 ± 3 mbar/3 h), and the highest volume (132 ± 1 cm3) and height of the bread (5.0 ± 0.3 cm) due to its higher bioactivity when compared to types B, C, and D (p < 0.05). The correlation study within the methods demonstrated that the Henry-Simon pressure meter was a faster, easier, inexpensive, and more accurate method than others. Therefore, it could be considered as an appropriate method to evaluate the fermentation activity of baker’s yeast.
Introduction
Saccharomyces cerevisiae has been a key ingredient in bread making. It is responsible for the leavening of the dough, as well as for the formation of desired sensorial characteristics.[Citation1] Leavening activity by carbon dioxide (CO2) is an important quality index in the baker’s yeast industry.[Citation2] The most widely recognized role of yeasts is ascribable to their fermenting ability in bread. Since CO2 is produced during fermentation by yeasts, measuring the volume of gas produced can be a useful measurement for the evaluation of active yeast.[Citation3] Baker’s yeast is required to have high-leavening capability to ensure high-quality baking products.[Citation4,Citation5] The success of the technological process in bread making is conditioned by the formation of gas in the final hours of the technological process.[Citation6] In several methods frequently used to evaluate the fermentation activity of baker’s yeast, one of them measures the time required for dough to attain a given volume and the other measures the volume of the dough for a given proof time.[Citation4,Citation5] The latter attribute is most conveniently determined by measuring the volume increase of fermenting dough, whereas gas production can be estimated by any of several available procedures, such as the oven rise recorder method, alveography method, and pressure meter methods. The viability of yeast is important in industrial microbiology. Traditional methods of assessing viability based on counting of colony forming units (CFUs) typically take between 24 and 48 h, and are too slow for practical uses in bakeries.[Citation7] The sensitivity of this method tends to be low; in addition, the time necessary for culturing the microorganisms makes it impossible to use the results for process control. Alternatively, direct observation of stained cells by microscopy can be used to rapidly assess yeast viability. The most widely used stain to measure yeast viability is the methylene blue. Viability measurement using flow cytometry and fluorescent vital staining provides a rapid and objective approach to directly measuring yeast cell viability.[Citation8]
Because of the extreme importance of yeast bioactivity, it has attracted the attention of scientists and their efforts come in two main parts: The first part reviews the amount of CO2 produced by the yeast and the other is to examine the viability of them. The measurement of gas production amount was done by assessing the volume and pressure of gas production.[Citation9] Also, microscopic techniques and microbiologically tests have been used for counting and observation of yeasts viability using various methods and special media cultures. Presently, there are few articles that have been published on yeast viability. It was shown as a positive correlate between dough volume increasing and capabilities of yeast viability, which can be demonstrated by methylene blue staining and electrophoresis.[Citation10] Several staining methods, in both fluorescent and non-fluorescent, are available for determining the viability of yeast cells, but there is no absolute method. A staining protocol is reported for the assessment of viability in yeast by using the fluorescent method.[Citation11] Flow cytometric methods for assessing cell viability conducted frequently by using one or more fluorescent probes for parameters such as membrane integrity, enzymatic activity, nucleic acid content, and membrane potential.[Citation12]
This study focused on comparison of different methods for the evaluation bioactivity of Saccharomyces cerevisiae and assesses the correlation between different methods. Another purpose of this study is to present an appropriate technique to measuring baker’s yeast fermentation activity. The aim of this investigation is to help industrial bakers and allow for researchers to select the best way to evaluate the fermentation activity of baker’s yeast.
Material and Methods
Four samples of instant dry yeast were obtained from the various companies of Iran including Fariman (Mashhad, Iran), Razavy (Mashhad, Iran), Golmaye (Tabriz, Iran), and Dezmaye (Ahvaz, Iran) that were named A, B, C, and D. Flour was obtained from the Athar Company (Maragheh, Iran).
Evaluation of Chemical Properties of Flour
American Association of Cereal Chemists (AACC) approved measuring methods were used to assess the amounts of moisture content, ash, wet gluten, and Zeleny sedimentation, respectively, following: 44–16, 09–07, 38–12, 56–11.
Gasography Test
A direct measurement of the dough volume as a result of the CO2 production during proofing was carried out using a simple measuring device. Immediately after processing, a small piece of dough (5 g) was gently rounded and placed inside a flask, which was submerged in a water bath at a constant temperature. The flask is connected via tubing to an inverted graded cylinder to collect the produced CO2. To avoid any CO2 dissolution in water, the water in the beaker was acidified to a pH of 2.5. The temperature of water bath was kept constant at 40°C to mimic the dough proofing process. The amount of gas produced was reported as cubic centimeters for 5 g of dough. The gas volume was recorded for the four samples of yeasts every minute during total testing time (180 min).
Henry-Simon Pressure Meter
The amount of CO2 pressure that yeasts produced during 180 min was measured. Yeast (0.38 g), 10 g flour, and 2 mL of distilled water were added and mixed together. The water temperature was 30°C. The mixture of flour, water, and yeast as a dough was rounded into a small ball and placed into a pressure meter. The door of the pressure meter closed quickly. The Henry-Simon pressure meter was placed in a water bath at 30°C. Then, each hour, the gauge of pressure meter was read and reported as mbar for a total of 180 min.
Epifluorescence Light Microscopy Test
In this method, yeast suspensions were prepared and standardized (1 g yeast powder dissolved in 100 cc distillated water then diluted to 10−6), then the slide samples were stained with fluorescein di-acetate (FDA) and were observed using an epifluorescence microscope with a 100-W Hg vapor arc lamp as a light source. The active yeast cells in the suspension appeared brilliant green. The yeast–water suspension was stained with FDA in a tube and was gently smeared out onto an object glass. The suspension of yeast cells was filtered through a membrane, and the yeast cells collected on the filter were stained and the number of active yeast cells was counted. Cells were counted within a 10 mm2 area. Real color images were acquired using a two-stage Peltier cooled charge-coupled device (CCD) camera (Nikon, Eclipse, Evolution MP) with a spectral range of 290–1000 nm. The dynamic range of red, green, and blue was 14 bit. Staining was performed by addition of 0.02% FDA per 1 mL of sample and held for 10 min at room temperature in the dark.
Microbial Test
Yeast survivability is determined as CFUs per gram of dry matter. A microbial test can be used to measure the viability and survivability of yeast cells. Twenty-five grams of yeast was mixed with 175 mL of water. The viability of the suspensions was checked by plate counting. Yeast cell suspensions were counted on yeast extract-glucose-chloramphenicol (YGC) agar (YGC Agar, Merck) after 5 days of incubation at 25°C. Logarithmic dilutions were carried out in saline, and the diluted suspensions were cultured on YGC agar and incubated at 25°C for 5 days.
Baking Test
With the aim of correlation between yeast viability results with bread volume and height, all of the dough samples were baked. The loaves were prepared using 530 g of flour, 280 mL of water, 1.5% yeast solution, and 5 g of sodium chloride. Fermentation was carried out at 30°C for 85 min with a relative humidity of 80%. Cooking time was 25 min at 200°C. Volume and height were recorded in all loaves. We used the rapeseed displacement method for measuring the volume in the bread. For measuring the height, after the cut, the bread height is calculated by a measuring instrument.
Results and Discussions
Wheat Flour Properties
The amounts of moisture content, ash, wet gluten, and Zeleny sedimentation is summarized in . Flour humidity is acceptable and the amount of wet gluten showed that the flour protein quality is mediocre. This flour, as a standard base, was used to formulate the dough from all of the yeast samples.
Table 1. Mean values of wheat flour properties.
Gasography and Henry-Simon Pressure Meter
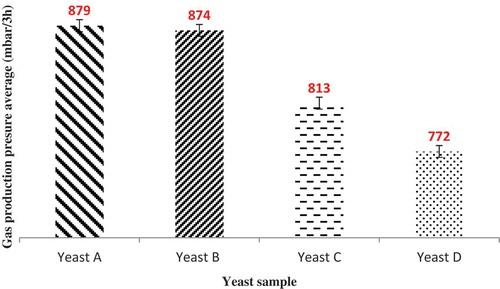
The results with four samples of yeasts (A, B, C, and D) was obtained on a gasograph and a Henry-Simon pressure meter and are presented in and . As shown in these figures, for all yeasts, the gas production rate increased over time, but it increase in yeast A more than other samples. The yeast gas production power was: A > B > C > D. Yeast sample A has the best fermentative activity due to its higher bioactivity. In both tests there was no significant difference between yeasts A and B. But yeasts C and D have significant differences in the level of 5% with yeasts A and B. Therefore, a higher bioactivity of yeast leads to higher gas production ability.
Figure 1. The effect of yeasts type on the gas production volume (mL/3 h). Different letters indicate a significant difference (p < 0.05) between the treatments.
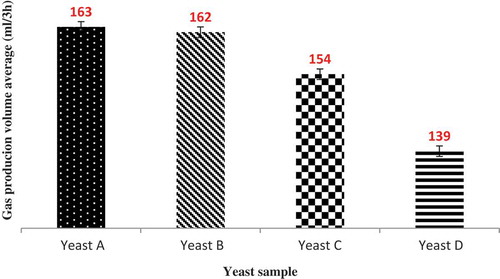
Figure 2. The effect of yeasts type on the gas production pressure (mbar/3 h). Different letters indicate a significant difference (p < 0.05) between the treatments.
Correlation Between Gasography Methods and Henry-Simon Pressure Meter
The results of gasography and the Henry-Simon pressure meter with four treatments and three replications during 180 min were obtained from Statistical Analysis System data analysis and shown a high possetive correlation together (0.98***). The correlation between these two methods is expressed by the following equation:
where P stands for pressure meter and G stands for gasograph.
The Henry-Simon pressure meter method is easier and less expensive than the gasography method. With the above equation (G = 0.17373P + 15.8235), and without needing to gasograph, it can be achived by pressure meter data and changed milibar data to milliliter.
Epifluorescence Light Microscopy Test
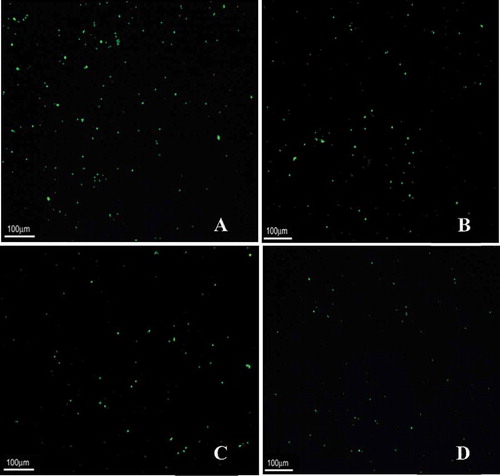
The images obtained from epifluorescence light microscopy () confirmed that gasography and the Henry-Simon pressure meter results revealed that yeast A had more living cells than the other yeasts, and yeast D had lowest number of living cells. The yeast population that fluoresced green was shown to be viable (>95%). Yeast vitality had a direct correlation with their gas production ability. Comparing the vitality of yeasts showed that the yeast vitality was: A > B > C > D. Therefore, yeast sample A was the best sample for the bread-dough making industry. The more vitality of the yeast (more cells that fluoresced green in epifluorescence light microscopy test) leads to more bioactivity and gas powering.
Figure 3. Live yeasts in yeast–water suspention shown in epifluorescence light microscopy after staining with FDA. Magnification: × 10.
Counting of Live Yeasts
Counting the numbers of live yeast was performed. The counting of live yeasts was obtained by epifluorescence light microscopy done in five replicates at the microscopic field of 650 × 850 microns. Results showed that a high number of green cells after staining with FDA lead to high gas powering ability of yeasts. The counting of live yeasts showed that live the yeast number was: A > B > C > D (A: 178 ± 7, B: 163 ± 8, C: 78 ± 9, and D: 48 ± 8). The results represent the means of duplicate measurements. Therefore, the yeast sample A was the best sample for the bread-dough making industry. The higher of a number of live yeast means more viability and bioactivity which leads to more gaspowering.
Microbial Test
Colony counting of the samples showed that the number of cfu/mg yeasts is different between them. Yeast A has a higher number of cfu/mg than others and yeast D has the lowest. The gasography and epifluorescence light microscopy (EFLM) tests confirmed the results of the microbial test. In normal conditions, if the cfu/mg in the dry matter of the yeast is higher than others, that yeast has a higher amount of live cells, and has a higher gas production power than other yeasts. These results are similar to Autio et al.[Citation3] The microbial test showed that a high number of CFUs per mg dry matter of yeasts leads to a higher performance of them. Colony counting of the samples was: A > B > C > D (A: 15 × 1010, B: 14.6 × 10¹⁰, C: 12 × 1010, and D: 10 × 1010). The results represent the means of duplicate measurements. Therefore, yeast sample A was the best sample for the bread-dough making industry. So if the CFUs per milligram in the dry matter of yeast is higher than others, that yeast has a higher amount of live cells, and had a higher gas production power than the other yeasts.
Bread Baking: Comparing Breads Height and Volumes
Baking test results also confirmed the previous tests results. Yeast A has the highest volume and height of the breads, and yeast D has lowest volume and height of the breads. This result showed a positive direct correlation between yeast survivability, the amount of cfu/mg, yeast gas production power, and the height and volume of the breads. The heights of the breads were: A ˃ B ˃ C ˃ D (A: 4.8 ± 0.3 cm, B: 4.6 ± 0.3 cm, C: 3.8 ± 0.2 cm, and D: 3.1 ± 0.2 cm) and the volume of the breads were: A ˃ B ˃ C ˃ D (A: 132 ± 10, B: 127 ± 6, C: 112 ± 5, and D: 102 ± 6). Therefore, yeast sample A was the best sample for the bread-dough making industry.
Pearson’s Simple Correlation
As shown in all of the tests have a positive correlation together, but the Henry-Simon pressure meter is faster, easier, less expensive, and more accurate than the other methods. So according to the statistical studies, the Henry-Simon’s pressure meter is presented as the best way to evaluate the fermentation activity of baker’s yeast.
Table 2. Pearson’s simple correlation between all of the tests.
Conclusions
The total comparison of the gasography, the microbial tests (cfu/mg), the EFLM test (microscopy staining), and the baking test showed the same results. In all of the tests, yeast A had the best fermentation activity because of its higher bioactivity and survivability when compared with the others. According to the very high positive correlation between different methods, it can be said that there is an appropriate method for assessing fermentation activity of baker’s yeast without needing to baking process. The Henry-Simon pressure meter is faster, easier, less expensive, and more accurate than other methods. Therefore, according to the statistical studies, the Henry-Simon pressure meter is presented as the most appropriate method to evaluate the fermentation activity of baker’s yeast.
References
- Cukier de Aquino, V.; Converti, A.; Perego, P.; Caetano da Silva, LS. Leavening Bread Dough. Current Nutrition and Food Science 2012, 8, 131–138.
- Ahi, M.; Hatamipour, M.; Goodarzi, A. Optimization of Leavening Activity of Baker’s Yeast During the Spray-Drying Process. Drying Technology 2010, 28, 490–494.
- Autio, K.; Mattila, T. Detection of Active Yeast Cells (Saccharomyces Cerevisiae) in Frozen Dough Sections. Applied and Environmental Microbiology 1992, 58, 53–57.
- Wongkhalaung, C.; Boonyaratanakornkit, M. Characterization of New Baker’s Yeast Strains and Their Leavening Ability in Bread Dough. Kasetsart Journal of Natural Science 2007, 41, 751–763.
- Giannone, V.; Longo, C.; Damigella, A.; Raspagliesi, D.; Spina, A.; Palumbo, M. Technological Properties of Bakers’ Yeasts in Durum Wheat Semolina Dough. Journal of Industrial Biotechnology 2010, 37, 371–379.
- Iancu, M.; Oprean, L. Research Study Concerning the Fermenting Potential of the Cultivation Medium Composed of a Combination of Lady Claire Variety Potato and White Flour 550 Type, Cultivated with Saccharomyces Cerevisiae Yeast, in Batch System. Acta Universitatis Cibiniensis - Series E: Food Technology 2010, 14(2), 23–31
- Boyd, A.R.; Gunasekera, T.S.; Attfield, P.V.; Simic, K.; Vincent, S.F.; Veal, D.A. A Flow-cytometric Method for Determination of Yeast Viability and Cell Number in a Brewery. FEMS Yeast Research 2003, 3, 11–16.
- Millard, P.J.; Roth, B.L.; Thi, H.P.; Yue, S.T.; Haugland, R.P. Development of the FUN-1 Family of Fluorescent Probes for Vacuole Labeling and Viability Testing of Yeasts. Applied and Environmental Microbiology 1997, 63, 2897–2905.
- Mirić, K.V.; Pejin, D.J. Effects of Mill Stream Flours Technological Quality on Fermentative Activity of Baker’s Yeast Saccharomyces Cerevisiae. Acta Periodica Technologica 2008, 39, 153–159.
- Grula, M.; Watson, M.; Pohl, H. Relationship Between Dough-Raising Activity of Baker’s Yeast and the Fraction of “Vital” Cells As Determined by Methylene Blue Staining Or by Dielectrophoresis. Journal of Biological Physics 1985, 13, 29–32.
- Hernlem, B.; Hua, S. Dual Fluorochrome Flow Cytometric Assessment of Yeast Viability. Current Microbiology 2010, 61, 57–63.
- Deere, D.; Porter, J.; Edwards, C.; Pickup, R. Evaluation of the Suitability of Bis-(1, 3-Dibutylbarbituric Acid) Trimethine Oxonol (diBA-C4 (3)−), for the Flow Cytometric Assessment of Bacterial Viability. FEMS Microbiology Letters 1995, 130, 165–169.