
ABSTRACT
The objective of this study was to develop a prototype multispectral imaging system for online quality assessment on pomegranate fruit. At first, a visible/near infrared spectroscopy (400–1100 nm) was tested for non-destructive determination of total soluble solids, titratable acidity, and pH. The spectral data were analyzed using the partial least square analysis. Then to establish consistent multispectral imaging system, the highest absolute values of β-coeffcients correspond to wavelengths from the best partial least square calibration model were selected and used for identifying the optimal wavelengths. Consequently, a multispectral imaging system was developed based on the effective wavelengths 700, 800, 900, and 1000 nm. The performance of the developed multispectral imaging system was evaluated by multiple linear regression models. The multiple linear regression model predict total soluble solids with r = 0.97, root mean square error of calibration = 0.21°Brix, and ratio performance deviation = 6.7 °Brix. Also, the results showed that the models had good predictive ability for pH and titratable acidity. Results showed that the developed multispectral imaging system based on the optimal wavelengths could be used for online quality assessment of pomegranate fruit.
Introduction
In the past decades, the consumer demands for fresh fruits with high quality have increased and are still increasing. The word of fruit quality is defined as a combination of attributes, properties, or characteristics that determine the suitability of the fruit to be eaten as fresh or stored for reasonable period without deterioration.[Citation1] Generally, the quality of fresh crops involves appearance (size, shape, color, gloss, and freedom from defects and decay), texture (firmness, crispness, and toughness), flavor (sweetness, sourness, aroma, and off-flavors), and nutritive value (vitamins, minerals, nutrients, and carbohydrates).[Citation2] The pomegranate (Punicagranatum L.) fruit, native of Iran, is one of the most important fruits of the world which is consumed both as fresh fruit as well as in processed form such as juice, jams, etc. In most of the pomegranate producing countries, the bulk of pomegranate is consumed as fresh fruit. So, together with the recent concern for food quality and safety, automatic technologies for judging the fresh quality of pomegranate are being sought.
Quality attributes such as pH, especially total soluble solids (TSS), titratable acidity (TA) are among the major quality attributes of pomegranates.[Citation3–Citation6] Good-quality pomegranates develop a juicy texture with high nutritional value, delicious taste, and excellent flavor following softening related to changes in cell wall structure.[Citation4,Citation7] Charting pH, TSS, and TA as a function of postharvest storage time could provide valuable information for commercial decision-making, since fruit sold to the consumer must meet given quality standards based on these parameters.[Citation4] Most instrumental techniques to measure these attributes are destructive in nature and time consuming and inapplicable to grading and sorting.[Citation3,Citation4,Citation8–Citation10] So, any technology such as spectroscopic and hyperspectral imaging systems that can classify the pomegranates non-destructively based on these quality attributes will be very useful for producers, processors, and distributors to ascertain fast evaluation.
Spectroscopic and hyperspectral imaging systems have many advantages compared to classical chemical, physical, and analytical methods. These systems are a non-destructive and non-contact technique with limited sample and chemical-free preparation that can be applied to estimate more than one attribute at the same time.[Citation2] All these factors reduce energy requirements and costs of process, and provide more consistent fruit to consumers. Spectroscopy has been involved in the food research for dozens of years.[Citation11–Citation19] However, spectroscopy method has a great drawback compared with the hyperspectral imaging because it generally measures an aggregate amount of light reflected or transmitted from a specific area of a sample (point measurement), it does not contain spatial information about the product. The hyperspectral imaging system can spatially receive the spectral responses at a pixel of fruit image.
In recent years, the extensive research and advances in hyperspectral imaging proved the feasibility it to analysis of fruits non-destructively and with reasonable accuracy. Some reviews and books on application of hyperspectral imaging in food quality assessment have already been published in the last years.[Citation20–Citation27] However, literature review showed that it is not feasible for a hyperspectral imaging system to be applied for online quality evaluation of fruits due to the long acquisition time and high cost.[Citation22,Citation24,Citation25,Citation28,Citation29] Thus, development of a multispectral imaging system which would be faster and cost-effective based on the selected effective wavelengths is essential for online quality evaluation of fruits. El Masry et al.[Citation2] developed a multispectral image acquisition system for nondestructive determination of some quality attributes for strawberry. Feasibility in multispectral imaging for predicting the content of bioactive compounds in intact tomato fruit was studied by Liu et al.[Citation30] Huang et al.[Citation31] showed that it could be effective for detection of bruises on apples using a multispectral imaging system.
Hence, this study was undertaken to develop a multispectral imaging system based on the selected effective wavelengths to estimate some quality attributes of pomegranate. This outmost aim was achieved by meeting the following specific objectives: (1) Developing partial least square (PLS) models to quantitatively predict TSS, TA, and pH in pomegranate using a 400–1100 nm near infrared (NIR) spectroscopy system; (2) Selecting the optimal wavelengths which give the highest correlation between the spectral data and the three studied quality attributes; (3) to develop a multispectral imaging system based on the selected effective wavelengths; (4) test and validate the prediction accuracy of the developed calibration models.
Materials and Methods
Pomegranate Samples
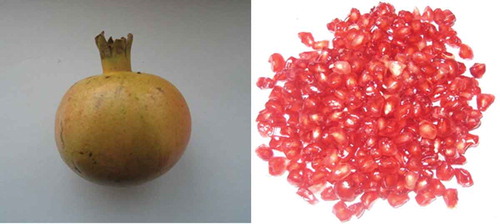
In this study, the pomegranate fruits (Ashraf variety) were obtained from a commercial orchard in Shahidabad Village, Behshahr County, Mazandaran Province, Iran in October 2014 (). Good appearance of test fruits is essential for the experiments. So, pomegranates were visually inspected for appearance and surface defects and finally a total of 100 fruits free from any abnormal features such as bruises, diseases, and contaminations were selected for the experiments. Then, all samples were individually washed, numbered and stored at 20°C and 70% relative humidity. Two subgroups were considered for testing and training, so the samples divided into two groups randomly. The first subgroup of 70 samples was used as a training set for developing PLS model, whereas the remaining subgroup of 30 samples was used for model validation and to estimate the performance of models. The physical properties of samples were measured and computed on the basis of Fawole and Opara.[Citation4] shows the summary statistics for some physical properties of samples in each subgroup.
Table 1. Statistics of both calibration and prediction data sets for some physical properties of pomegranate fruit samples.
Figure 1. Fruit and arils of pomegranate (cv. “Ashraf”) cultivar.
Visible (Vis)/NIR Reflectance Spectroscopy Collection
The experimental system for testing pomegranate fruit included a spectrometer (AvaSpec-2048TEC (200–1100 nm), Avantes Company, Russia) equipped an external fiber-optic cable, AvaSoft7 software for Windows, a cooled, one nanometer resolution and sensitivity of 1,100,000 counts/μw per ms entrance irradiation. The light source consisted of a tungsten halogen lamp (100 W, 12 V) which is usable in the Vis and infrared region. A white Teflon material was used as the reference material before every measurement. The angle between the incident light source and the detector fiber was set to 45°. The collected optical energy transferred by the fiber cable to the spectrometer for projecting onto a holographic diffraction grating. For independent measurements, the detectors were considered to separate and reflect the wavelength components.
The measurement system was arranged in reflectance mode for collecting Vis/NIR diffuse reflectance spectra from the pomegranate fruit. The reflectance spectra from 400–1100 nm were measured at 1 nm interval with an average reading of 10 scans for each spectrum. Four separate spectral measurements were made at four marked locations on each sample at four equidistance positions along the equator in order to decrease the error of operator and instrument. The average spectrum of these four measurements was used for calibration model. That is to say, a total of 30 scans were automatically averaged for each fruit. Finally, all of the spectral data were stored in a computer for further analysis.
Measurement of TSS, TA, and pH
After acquiring the spectra, each fruit sample was tested for its TSS, TA, and pH. In order to determine these attributes, the juice was squeezed using a manual fruit squeezer (Model: HL-56, China). The juice was filtered and centrifuged afterward. The TSS and pH of juice were measured thrice using a hand-held refractometer (TYM Model, China) and digital pH meter (3020 Model, GenWay Company, UK), respectively, and the average values were noted. The juice’s TSS was expressed in values of °Brix. TA was determined as an average among replicates after titration using a Metrohm 862 compact titro sampler (Herisau, Switzerland), and the results were presented as the percentage of citric acid. Many researchers have been used these methods.[Citation4,Citation15,Citation19,Citation32–Citation34]
Chemometrics
Spectral data preprocessing
Vis/NIR instruments generate a large amount of spectral data producing valuable analytical information.[Citation19] However, the data acquired from spectrometer contains background information and noise besides sample information. In order to obtain reliable, accurate, and stable calibration models, the raw data acquired from spectrometer need to be preprocessed first to reduce the effect of irrelevant information such as background, noise, uncertainties, variability, interactions, and unrecognized features.[Citation35] Recently, several preprocessing methods than can be divided into two categories: columns pretreatments and rows pretreatments have been developed for these purposes.[Citation14,Citation36,Citation37] In this study, the pretreatments were implemented by ParLeS software version 3.1.[Citation38] First, in this study, four spectra of every sample were averaged into one spectrum and then converted to absorbance value using Abs = log (1 /R) equation where R is the amount of reflectance, to obtain linear correlation between spectra and sample molecular concentration. Finally, different preprocessing methods including centering, smoothing by (Savitzky–Golay algorithm, median filtering), normalization (multiplicative scatter correction [MSC] and standard normal variate [SNV]) and differentiation (first derivative and second derivative) were performed. Centering, which is also referred as mean centering, ensures that all results will be outstanding in terms of variation around the mean.[Citation14] Smoothing is designed to optimize the signal to noise ratio.[Citation14] To linearize each spectrum to some ideal spectrum of the sample, MSC was attempted to remove the effects of scattering, which corresponds to the average spectrum practically.[Citation14] Also, first and second derivative preprocessing methods were used to remove background spectra and enhance spectral resolution.[Citation35]
Calibration and validation
PLS regression method was implemented for developing a model between spectral responses from samples and their quality attributes. PLS analysis between one attribute (TSS, TA, and pH) and the spectral data (average spectra with 700 wavelengths in the range from 400–1100 nm) was conducted using ParLeS software version 3.1.[Citation38] When applied to spectral of the calibration set (70 samples), the aim of PLS analysis is to find a mathematical relationship between a set of independent variables, X matrix (N70fruits × K700wavelengths), and the dependent variable, Y matrix (N70fruits × 1). The values of each attribute (TSS, TA, and pH) from the calibration set were used to represent the dependent variables (Y). Meanwhile, the reflectance values at 700 wavelengths of the 70 pear fruits represented the independent variables or the predictors (X). The remaining 30 fruits were randomly allocated for validation. No outliers were detected using both spectral and concentration residuals. The optimal number of latent factors for establishing the calibration model was determined using the minimum value of predicted residual error sum of squares (PRESS). The performance of model calibration and validation was assessed in terms of by correlation coefficient (r), root mean square error of calibration (RMSEC), root mean square error of prediction (RMSEP) and ratio performance deviation (RPD) as follows:[Citation39]
where ŷi is the predicted value of the ith observation, yi is the measured value of the ith observation, ym is the mean value of the calibration or prediction set, n, nc, and np are the number of observations in the data set, calibration and prediction set, respectively. Generally, a good model should have higher correlation coefficients; lower both RMSEC and RMSEP values, but also a small difference between RMSEC and RMSEP or a RPD value should be more than 5.[Citation40]
Optimal wavelengths selection using highest absolute values of β-coeffcients from the best PLS calibration model
Many researchers have studied a variety of methods such as correlation analysis;[Citation41,Citation42] principal component analysis (PCA);[Citation31,Citation43] typical wavelength selection methods such as partial least squares regression (PLSR);[Citation44] genetic algorithm;[Citation45] sequential forward selection;[Citation46] and relatively new methods like minimum redundancy–maximum relevance (MRMR)[Citation47] and receiver operating characteristic curve[Citation48] to find a few vital wavelengths that would be most influential on the quality evaluation of the fruit. In this research, the highest absolute values of β-coeffcients correspond to wavelengths from the best PLS calibration model were selected and used for identifying the optimal wavelengths. The wavelengths depend on the behavior of spectral responses of the fruits under study and the differences among them were selected for multispectral imaging system. Then to establish multiple linear regression models (MLR) these selected optimal wavelengths were used. This step was completed using Matlab 2013a (The MathWorks Inc., Natick, MA) as follows:
where , predicted value of the attribute; K, number of optimal wavelengths (number of X-variables or predictors); a0, ak, regression coeffcients, and R, reflectance at a wavelength λ corresponding to the kth term in the model. Finally to test the predictive ability of the models, the correlation coefficient (r), RMSEC, RMSEP, and RPD were determined. The optimal number of factors for establishing the calibration model was determined by the PRESS. The number of factors with the minimum PRESS value was considered the optimal.
Development of An Experimental Multispectral Imaging System
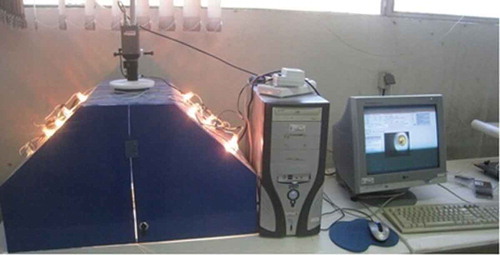
Based on the selected wavelengths, a laboratory multispectral imaging system was developed as shown in . The system is comprised of the following components:
A 75 (length) × 50 (width) × 45 (height) cm light chamber that is made of sheet metal.
A charged couple device (CCD) camera (SCB-2000, SAMSUNG).
An illumination unit that consists of 10, 50 W halogen lamps adjusted at angle of 45° to illuminate the camera’s field-of-view.
A frame grabber.
A filter wheel with four holes for holding filters in place. Three band pass filters of 800, 900, and 1000 at 25 nm band width (Thorlabs Corp., USA) were used. Another space in filter wheel was used with no filter for acquiring RGB images.
Figure 2. The constructed multispectral imaging system for acquiring images from the fruit.
Results and Discussion
Statistic Values of TSS, TA, and pH
The statistic values of TSS, TA and pH of samples or both calibration and prediction (validation) data sets are presented in . The TSS, TA and pH measurements of 100 samples were fairly normally distributed around the mean values (). As it can be seen, the calibration sets and prediction sets were quiet varied and covered a large enough range. These features are helpful to develop a good model.
Table 2. Statistics values of TSS, TA, and pH of 100 pomegranate samples.
Spectra Consideration
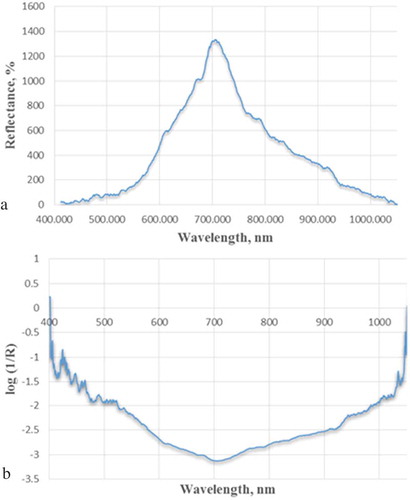
After removing the noise in the data, only wavelengths in the range from 400–1100 nm were used for further analysis. and show the average raw reflectance spectra and absorbance spectrum of Ashraf pomegranate fruit in the wavelength range of 400–1100 nm, respectively. As it was clear in these figures, the spectrum had some absorbance peaks in specific frequencies due to stretching vibration of the overtones of O-H, C-H, or N-H functional groups relative to the concentration of some inner compositions with these bands such as sugars and acids. The absorbance in the range of 400–500 nm was due to the pigments. After 500 nm (in the visible region), the curve had decreasing trend () and there was a perceptible peak around 750 nm because of the third overtone of O-H and the forth overtone of C-H. Then (in NIR region) the curve had increasing trend and a perceptible peak around 970 nm because of the second overtone of O-H. This justification was also by many researchers.[Citation2,Citation43,Citation49,Citation50] They found that the regions around 500 and 680 represent anthocyanin and chlorophyll pigments which represent the color characteristics in the fruit and the absorption regions in the NIR at 840 and 960 nm represent sugars and water absorption bands.
Figure 3. The average raw reflectance Vis/NIR spectra of A: Ashraf pomegranate fruit, and B: its absorbance spectrum.
The PLS Models Using the Whole Spectral Range of 400–1100 nm
As it was stated earlier, the PLS calibration models were developed using the average spectra from 70 fruits in the calibration/training set utilizing the whole spectral range consisting of 700 wave bands. The models were validated using the average spectra of 30 fruits in the validation set. As shown in , the number of latent factors for PLS model of TSS, TA, and pH of samples was determined at the lowest value of PRESS. At the first, PRESS had high values and then decreased rapidly as the number of latent factors increase until its lowest value. After that, the PRESS increase again with increasing of the number of latent factors and the performance of the model decreases accordingly. The number of latent factors to predict for TSS, TA, and pH were nine, six, and eight factors, respectively. The scatter plot of correlation between the measured and predicted values of studied attributes (TSS, TA, and pH) are shown in –.
Figure 4. Prediction of TSS, TA, and pH using PLS models: A: predicted residual error sum of squares (PRESS) for predicting TSS, TA, and pH as a function of number of factors; B: measured and predicted TSS values for training and validation sets using nine factors; C: measured and predicted pH values for training and validation sets using four factors; and D: measured and predicted TA values for training and validation sets using six factors.
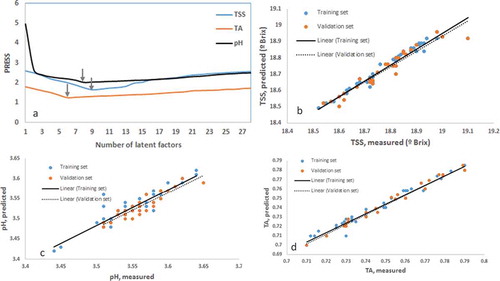
As it is clear from , the PLS models could predict TSS as well and better than the other studied quality parameters. Many researchers also have reported that NIR spectroscopy with PLS models could predict TSS better than other taste characteristics for various vegetables and fruits such as cherry, mandarin, tomato, and orange fruit.[Citation33,Citation51–Citation53] Also, more application of NIR spectroscopy to measure TSS in fruits and vegetables has reported by Nicolai et al.[Citation14] Withal as it was stated, the PLS model can predict TSS with r = 0.95, RMSEC = 0.22 °Brix, and RPD = 6.7 °Brix. These parameters for the validation models was found to be: r = 0.94, RMSEP = 0.21 °Brix, and RPD = 6.72 °Brix. The pH was predicted with r = 0.85, RMSEC = 0.068, and RPD = 4.58 for the training set and r = 0.86, RMSEP = 0.069, and RPD = 4.43 resulted from the validation sets. TA was predicted with r = 0.94, RMSEC = 0.25, and RPD = 5.35 for training set. The accuracy of the model in the validation set for predicting TA was with r = 0.93, RMSEP = 0.26, and RPD = 5.31. As is clear the validation tests had similar results with the calibration set, so the models can non-destructively predict the quality attributes under study.
Table 3. PLS models for predicting TSS, TA, and pH in pomegranate.
Evaluation of Performance of the Optimal Wavelengths
As it can be seen from , the optimum wavelengths for quality assessment of pomegranate fruit with internal quality attributes such as TSS and TA, were found to be 450, 521,630, 780, 853, and 950 nm. Also for predicting pH, common spectral regions were found in six optimal wavelengths at 435, 520, 585, 680, 850, and 993 nm which corresponding to the highest absolute value of the β coefficient. This results are comparable with the finding of ElMasry et al.[Citation2] and Rajkumar et al.[Citation43] for strawberry and banana who found that the optimal wavelengths were 421, 520, 581, 683, 847, and 950 nm and 440, 525, 633, 672, 709, 760, 925, and 984, respectively. The optimal wavelengths were considered to develop MLR model between the reflectance and measured values of each attribute. Also, the calibration set was applied to develop the MLR models for predicting the attributes and the validation set for validating these models. The results of calibration and prediction of MLR models for TSS, TA, and pH are shown in –. The performance of these models is evaluated by RMSEC, RMSEP, and correlation coefficient (r) as shown in .
Table 4. MLR models for predicting TSS, TA, and pH in pomegranate.
Figure 5. Prediction of TSS, TA, and pH using MLR models: A: correlation between measured TSS and estimated TSS for training and validation sets; B: correlation between measured pH and estimated pH for training and validation sets; C: correlation between measured TA and estimated TA for training and validation sets.
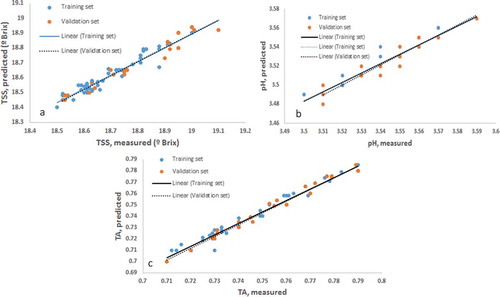
As can be seen from , the model for prediction of TSS had r = 0.97, RMSEC = 0.21°Brix, and RPD = 6.7 °Brix. The model predicted the TSS of validation samples with r = 0.97, RMSEP of 0.22 °Brix and RPD = 5.77 °Brix. The correlation coefficients (r) for the calibration model of pH was found to be 0.93 and it was 0.94 for validation set. Also, RMSEC and RMSEP were 0.035 and 0.038, for calibration and evaluation datasets, respectively. Similar to the scatter plot of TSS (), the 45º slope of the line fitted to the pH measured–predicated data points showed that predicted values were very close to measured values (). As it can be seen in , the MLR model can predict TA with r = 0.93, RMSEC = 0.26, and RPD = 5.21°Brix. These parameters for the validation models was found to be: r = 0.92, RMSEP = 0.25, and RPD = 5.22. Compared with PLS models, MLR models had higher performance in prediction in terms of RMSEC, RMSEP, and the correlation coeffcient. This is related to co-linearity and overfitting problems in MLR models that utilize only the essential wavelengths and neglect the useless wavelengths.
Conclusion
The results of this study indicated the possibility of developing a nondestructive technique using multispectral imaging for measuring pomegranate quality attributes. The PLS models were established between reflectance spectra acquired from NIR spectrometer and the quality attributes. The correlation coefficient r, RMSEC and RPD for the calibration models was found to be: r = 0.95, RMSEC = 0.22 °Brix, and RPD = 6.7 °Brix for TSS; r = 0.85, RMSEC = 0.068, and RPD = 4.58 for pH; r = 0.94, RMSEC = 0.25, and RPD = 5.35 for TA. The optimum wavelengths were extracted using the β-coeffcients from PLS models. Consequently, a multispectral imaging system was developed based on the effective wavelengths 700, 800, 900, and 1000 nm. The performance of the developed multispectral imaging system was evaluated MLR models. The MLR model predict TSS with r = 0.97, RMSEC = 0.21°Brix, and RPD = 6.7 °Brix. The pH was predicted with r = 0.93, RMSEC = 0.035, and RPD = 5.01 for the training set. TA was predicted with r = 0.93, RMSEC = 0.26, and RPD = 5.21 for training set. Results showed that the developed multispectral imaging system based on four effective wavelengths is feasible for quality assessment of pomegranate fruit. Our next step research will focus on the performance evaluation of the developed multispectral imaging by online tests.
Funding
The authors would like to thank the Ferdowsi University of Mashhad for providing the laboratory facilities and financial support through the project No. of 28580.
Additional information
Funding
References
- Kader, A.A. Fruit, Maturity, Ripening and Quality Relationships. Acta Horticulturae 1999, 485, 203–208.
- El Masry, G.; Wang, N.; ElSayed, A.; Ngadi, M. Hyperspectral Imaging for Nondestructive Determination of Some Quality Attributes for Strawberry. Journal of Food Engineering 2007, 81, 98–107.
- Al-Said, F.A.; Opara, L.U.; Al-Yahyai, R.A. Physico-Chemical and Textural Quality Attributes of Pomegranate Cultivars (Punica Granatum L.) Grown in the Sultanate of Oman. Journal of Food Engineering 2009, 90, 129–134.
- Fawole, O.A.; Opara, U.L. Changes in Physical Properties, Chemical and Elemental Composition and Antioxidant Capacity of Pomegranate (cv. “Ruby”) Fruit at five Maturity Stages. Scientia Horticulturae 2013, 150, 37–46.
- Fawole, O.A.; Opara, U.L. Developmental Changes in Maturity Indices of Pomegranate Fruit: A Descriptive Review. Scientia Horticulturae 2013, 150, 152–161.
- Radunić, M.; Jukić Špika, M.; Goreta Ban, S.; Gadže, J.; Díaz-Pérez, J.C.; D. MacLean, Physical and Chemical Properties of Pomegranate Fruit Accessions from Croatia. Food Chemistry 2015, 177, 53–60.
- Melgarejo, P.; Salazar, D.M.; Tratado de Fruticultura para Zonas Aridas 2002, 2, Ediciones Mundi-Prensa Madrid.
- Salah, A.A.; Dilshad, A. Changes in Physical and Chemical Properties During Pomegranate (Punica Granatum L.) Fruit Maturation. Food Chemistry 2002, 76, 437–441.
- Zarei, M.; Azizi, M.; Bashir-Sadr, Z. Evaluation of Physicochemical Characteristics of Pomegranate (Punica Granatum L.) Fruit During Ripening. Fruits 2011, 66, 121–129.
- Fawole, O.A.; Opara, U.L. Fruit Growth Dynamics, Respiration Rate, and Physico-Textural Properties During Pomegranate Development and Ripening. Scientia Horticulturae 2013c, 157, 90–98.
- Costa, G.; Noferini, M.; Andreotti, C. Non-Destructive Determination of Internal Quality in Intact Pears by Near Infrared Spectroscopy. Acta Horticulturae 2002, 596, 821–825.
- Liu, Y.D.; Ying, Y.B.; Fu, X.P.; Lu, H.S. Experiments on Predicting Sugar Content in Apples by FT-NIR Technique. Journal of Food Engineering 2007, 80, 986–989.
- Liu, Y.D.; Chen, X.M.; Sun, X.D.; Ying, Y.B. Non-Destructive Measurement of Pear Internal Quality Indices by Visible and Near-Infrared Spectrometric Techniques. New Zealand Journal of Agricultural Research 2007, 50, 1051–1057.
- Nicolai, B.M.; Beullens, K.; Bobelyn, E.; Peirs, A.; Saeys, W.; Theron, K.I.; Lammertyn, J. Nondestructive Measurement of Fruit and Vegetable Quality by Means of NIR Spectroscopy: A Review. Postharvest Biology and Technology 2007, 46, 99–118.
- Shao, Y.H.; He, Y.; Bao, Y.D.; Mao, J.Y. Near-Infrared Spectroscopy for Classification of Oranges and Prediction of the Sugar Content. International Journal of Food Properties 2009, 12, 644–658.
- Paz, P.; Sánchez, M.T.; Pérez-Marín, D.; Guerrero, J.E.; A. Garrido-Varo, Instantaneous Quantitative and Qualitative Assessment of Pear Quality Using Near Infrared Spectroscopy. Computer and Electronic in Agriculture 2009, 69, 24–32.
- Louw, E.D.; Theron, K.I. Robust Prediction Models for Quality Parameters in Japanese Plums (Prunussalicina L.) Using NIR Spectroscopy. Postharvest Biology and Technology 2010, 58, 176–184.
- Morales-Sillero, A.; Fernandez-Cabanas, V.M.; Casanova, L.; Jimenez, M.R.; Suarez, M.P.; Rallo, P. Feasibility of NIR Spectroscopy for Non-Destructive Characterization of Table Olive Traits. Journal of Food Engineering 2011, 107, 99–106.
- Li, J.; Huang, W.; Zhao, C.; Zhang, B. A Comparative Study for the Quantitative Determination of Soluble Solids Content, p, and Firmness of Pears by Vis/NIR Spectroscopy. Journal of Food Engineering 2013, 116, 324–332.
- Gowen, A.A.; Taghizadeh, M.C.P.; O’Donnell, C.P. Identification of Mushrooms Subjected to Freeze Damage Using Hyperspectral Imaging. Journal of Food Engineering 2009, 93, 7–12.
- Cubero, S.; Aleixos, N.; Moltó, E.; Gómez-Sanchis, J.; Blasco, J. Advances in Machine Vision Applications for Automatic Inspection and Quality Evaluation of Fruits and Vegetables. Food Bioprocess and Technology 2011, 4, 487–504.
- Lorente, D.; Aleixos, N.; Gomez-Sanchis, J.; Cubero, S.; Garcia-Navarrete, O.L.; J. Blasco, Recent Advances and Applications of Hyperspectral Imaging for Fruit and Vegetable Quality Assessment. Food Bioprocess and Technology 2012, 5, 1121–1142.
- Wu, D.; Sun, D.W. Advanced Applications of Hyperspectral Imaging Technology for Food Quality and Safety Analysis and Assessment: A Review—Part II: Applications. Innovative Food Science and Emerging Technology 2013, 19, 15–28.
- Qin, J.; Chao, K.; Kim, M.S.; Lu, R.; Burks, T.F. Hyperspectral and Multispectral Imaging for Evaluating Food Safety and Quality. Journal of Food Engineering 2013, 118, 157–171.
- Huang, H.; Liu, L.; Ngadi, M. Recent Developments in Hyperspectral Imaging for Assessment of Food Quality and Safety. Sensors 2014, 14, 7248.
- Khodabakhshian, R.; Emadi, B.; Khojastehpour, M.; Golzarian, M.R. Combination of Conventional Imaging and Spectroscopy Methods for Food Quality Evaluation. 4th International Workshop on Computer Science and Engineering, United Arab Emirates, Dubai, August 22–23, 2014.
- Pu, Y.Y.; Feng, Y.Z.; Sun, D.W. Recent Progress of Hyperspectral Imaging on Quality and Safety Inspection of Fruits and Vegetables: A Review. Comprehensive Reviews in Food Science. Food Safety 2015, 4, 176–188.
- Kim, M.S.; Lefcourt, A.M.; Chao, K.; Chen, Y.R.; Kim, I.; Chan, D.E. Multispectral Detection of Fecal Contamination on Apples Based on Hyperspectral Imagery: Part I. Application of Visible and Near-Infrared Reflectance Imaging. Transaction of the ASAE 2002, 45, 2027–2037.
- Lleo, L.; Roger, J.M.; Herrero-Langreo, A.; Diezma-Iglesias, B.; Barreiro, P. Comparison of Multispectral Indexes Extracted from Hyperspectral Images for the Assessment of Fruit Ripening. Journal of Food Engineering 2011, 104, 612–620.
- Liu, C.; Liu, W.; Chen, W.; Yang, J.; Zheng, L. Feasibility in Multispectral Imaging for Predicting the Content of Bioactive Compounds in Intact Tomato Fruit. Food Chemistry 2015, 173, 482–488.
- Huang, W.; Li, J.; Wang, Q.; Chen, L. Development of a Multispectral Imaging System for Online Detection of Bruises on Apples. Journal of Food Engineering 2015, 146, 62–71.
- McGlone, V.A.; Jordan, R.B.; Seelye, R.; Martinsen, P.J. Comparing Density and NIR Methods for Measurement of Kiwifruit Dry Matter and Soluble Solids Content. Postharvest Biology and Technology 2002, 26, 191–198.
- Gomez, H.A.; He, Y.; Pereira, A.G. Non-Destructive Measurement of Acidity, Soluble Solids, and Firmness of Satsuma Mandarin Using Vis/NIR Spectroscopy Techniques. Journal of Food Engineering 2006, 77, 313–319.
- Moghimi, A.; Aghkhani, M.H.; Sazgarnia, A.; Sarmad, M. Vis/NIR Spectroscopy and Chemometrics for the Prediction of Soluble Solids Content and Acidity (pH) of Kiwifruit. Biosystem Engineering 2010, 106, 295–302.
- Cen, H.; He, Y. Theory and Application of Near Infrared Reflectance Spectroscopy in Determination of Food Quality. Trends in Food Science & Technology 2007, 18, 72–83.
- Naes, T.; Isaksson, T.; Fearn, T.; Davies, T. A User-Friendly Guide to Multivariate Calibration and Classification. NIR Publications: Charlton, Chichester, UK, 2004.
- Vigni, M.L.; Durante, C.; Cocchi, M. Exploratory Data Analysis. In Chemometrics in Food Chemistry; Marini, F.; Ed.; Elsevier: Amsterdam, Netherlands 2013; 55–126.
- Viscarra Rossel, R.A. ParLeS: Software for Chemometric Analysis of Spectroscopic Data. Chemometrics and Intelligent Laboratory Systems 2008, 90, 72–83.
- Liu, F.; Wang, L.; He, Y. Application of Effective Wavelengths for Variety Identification of Instant Milk Teas. Journal of Zhejiang University 2010, 44, 619–623.
- Westad, F.; Bevilacqua, M.; Marini, F. Regression. In Chemometrics in Food Chemistry; Marini, F.; Ed.; Elsevier, Amsterdam, Netherlands, 2013; 127–169.
- Qin, J.; Burks, T.F.; Zhao, X.; Niphadkar, N.; Ritenour, M.A. Multispectral Detection of Citrus Canker Using Hyperspectral Band Selection. Transaction of the ASABE 2011, 54, 2331–2341.
- Gomez-Sanchis, J.; Blasco, J.; Soria-Olivas, E.; Lorente, D.; Escandell-Montero, P.; Martinez-Martinez, J.M. Hyperspectral LCTF-Based System for Classification of Decay in Mandarins Caused by Penicillium Digitatum and Penicillium Italicum Using the Most Relevant Bands and Non-Linear Classifiers. Postharvest Biology and Technology 2013, 82, 76–86.
- Rajkumar, P.; Wang, N.; Eimasry, G.; Raghavan, G.S.V.; Gariepy, Y. Studies on Banana Fruit Quality and Maturity Stages Using Hyperspectral Imaging. Journal of Food Engineering 2012, 108, 194–200.
- Chong, I.G.; Jun, C.H. Performance of Some Variable Selection Methods When Multi Collinearity Is Present, Chemometrics. Intelligent Laboratory Systems 2005, 78, 103–112.
- Kawamura, K.; Watanabe, N.; Sakanoue, S.; Lee, H.J.; Inoue, Y.; Odagawa, S. Testing Genetic Algorithm As a Tool to Select Relevant Wavebands from Field Hyperspectral Data for Estimating Pasture Mass and Quality in a Mixed Sown Pasture Using Partial Least Squares Regression. Grassland Science 2010, 56, 205–216.
- Serpico, S.B.; Bruzzone, L. A New Search Algorithm for Feature Selection in Hyperspectral Remote Sensing Images. IEEE Transaction Geoscience Remote Sensing 2001, 39, 1360–1136.
- Peng, H.; Long, F.; Ding, C. Feature Selection Based on Mutualinformation: Criteria of Max-Dependency, Max-Relevance, and Min Redundancy. IEEE Transaction on Pattern Analysis and Machine Intelligence 2005, 27, 1226–1238.
- Lorente, D.; Aleixos, N.; Gomez-Sanchis, J.; Cubero, S.; Blasco, J. Selection of Optimal Wavelength Features for Decay Detection in Citrus Fruit Using the ROC Curve and Neural Networks. Journal of Food Engineering 2013, 6, 530–541.
- Abbott, J.A.; Lu, R.; Upchurch, B.L.; Stroshine, R.L. Technologies for Non-Destructive Quality Evaluation of Fruits and Vegetables. In Horticultural Reviews-Technologies for Nondestructive Quality Evaluation of Fruits and Vegetables; John Wiley & Sons, Inc.: New York, 1997; 1–120.
- Seeram, N.P.; Lee, R.; Scheuller, H.S.; Heber, D. Identification of Phenolic Compounds in Strawberries by Liquid Chromatography Electrospray Ionization Mass Spectroscopy. Food Chemistry 2006, 97, 1–11.
- Lu, R. Predicting Firmness and Sugar Content of Sweet Cherries Using Near-Infrared Diffuse Reflectance Spectroscopy. Transaction of the ASAE 2001, 44, 1265–1271.
- Shao, Y.; He, Y.; Gomez, A.H.; Pereir, A.G.; Qiu, Z.; Zhag, Y. Visible/Near Infrared Spectrometric Technique for Nondestructive Assessment of Tomato “Heatwave” (Lycopersicumesculentum) Quality Characteristics. Journal of Food Engineering 2007, 81, 672–678.
- Jamshidi, B.; Minaei, S.; Mohajerani, E.; Ghassemian, H. Reflectance Vis/NIR Spectroscopy for Nondestructive Taste Characterization of Valencia Oranges. Computer and Electronic in Agriculture 2012, 85, 64–69.