
ABSTRACT
The effects of changes in pH above and below the natural pH of milk (ca 6.6) on the casein micelle size and the gelation properties of the pH adjusted and restored samples were investigated. The size of casein micelles increased at pH 7.0 and 7.5, then started to decrease above pH 8.5. It is postulated that at pH below 8.5 the casein micelles swell, while elevated pH causes their dissociation. Conversely, the size of casein micelles decreased on acidification to pH 5.5 and increased when the pH dropped below 5.5, due to the shrinkage of casein micelles at lower pH before their aggregation at pH below 5.5. In response to neutralising treated milk back to normal milk pH of 6.6, it was found that the casein micelle size of treated milk with a narrow range of pH change between 6.0 and 7.0 was reversible, while beyond this range the structure of casein micelles became irreversible. The restoration of casein micelle size was followed by the restoration of some parameters such as soluble calcium, ethanol stability, and milk whiteness. Acid-induced gelation did not change the elastic modulus, while rennet-induced gelation was affected by initial milk pH. In reference to the size of reversible range elastic modulus (G’) of acid or rennet gels made from restored milk, the sizes were similar to control milk after 6 h of gelation.
Introduction
Caseins in normal bovine milk form a self-assembled structure together with micellar calcium phosphate. The α- and β-caseins are present in the interior and throughout the structure, whereas the κ-caseins are mostly found on the surface of the micelles. To some extent, the casein micelles (CMs) are considered as hard spheres protected by κ-casein hairy layers. The CMs are extremely stable in normal conditions of milk. Moderate heating or cooling does not cause the aggregation or the disruption of their internal structure.[Citation1,Citation2] However, a change in milk environmental conditions, such as the alteration of the pH of the milk, would easily destabilize the micellar integrity. Hence, changing the milk pH by increasing the pH above or lowering the pH below that of natural milk pH, may also lead to a change in CM size.
Increasing milk pH by the addition of alkali solution affects the internal structure of CM. Further increases in milk pH from the isoelectric pH of protein molecules, gives rise to more negatively charged micelles. The higher negative charges strengthen the repulsive forces of the caseins chain, which in turn, produces loose and expanded structures in the micelles. In other words, the micelles swell at alkaline pH. This phenomenon is a likely explanation for the observed increase in CM size with increasing pH in the range of 6.6 to 8.5.[Citation3] However, some studies have observed that further increases in milk pH up to 11.0 appear to decrease milk turbidity.[Citation4,Citation5] As the turbidity is generated by the light scattering properties of CM, the increased transparency of milk could reflect a decrease in CM size. It is reported that this high pH caused the precipitation of serum calcium phosphate onto CM, which is shown by the low level of ionic calcium and non-micellar calcium in the serum phase.[Citation4] These conditions weakened the cohesive interaction in the micelles, leading to the breakage of the hydrophobic bonds amongst caseins which eventually dissociate the CM.[Citation6]
A decrease in the milk natural pH affects the internal structure of the CM, as well as their external surface layers. Acidified milk decreases the net charge of caseins and causes the solubilization of colloidal calcium phosphate (CCP) from the micelles into the solution.[Citation7,Citation8] As CCP acts as “a bridge” to connect the caseins, the loss of the micellar calcium phosphate will be accompanied by the shrinkage of the micelles and possible dissociation of caseins from the micelles.[Citation9] In addition, other studies have also reported that the continuing loss of net charge when the milk pH falls from 6.6 to pH 5.5, resulted in the collapse of the micelles surface’s hairy layer onto their surface.[Citation10,Citation11] Either the CCP solubilisation or the collapse of the hairy layer would then lead to a reduction in CM size at this pH range.
At a pH of less than 5.5, the CM stabilizing layer collapses, but still remains intact on the surface of the micelle. The collapse causes the repulsive forces between the micelles to become weaker and brings them closer together.[Citation12] Lowering the pH to the isoelectric pH (around pH 4.6) causes the clusters become denser, form a more compact structure and eventually start to gel.[Citation3] Other studies have also observed that the additional reduction of the caseins negative charge can enhance isoelectric precipitation[Citation10,Citation12,Citation13] and increase clustering of the casein particles.[Citation14] Therefore, a further decrease in milk pH would lead to an increase in CM size.
The change in the CM structure of bovine milk by alteration of milk pH has been studied by a numerous researchers.[Citation4,Citation15–Citation17] However, these studies only focused on either acidification or alkalinisation of milk samples. Furthermore, some of these studies observed the CM behaviour qualitatively by turbidity methods,[Citation3,Citation4,Citation6,Citation7,Citation10,Citation16,Citation18] with or without other supporting information on micellar size measurement. These methods resulted in inconsistency of results relating to CM size among the studies. For example, there was generally good agreement in the literature in relation to the decrease in turbidity at alkaline pH values. However, there were discrepancies in the interpretations relating to CM size. Some authors stated that the elevated pH resulted in an increase in CM size,[Citation3,Citation6] while others reported a decline in CM size.[Citation4,Citation5] These conflicting results were the basis to the decision to re-visit and explore the effects of pH-induced effects (both at above or below natural milk pH) on CM size and the reversibility of the micelle size upon restoration of the milk to its original pH. The direct measurement of particle size was expected to help with a later study of the size-property relationship, although the compositional change of the micellar structure may not fully recover in the same way as pH and size.
In addition, the effects of the restoration of milk pH on CM size have been less investigated, even though other studies have noted the effects on milk properties. Recently, it was found that CMs were more stable to the effects of high temperature treatment, after the restoration of pre-acidified milk to a pH 5.5.[Citation15] The effects on restoration milk of alkaline treatment were examined by others,[Citation5] who found that the physicochemical properties of the reformed and native CMs were similar.[Citation5] Studies have also been reported on the effects of pH adjustment to 7.1 prior to heat treatment, to alter the level of denatured protein and CM association. It was found that the restoration of heated milk to their natural pH before the addition of acidulants increased the final acid gel firmness;[Citation19] however, a similar effect did not apply to rennet gels.[Citation20] Limited work has been done to study the effects of a simple pH treatment on the gelation properties of milk.
The main aim of this study was to first study the effects of changes to milk pH above (7.0 to 10.5) and below (5.0 to 6.0) natural milk pH, with special attention being paid to the CM size. The restoration of the milk back to normal milk pH was conducted to examine the reversibility of CM size of the treated milk. The second aim of the study was to undertake an analysis on milk with reversible CM size, to understand whether other physico-chemical and gelation properties were also restored.
Materials and methods
Sample preparation for pH treatment of milk
Fresh pasteurized skim milk was purchased from a local supermarket. The initial pH of the milk was about 6.6. Sodium azide 0.02% (w/v) was added as a preservative to prevent microbial spoilage during the study period. In our preliminary study, it was found that sodium azide did not influence the properties of interest at the level added to the milk. Samples were stored at 4°C until further treatments. All studies were repeated three times on different batches of milk.
Hydrochloric acid (HCl) 1 M and sodium hydroxide (NaOH) 1 M were used to adjust and recover the milk pH, stirring well in the manner described by other researchers.[Citation15] The pH range used for milk above and milk below natural milk pH was 7.0 to 10.5 and 5.0 to 6.0, respectively. For alkalination (Study 1), the pH of 600 mL of pasteurized milk was recorded (6.6 ± 0.05); 100 mL of the samples was transferred to a Schott bottle for control milk pH. NaOH was added to adjust the pH of the remainder to 7.0 ± 0.05, with 100 mL of this solution being transferred to another Schott bottle. Following each time the desired pH was reached, a 100 mL sample was transferred to a Schott bottle, and the remaining solution was again adjusted to pH 7.5 ± 0.05, 8.5 ± 0.05, 9.5 ± 0.05, and 10.5 ± 0.05. The samples were referred to as “alkali adjusted milk.” The sample solutions were left at 4°C for 24 h to allow equilibration before measuring the CM size.
The treated milk pH was then restored to natural milk pH (6.6) with 1M HCl, and equilibrated for 3 h, after which the CM size was re-measured. These samples are referred as “alkali restored milk.” The same procedures were applied to acidify the milk pH to 6.0 ± 0.05, 5.5 ± 0.05, and 5.0 ± 0.05 (Study 2). Samples of the acidified milk were then labelled as “acid adjusted milk,” while the samples which were restored back to natural milk pH were labeled as “acid restored milk.” The size of all samples was measured after dilution with water (100-fold dilution). The casein micelle values presented here are the means of data from triplicate studies on individual milk samples. The study protocols followed in the three studies are illustrated in .
Figure 1. Experimental protocol for the study of effect of pH alteration of milk on casein micelle size and properties.
Measurement of pH
The pH of treated and untreated samples was measured using a digital pH meter (SmartCHEM pH, TPS Australia). The pH meter was calibrated with standard buffer solutions of pH 4.0 and 7.0 (Merck Pty Limited) before use.
Measurement of casein micelle size
Casein micelle sizes were determined by using Zetasizer (dynamic light scattering; Zetasizer Nano, Malvern Instruments, Worcestershire, UK). A He-Ne laser was used, set at an angle of 90°, with the wavelength of the laser beam being 633 nm following the procedure of other researchers.[Citation21] The viscosity and refraction index of water were 0.8872 cP and 1.330, respectively. For each sample, the light scattering measurements were carried out at 25°C, and casein micelle size and polydispersity index (pdI) were determined. Each measurement involved 12 individual runs, so that the results summarised in each study represent the mean of the 12 measurements. Three replicate measurements were performed for each sample.
The size measurements using dynamic light scattering are based on the scattering of light by moving particles. Hence, the samples must be sufficiently diluted to avoid multiple scattering CM. The duration between dilution and size measurement has also varied amongst researches, some preferring to make immediate measurements,[Citation22] while others left the samples for up to 30 min before making measurements.[Citation23] Although the duration between dilution and making measurements has been reported to not affect measurements,[Citation24] in this study the samples were kept for 15 min at room temperature before measurement, following the procedure described by Renan and others.[Citation25,Citation26] A preliminary trial on the relationship between the measurement of CM and the dilution factor was conducted. It was observed that a 100-fold dilution with Milli-Q water at the same pH was optimal for the measurement.
Soluble calcium, ethanol stability (ES), and milk whiteness
For soluble Ca measurement, the micellar and serum phase of skim milk were separated by ultracentrifugation at 20°C for 70 min at 100,000 × g (Beckman Coulter Optima LB-70M, Ultracentrifuge, with rotor type 45 Ti, Mississauga, Canada). Soluble calcium of the samples was determined in the supernatant by the inductively coupled plasma optical emission spectroscopy (ICP-EOS) method.[Citation27] ES was determined by mixing milk samples with an equal volume of aqueous ethanol (40–100%, v/v, at 2.5% intervals).[Citation28] The ES of the sample was defined as the highest ethanol concentration in which no visible coagulation was observed. Analyses were performed at room temperature (23 ± 1°C). The studies were repeated four times.
The whiteness of milk was expressed as L* value.[Citation29] The L* value represents lightness, or a spectrum from black (0) to white (100). The colour was quantitatively measured by using a hand-held colorimeter (Minolta Chromameter CR-400, Konica Minolta Sending, Inc, Japan). Prior to use, the colorimeter was calibrated using a Minolta calibration plate, following the instrument operating manual (standard stimulus values: Y = 92.4; x = 0.3161; y = 0.3325). Three replicate measurements were performed for independent sample. The results presented for each replication represent the mean averages of six measurements.
Dynamic rheological measurements
For acid-induced gel, milk samples were acidified using glucono-δ-lactone (GDL), following the procedure of other researchers.[Citation30] To allow comparisons between the different type of gels, a rennet milk gel was also prepared at 30°C by adding 0.03 IMCU mL–Citation1 of chymosin. After the addition of the coagulants, the samples were transferred to a rheometer (Discovery HR1 model), fitted with a cone geometry (diameter 40 mm, a cone angle 2°, cone truncation 54 nm). The rheological measurements were performed at a frequency of 0.1 Hz, with a constant oscillation stress of 0.1 Pa, a strain of 0.5%, and a constant temperature of 30 ± 0.1°C for 6 h. The elastic modulus (G′) was followed as a function of time and the onset of gelation was defined as the point when gels had a G′ ≥ 1 Pa. The remainder of the sample was used to determine milk pH at regular intervals during rheology measurement. The change in pH with time was monitored using a standard pH meter. After the completion of gelation, the set gels were subjected to a temperature sweep, in which the temperature was decreased from 30 to 5°C.
A preliminary study was conducted to determine the amount of GDL to be added. The alteration of milk pH led to the change of the CCP level, hence a change in the buffering capacity of the milk.[Citation31] There was, therefore, a need to avoid possible inconsistencies due to differences in the pH of the initial milk samples. The gelation studies were performed at different GDL levels, so that the acidification time to reach pH 4.5 was as close to 2 h and 30 min for all studies, as described by others.[Citation32] From these studies, the GDL levels for each of the milk samples varied from 2.0% for the milks at an initial pH of 6.6, 2.5% for pH 7.0, 1.85 for pH 6.0 and 1.2% for pH 5.5.
Gel hardness and syneresis test
The hardness of acid and rennet gels was measured by using a TA-XT2 texture analyzer (Brookfield CT3 Texture Analyser, Essex, UK), controlled by a PC computer. The measurement were made in triplicate at 25°C, as described by others.[Citation33] Samples were prepared in a container of diameter 40 mm with a sample height was 40 mm. The penetrometric test was performed 6 h after the coagulation agent was added. A flat-based cylinder probe (diameter 12.7 mm) was used, with a test speed 1.00 mm s–Citation1. The gel hardness referred to the maximum force needed to break the curd.
The syneresis test was performed using a centrifugation test based on the procedure reported by other researchers.[Citation34,Citation21] After the addition of coagulating agents, 40 g of milk was held undisturbed in a water bath at 30°C for 6 h incubation. The gels were then centrifuged at 1000 × g for 15 min at 25°C. The expelled whey was poured off, weighed, and expressed as a percentage of whey per 100 g of gel. Tests were done in triplicate for each sample.
Transmission electron microscopy (TEM)
The microstructure of acidified milk was evaluated using TEM. Samples were analyzed at the Centre for Microscopy and Microanalysis (CMM) at The University of Queensland, Australia. Analysis was conducted by fixation with high pressure freezing followed by freeze substitution, as described by others.[Citation35] Samples were frozen in a BalTec HPM010 high pressure freezer and freeze substituted over 3 h in 1% osmium tetroxide, 0.5% uranyl acetate, and 5% water in acetone. They were subsequently washed in pure acetone and infiltrated with Epon resin, which was polymerized at 60°C for 2 d. Then, 60 nm sections were cut using a Leica Ultracut T ultramicrotome and stained for 5 min with 5% uranyl acetate in ethanol and 3 min in Reynolds lead citrate. The sections were viewed in a JEOL JEM 1010 transmission electron microscope (JEOL, Tokyo, Japan) operated at 80kV, with the images being captured on a Olympus Soft Imaging Veleta digital camera (Olympus Soft Imaging, Munster, Germany).
Statistical analysis
The parameter values in each study was analysed using analysis of variance (ANOVA) with Tukey’s HSD test using Mini TAB version 16.0 with 95% confidence level. The graphs are presented by using Sigma Plot 12.5.
Results and discussion
This study was conducted to determine the size of CM after alkalination and acidification. In the alkalination component of the study, changes in CM size were recorded as a result of milk alkalination from pH 7.0 up to pH 10.5, with the milk then being restored back to their natural milk pH (Study 1). In the second part of the study, the same procedure was followed but pH below 6.6, ranging from 5.0 to 6.0 (Study 2). Based on the findings and other supporting literatures, a schematic diagram was developed to illustrate the relationship of CM size at various pHs in the range of this study. Milk with reversible CM size was subjected to further analysis of other milk properties (Study 3).
Study 1: Effect of alkalination on casein micelle size
The mean CM size of untreated skim milk at pH 6.6 in the study conditions was in the range 160–170 nm. In other reports, the size of native CM at normal milk pH (6.6 to 6.8) has ranged from between 50–500 nm, with hydrodynamic average diameters of 150–200 nm if determined by dynamic laser scattering. The milk used in this study was pasteurized skim milk, which contains native CM. Other studies[Citation3,Citation6,Citation36] used re-assembled CM provided from casein solutions (casein powder and phosphate buffer pH 7.0) or low heat skim milk powder.[Citation5] The re-assembled micelles are not identical to native CM due to differences in structure, as has also been noted by others.[Citation5] This may partly explain some of the differences in CM size values found in this study, when compared with other studies.
shows the changes in CM size in alkaline adjusted milk at pH 7.0 to 10.5, and in alkali restored milk. The mean casein micelle size of milk at pH 6.6 was 165 nm. An increase in pH to 7.0 and 7.5 resulted in an increase in mean CM size to 178 nm and 194 nm, respectively. In contrast, increasing the pH further from 8.5 to 9.5 and 10.5 caused the decline in mean CM size by 50 nm. Reflecting the smaller CM size, it is also interesting to note that increasing the pH of the milk above 8.5 significantly reduced the milk turbidity (), a response which has also noted by others.[Citation16,Citation17] Although in this study the change was not measured instrumentally, it was very clear that the liquid became more transparent with increasing pH, especially at pH of 9.5 and 10.5.
Figure 2. Mean casein micelle size of A: alkaline adjusted and restored milk, together with the picture of B: alkali adjusted and C: alkali restored milk (C). The pHs of the restored samples were reformed to 6.6 prior to size measurements.
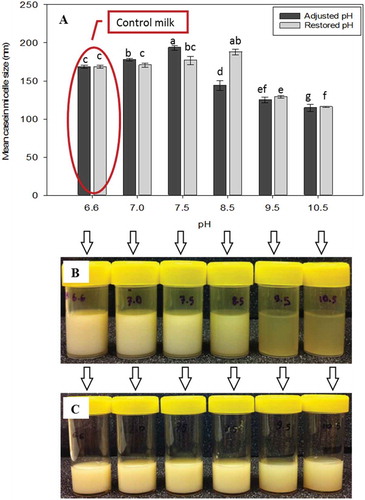
In an attempt to study the reversibility of the CM size change in the treated milk, the pH of the treated milk was restored back to normal milk pH of 6.6. The milk sample restored to pH 6.6 from a pH 7.0 and 7.5 had a similar mean CM size to untreated milk. This indicates that the CM could be reformed if the pH was adjusted from a pH less than 7.5 to pH 6.6. However, mean CM size of restored milk following alkali pH treatment at 8.5 was higher than that of normal skim milk. In contrast, both the treated and restored milk samples at pH 9.5 and 10.5 showed lower micellar size than that of the control milk. Interestingly, visual observation of restored milks up to pH 8.5 showed similar turbidity to control milk (). Milk with pH-reversal (to normal milk pH of 6.6) from pH 9.5 and 10.5 had an increase in visual milk turbidity. However, it was still clear that the change in turbidity of the restored milk from higher alkaline pH treatment was different with that of the control milk. This suggests that the process of restoration of milk from above pH 7.0 permanently destabilizes the CM.
The size distribution of adjusted and restored milk is presented as the pdI in . The pdI value is used to describe the width of the CM size distribution. It has been proposed that a pdI of less than 0.200 be considered relatively monodispersed, as it has a narrow size distribution.[Citation37] The pdI of adjusted and restored pH 7.0 milk was very close to the size distribution of untreated milk. This pdI values supported that concept that CM size of restored milk from pH 7.0 could be reformed. In contrast, following the irreversible CM size after pH reversal from pH above 7.5, the pdI of these samples were higher than pdI of control milk. Milk samples with pH >7.5 have pdI values more than 0.200, implying that the polydispersity distribution was also changed following the increased size of CM. This tendency again confirmed that the CM were permanently destabilized at this pH.
Table 1. The polydispersity index (pdI) of casein micelles of alkaline adjusted and restored milk.
The change in the casein micelle size due to alkalination has also been reported by others.[Citation5] However, they did not detail the absolute CM size for each adjusted pH up to pH 10.5 during alkalination. Rather, they just reported that the micellar size of the reformed milk from pH 10.5 was significantly lower (~183 nm) than that of native CM size (~211 nm). They also proposed that a pH reversal was followed by the recovery of ionic calcium and phosphate levels, although no evidence was given.
The observation made in this study relating to the change in milk appearance at higher adjusted pH, is in agreement with earlier reports relating to milk turbidity,[Citation17] who reported that bovine skim milk started to decrease in visual turbidity and became transparent above pH 9.0.[Citation17] Other studies also found that the turbidity of milk at pH 11.0 was comparable to that of milk serum.[Citation3,Citation5,Citation6,Citation25] In addition to the visual observations and reduction in turbidity, colorimeter measurements provided supporting data that the alkalination of milk up to pH 11.0 diminishes the white color (L*) of milk from 71 to 51 units.[Citation16]
The reduction in the whiteness of milk at high pH is possibly due to the disruption of the CM. It has been suggested that the mechanism of this disruption at higher pH to be a result of intermicellar instability in alkaline environmental conditions.[Citation5] The micelles are the main light-scattering particles in skim milk. Hence, a significant decrease in the apparent diameter would lead to a change in turbidity. In addition, increasing the pH significantly decreases ionic calcium and phosphate levels in milk serum by up to 50%. Such large reductions would further weaken the interactions between the hydrophobic bonding of the caseins.[Citation4]
Some authors have reported an increase in CM size in high alkali pH conditions.[Citation3,Citation6,Citation36] Others[Citation3] stated that milk turbidity decreased but CM size increased, with increasing pH up to 12.0. They proposed that caseins are more negatively charged at alkaline pH, as it is further from their isoelectric pH (~4.6). The increase in pH would enhance the electrostatic repulsion between the individual sub-micelles. Such repulsion would lead to a looser CM structure, and hence an increase in size. The looser micelle structure also accounts for the lower light scattering factor of casein solutions.[Citation3] Swelling and expanded structures of CM will lead to a decrease in observed turbidity.[Citation6,Citation36] In addition, the resulting looser structure would then make CM susceptible to disruption at a pH higher than 8.5, leading to extensive dissociation of the micelles, as reported by others.[Citation16,Citation25] The disruption of CM will, therefore, also be responsible for a decrease of milk turbidity. Based on the results of this study, it is suggested that for pH higher than 7.0, particles no longer be considered as CM, because the restoration of CM size for pH 7.5 to 10.5 was not fully reversible. As the main objective of this study was to manipulate CM size by changing and restoring the milk pH, only milk treated at pH 7.0 with a narrow pdI was used in the further study aimed at the characterization of selected milk properties.
Study 2: Effects of acidification on casein micelle size
The mean CM size of treated skim milk at pH below 7.0 is presented in . The average size of normal milk (pH 6.6) was 165 nm. The CM size increased at pH 7.0 to 178 nm, while lowering the pH to 6.0 and 5.5 resulted in smaller CM size (~154 nm). In this study, the pH was gradually changed to a pH as low as 5.0. There was a growth of particle size from pH 5.5 to 5.0, and by the time pH 5.0 was reached, particles gradually became visible, as the particle size was very large due to aggregation of CM. This was also reflected in the measured particle size of >1.3 μm. Although CM size was identified at this pH (in fact, the size of aggregated micelles), the size measurement using Zetasizer may be less reliable. This was due to the limitation of instruments for inhomogeneous, concentrated or phase separated samples. A sharp increase in CM size at pH 5.0 has also been observed by others.[Citation12] Therefore, the CM size at this pH was excluded in to help focus the data.
Figure 3. Mean casein micelle size of acid adjusted and restored milk. The pHs of the restored samples was reformed to 6.6 prior to size measurements.
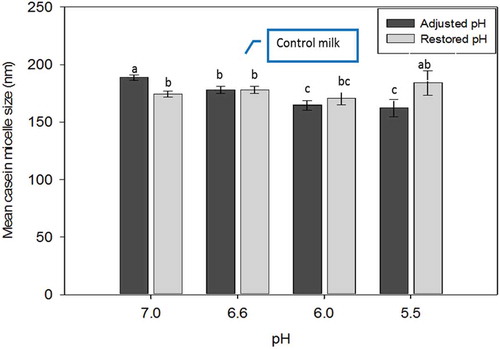
The mean size of the CM in milk restored from pH 7.0 and 6.0 were within the variable CM size range of the control samples. These findings indicate that the change in micelle size is reversible. The CM size from restored pH 5.5 milk was ~175 nm, which was not statistically different to that of control milk. However, the very high standard deviation between the replicates might reflect that other properties related to size might have not been restored. Milk with adjusted pH to 5.0 had an opposite trend to other samples. Although the measured pH of the samples was 6.6, restoration from pH 5.0 resulted in sedimentation of the casein aggregated particles (CM size not shown in ), showing that the increase in micelle size at pH 5.0 was irreversible.
Lowering milk pH resulted in the smaller size of CM, as reflected in both the instrumental measurement and microstuctural images. This decrease in size is due to two factors. First, demineralization of the micelles as a result of dissolution of the CCP from the micelles into the serum phase. As the pH is further reduced, the solubilization rate becomes faster and more of CCP is liberated. The rate of solubilisation reaches a maximum at pH 5.5,[Citation13] when up to 50% of calcium and 75% of inorganic phosphorus are released into the solution.[Citation15,Citation38] Although the authors[Citation15,Citation38] provided no CM size data in their work, they postulated that the extent of CCP solubilization in response to decreasing the pH will cause micelle disruption, leading to smaller CM. CCP is essential for maintaining the structure and stability of CM, therefore, CCP depletion can not only result in dissociation of the caseins,[Citation39] but also the destruction of the micelles.[Citation40] Some studies have reported that the order of individual protein liberation from the CM due to acidification was kappa > beta > alpha-caseins.[Citation13,Citation41] In addition, acidification diminishes the net charge of caseins, which will lead to the shrinkage (and the decrease) of the CM.[Citation42]
When milk pH falls from 6.6 to pH below 5.5, the stabilizing layer κ-casein on the micellar surface collapses[Citation43] as reflected in . The decrease in net charge weakens the intra- and inter-chain interactions in the CCP that keep the chains extended.[Citation44] As the stabilization of CM decreases, the micelles start to become closer to each other.[Citation12] At a pH closer to the pI, the clusters become denser, forming a more compact structure and eventually forming gel.[Citation3] Other studies have reported that the decrease in the negative charge of caseins can enhance isoelectric precipitation[Citation10,Citation12,Citation13,Citation42] and increase clustering of the casein particles.[Citation14] Although in this study images were not taken of milk at pH below 5.5, an electron microscopical investigation further supports the fact that the CMs lost their spherical shape when less calcium and no phosphate remaining in the micelles.[Citation45] To support the CM size measurements, the pdI of treated samples is presented in .
Figure 4. TEM micrographs of milk sample at pH A: 6.62; B: 6.0; and C: 5.5. Bars = 200 nm.
Table 2. The polydispersity index (pdI) of casein micelles of acid adjusted and restored milk.
There was no significant difference between the pdI of normal milk and adjusted milk at pH 7.0 and 6.0. Accordingly, although there was no significant difference, the pdI values of milk with restored pH from 7.0 and 6.0 were fully reversible to the pdI values close to that of untreated milk. This suggests that the size distribution of restored skim milk from pH 7.0 and 6.0 was within the range of control milk dispersion. The restoration of acidified milk with pH 5.5 and 5.0, resulted in similar pdI values to their corresponding adjusted milk, which were very different to that of control milk. The visible sedimentation of milk with adjusted and restored pH at 5.0 could also be noticed from the pdI, with the pdI values being up to four times higher than the value in control milk. These results support the conclusion that CM size in milk with restored pH from 7.0 and 6.0 back to pH 6.6, is reversible.
The microstructure of selected adjusted milk samples was examined with TEM (). The CMs appear as dark circular structures. CM size is less than 200 nm in the microscopic field at natural milk pH (). Due to a wide variation in CM size, the difference in native and altered-CM was difficult to interpret from the images. In addition, the images did not clearly reveal the internal structure. However, the rough surface of native CM at pH 6.6 was apparent, which possibly reflected as protruding hairy layers. From light scattering measurements, it was found that lowering milk pH caused a decline in CM size, which might partly explain the formation of smaller micelles in their microstructure (). The shapes of altered-micelles were slightly different with native micelles, suggesting that the pH change was not only affecting the size, but also modifying the surface of micelles.
As acidification continued to pH 5.5, more micelles with smooth surface structures were produced, possibly due to a collapse of the hairy layer, and the borders between micelles became clear (). Although there was a wide variation in size and larger micelles were still observed, the smaller micelles became predominant. It appeared that the increased distance between the micelles might have not only reflected smaller micelles, but also confirmed the collapse of hairy layers. In addition, there was still no clear sign of pronounced aggregation at this pH. The images could confirm that the modification of CM diminished their stability in this pH, causing a reduction in electrostatic repulsion between the micelles during acidification to lower pH values.
Based on the results of this study of CM size measurements and supporting literature, proposes a schematic representation of CM behaviour at various pHs, in the range of 5.0–10.5. The CM size of untreated skim milk at pH 6.6 in the experimental conditions of this study was about 165 nm. The sizes then increased upon alkalinisation to pH ~7.5, as the micelles start to swell at this pH range. The addition of more alkali solution led to the disintegration of the micelles, accompanied by a decline in micelle size.
Figure 5. Schematic diagram of changes in casein micelle size at various pHs. The pH of control milk is presented in red.
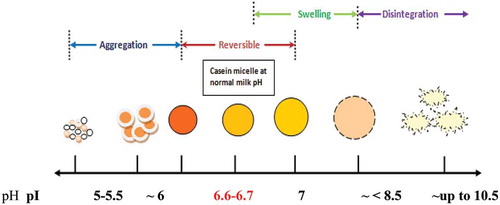
The CM behavior in alkaline samples was different to the size observed in acidified samples. Casein micelle size was smaller at pH below natural milk pH, up to pH 5.5. The CCP solubilization affected the integrity of micelle structure and possibly led to a dissociation of caseins at this pH. At pH close to the casein’s isoelectric point, the smaller micelles aggregated and finally resulted in bigger particles of micelle aggregates. These results suggest that pH alteration could change the size of CM. Interestingly, the CM size and pdI value of milk within the narrow pH range of 6.0 to 7.0 can be restored and is fully reversible. However, it is not known if the reversibility of size will also translate into the reversibility of the functional properties of the milk. To verify this effect, further work was conducted on physicochemical and gelation properties of the adjusted and restored milk at pH 7.0 and 6.0.
Study 3: Properties of milk with pH altered CM
Physico-chemical properties
In Study 3, adjusted or restored milk samples referred to milk adjusted to pH 7.0 and 6.0, or milk restored to natural pH. In this study, alkalination and acidification were performed under similar conditions for all samples: adjusted pH at room temperature and restored after overnight storage at 4°C, as also described by other researchers.[Citation6,Citation38] Under these study conditions, the CM size of milk restored back from pH 7.0 and 6.0 was reversible. The changes and restoration were also followed by changes and restoration of some properties, such as serum calcium, ES and milk whiteness ().
Table 3. Casein micelle size, soluble Ca in serum milk, ethanol stability and whiteness of control milk, adjusted to pH 7.0 and 6.0 with restoration back to pH 6.6.
The decrease and increase in milk pH was followed by an increase and decrease of serum Ca, respectively. In Study 2 it was found that the lowering milk pH led to a reduction in CM size. This may be partly due to the solubilization of CCP, which has been reported to occur under these conditions.[Citation46] The release of CCP from the micelles was detected by an increase of Ca level in the milk serum (). Milk at its natural pH contained 176.5 μg g–Citation1 of soluble Ca. The Ca values at lower pH were 40% higher than that in control milk. In contrast, increasing the pH to 7.0 decreased the soluble Ca level. It was noted that the restoration of milk to its original pH resulted in the amount of soluble Ca being comparable to control milk. Thus, although the balance between micellar and serum Ca changes upon altering milk pH, the similarity in soluble Ca of restored and control milk indicates that the restoration of CM size was accompanied by a recovery of mineral composition of CM. It is known that CM consists of 93% caseins and 7% minerals, including CCP. The caseins are linked through CCP bridges to form the micelles, so that the CCP is responsible for micelle integrity. In the literature, studies have reported that the amount of released Ca is independent of the rate of acidification[Citation5] or length of time taken to reach the desired pH.[Citation38] In other words, the amount of CCP release only depends on the final pH or the CCP release is pH dependent. Other studies have concluded that the serum Ca increased within 1 h following the pH change, while the level did not change during storage.[Citation46]
In terms of milk whiteness, the L* decreased with a decrease in milk pH. Whiteness of milk is expressed as L* (reflectance, scale of 1 to 100) of the milk. The value of milk whiteness in this study was in agreement with that reported in other studies,[Citation16,Citation47] in which the L* of normal bovine milk was 71.39 units. Increasing milk pH to 7.0 did not affect L*, whereas the values decreased after a reduction of milk pH to 6.0. Although the difference was only 2 units, a reduction in milk whiteness of acid milk can also be visually observed. Restoration produced milk with a similar L* value to control milk.
Other studies have observed that lower L* values are related to changes in the physical state of CM, such as the extent of micelle dissociation[Citation29] or disruption of CM.[Citation16] Therefore, the smaller CM of acidified milk in this study might have been responsible for the decrease in L* values. In support of the colour analysis, another study quantified the CM size reduction by measuring milk turbidity, it being concluded that smaller micelles caused less light to be reflected through the samples, leading to a more translucent appearance of skim milk.[Citation48]
The reversibility in serum Ca and L* values was accompanied by the restoration of ES. ES refers to the ability of milk to withstand ethanol addition without causing precipitation of the milk. In this study, normal milk coagulated after the addition of >82.5% ethanol. There was an increase in ES of alkaline milk to >100%, whereas the ES dropped to <50% in response to lowering the milk pH to 6.0. Similar observations on ES stability of alkaline and acid milk have been reported by others in response to the addition and removal Ca in milk.[Citation49–Citation51] ES is related to amount of ionic Ca in milk. A negative correlation exists between ionic Ca and ES.[Citation49,Citation52] At natural milk pH, CMs are negatively charged and stable against flocculation. At acid pH, the larger amount of serum Ca elevates the ionic Ca level, which, in turn, decreases the negative charge. Changes in net charge promote instability of CM, so that precipitation in response to the addition of ethanol becomes easier, leading to low ES under acidic conditions.[Citation53] The opposite tendency occurred in milk with high pH, resulting in alkaline milk with less soluble Ca and a high ES. Alkalination or acidification followed by neutralization caused the ES to be similar to that of control milk. ES is also related to milk heat stability during ultra high temperature treatment. It has been suggested that milk should have an ES of more than 74% to be suitable for severe heat.[Citation54,Citation55] Since the ES of the control and restored milk were higher than the threshold stability, it is suggested that the restored milk is also suitable for the high heat processing operation. It is suggested that changing and neutralization of milk pH in the range of this study restored its CM size. The action could also restore the serum Ca, ES, and milk whiteness. As the change in milk pH (between 7.0 and 6.0) resulted in fully reversible of CM size and other properties, a further investigation was conducted on the gelation properties of this milk.
Acid-Induced gelation
To understand the gelation properties of milk with altered CM size, the properties of acid and rennet induced gels from adjusted and restored milk were investigated. In this section, “final elastic modulus” refers to the final point on the curve after 6 h gelation. Gel development of acid gels milk made from control (pH 6.6) and adjusted pH (7.0 and 6.0) at 30°C are shown in . In this study, gelation time is considered to be the point when gels had a G′ ≥ 1 Pa. Adjusted milk started to gel within 2 h of GDL addition. Similarly, restoration of milk pH back to its original value resulted in a similar onset of gelation time and gelation pH with normal milk (). After the onset of gelation, G′ started to increase and gel development for all types of milk was slow, and then remained steady at longer ageing time. There was no significant difference between the samples; however, the onset of gelation of higher pH milk (such as at pH 7) tended to be slightly longer, as some of the acid could be consumed to bring the milk pH back to a normal milk. Accordingly, although there was a difference in their final G′ of gel from adjusted pH 6.0, all gels were weak and the G′ values only ranged between 30 to 45 Pa. This finding indicates that adjusted or restored milk in pH range of 6.0 to 7.0 did not affect the gel elasticity, because all milk types produced similar gels. Therefore, it is not surprising to observe that the restoration of CM size to their natural pH was not related to the similarity on the final elastic modulus of control and restored milk.
Figure 6. Effects of GDL addition on the elastic modulus as A: a function of time and B: subsequent temperature sweep on the elastic modulus of gels made from adjusted milk to pH (■) 7.0; (●) 6.6; (▲) 6.0, and restored milk from pH (□) 7.0 and (Δ) 6.00. Control milk is presented in red. Gels were made at 30°C for 6 h. Curves show representative samples.
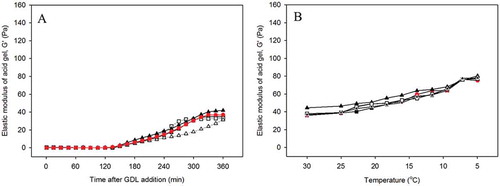
Table 4. Effect of glucono-δ-lactone (GDL) addition on the properties of acid-induced gels made from adjusted and restored milk. Gels were formed at 30°C for 6 h.
Similar results relating to the acidification of milk with different initial pH was reported.[Citation32] In the study, skim milk was heated after alteration of CCP level, which subsequently changed the milk pH in the range of 5.4 to 8.4. During acidification, they found that the gelation pH of gels made from different initial pHs at incubation temperature of 30°C was ~5.25, which appears to be higher than gelation pH of milk reported in this study. Although in this study there was similar acidification on milk with different initial pH, their samples were heated at 80°C for 30 min prior to the gelation application. Consequently, the gelation pH would also be affected by the formation of a whey protein-casein complex after the heat treatment.
A temperature sweep was performed to the set gel after 6 h of gelation, as can be seen in . In general, cooling of the gels resulted in an increase in elastic modulus. The G′ of control and treated samples increased slowly until 20°C. However, the G′ rose and almost doubled in response to the decrease in temperature to 5°C. These results indicate that gels with more elasticity were produced by the lowering of the temperature, independent of the initial milk pH before gelation.
Gel hardness and syneresis of acid gels
The texture of gels can be analyzed by either subjective (sensory panel) or objective (instrument) methods. However, throughout this study the textural properties were measured by instrumental method and focused only on the gel hardness. The hardness would then be expressed as the peak force to break the gel in the first bite, as also defined by others.[Citation56] All acid gels in this study were visually very soft in texture, mostly being in a form of “paste- or jelly-like.” Instrument measurement supported the visual appearance, in which the gel hardness was <10 g. All milk types had similar gel hardness, independent of initial milk pH, adjusted or restored milk (), indicating that the difference in initial milk pH or restored milk, did not affect the hardness.
Figure 7. A: Gel hardness and B: syneresis of acid-induced gels made from adjusted and restored milk pH. Gels were formed at 30°C for 6 h.
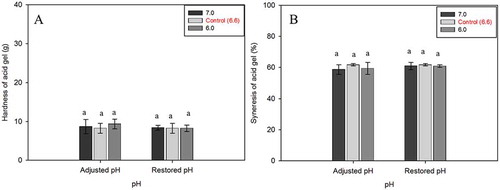
The syneresis test is also known as serum-holding capacity, and is measured in terms of the amount of expelled liquid after centrifugation of the gels. Gels formed by acidification under quiescent conditions did not show spontaneous syneresis, which is consistent with other reports.[Citation30] The syneresis was only enhanced by the mechanical pressure applied to the gels. The syneresis of all samples was within the variation of syneresis values of control gels at around 60% (). The similarities of syneresis independent of initial milk pH indicate that pH did not affect the amount of liquid expelled from the gels.
Rheological properties are important to provide an understanding of gel strength. In addition, the elastic modulus of gels can be applied to indicate how firm the gels are. The addition of GDL to acidify the milk resulted in similar values in final G′, gel hardness, and syneresis levels. Although the initial samples had different pHs and there was variation in initial properties such as mineral composition, the adjustment or restoration in CM size was not followed by a variation in gelation parameters. All gels were similarly independent of initial pH, suggesting that acidification did not produce better gels. Therefore, CM properties and their restoration in this study were not related to acid gels of the modified milk.
Rennet-induced gelation
presents the rennet gelation behavior of adjusted and restored milk samples. Control milk started to form gel after 50 min of rennet addition. Gelation time of gels made from adjusted milk pH significantly increased with increased initial milk pH (). After the onset of gelation, milk with pH 7.0 showed slower gel development when compared with others at any particular time. In contrast, gel development was very fast with milk with initial low pH (6.0), indicating that the enzyme activity was higher in this condition.
Figure 8. Effect of rennet addition on the elastic modulus as a A: function of time and B: subsequent temperature sweep on the elastic modulus of gels made from adjusted milk to pH (■) 7.0; (●) 6.6; (▲) 6.0, and restored milk from pH (□) 7.0 and (Δ) 6.00. Control milk is presented in red. Gels were made at 30°C for 6 h. Curves show representative samples.
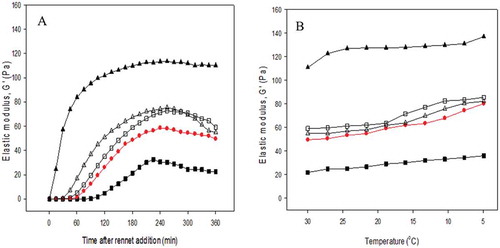
Table 5. Effect of rennet addition on the properties of rennet-induced gels made from adjusted and restored milk. Gels were formed at 30°C for 6 h.
There are two phase reactions occurring during renneting: enzymatic and non-enzymatic (aggregation). During the enzymatic process, chymosin hydrolyses κ-casein causing the micelles to become unstable.[Citation57–Citation59] However, there is variability among authors, but most agree that the second stage (non-enzymatic) occurs after >60% κ-casein has been hydrolyzed. Renneting at lower pH causes the enzymatic reaction to become faster and aggregation starts at a lower proportion of hydrolyzed κ-casein.[Citation60] The results of this study showed that rennet activity to hydrolyze the CM was optimum at pH 6.0, which was reflected by the highest G′ at that pH. It has also been noted in other studies that chymosin coagulated milk optimally at pH 6.0–6.4 at 20–30°C.[Citation14,Citation60–Citation63] In addition, a decrease in pH to 6.0 will elevate the amount of soluble Ca in serum milk compared to alkaline, control, or restored milk samples. The higher available Ca in the milk would then expand the formation of rennet gels, leading to the production of better curds, which were indicated by higher elastic modulus of the gels. Similar results was reported by others.[Citation64] In contrast, at pH 7.0 the serum milk would contain less soluble Ca,[Citation49] which is probably the explanation for the weakly coagulated gels found at pH 7.0 in this study.
In all samples, the G′ increased with time up to 4 h of incubation time. Initially, the G′ of restored milk during gel development tended to be higher than the G′ of control milk. However, the G′ showed a slight decrease during longer aging times, which probably reflected the breakdown in the gel structure after gel formation. A similar result has been previously reported, with a suggestion that such breakdown could induce spontaneous syneresis.[Citation65] After 6 h of gelation, the resultant final G′ was also different, depending on their initial adjusted pH. In response to the early gelation time, gel made from rennet milk adjusted to pH 6.0 produced gel with G′ nearly two times higher than for control milk. Restoring the pH back to natural milk pH produced gel with similar gelation time and elasticity to the control gels. Restoration of milk pH reversed the balance of Ca equilibrium and resulted in their similarity in gelation time and final G′ to the control gels. Rennet gelation might not be directly related to CM size. However, renneting of acid milk containing smaller CM (pH 6.0) produced gels with higher elastic modulus.
The rennet gels were cooled after the fermentation or gelation as also proposed by others.[Citation66] From it can also be observed that gels behaved differently if subjected to lower temperature. Gels of control and treated milk had similar patterns in response to cooling to 5°C, as a result of which all G′ showed an increase of around 50% of their G′ at 30°C. The temperature decrease to 20°C only had a minor effect on the G′ when compared to the change in lower temperature. In line with the variation in final G′ at 30°C following the variation in initial milk pHs, elastic modulus of cold rennet gels made from acid milk was higher at all temperatures. Unlike the significantly effect of temperature on acid gels, low temperature only mildly increased the elasticity of cold rennet gels.
Gel hardness and syneresis of rennet gels
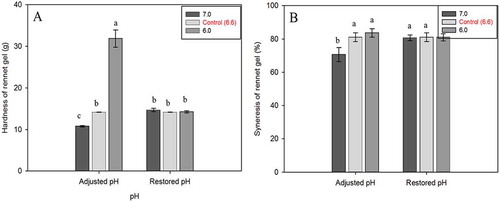
presents the hardness of rennet gels. In response to the higher G′ of gel made from acid milk, it can be clearly seen that an initial lower pH increased the texture of rennet gels, where the effect was absent in gels with a higher pH. The significant increase in G′ of gels made from pH 6.0 milk was followed by higher gel hardness measured by a texture analyzer. In contrast, adjusted milk to pH 7.0 prior to rennet gelation produced gels 20% weaker than the control gels. Gels made from restored samples had similar hardness values to control milk. Rennet gels exhibited syneresis after centrifugation of the gels. It was clearly observed that most of liquid was expelled from the curd and the firm solid gel was at the bottom of the centrifuge tubes. Syneresis decreased as the pH of the milk was more alkaline (), which conforms to other reports.[Citation34,Citation67] In contrast, adjusted milk to lower pH prior to rennet gelation did not have an effect on the syneresis. Likewise, the syneresis level of restored milk was comparable to control milk (~80%), indicating that syneresis change was only affected by the initial high milk pH.
Figure 9. A: Gel hardness and B: syneresis of rennet-induced gels made from adjusted and restored milk pH. Gels were formed at 30°C for 6 h.
Conclusions
Based on the results of this study it can be concluded that the adjustment of pH of milk to 6.0 resulted in a decrease in CM size, accompanied by an increase in soluble Ca, a decrease in ES, and a decrease in L*. Opposite trends occurred when the pH was adjusted to 7.0. The change in CM size was reversible within a small pH range of 6.0–7.0. It is still unclear whether the size reversibility was related to the restoration of native CM structure. However, some fundamental properties (soluble calcium, ES, and milk whiteness) were found to have been restored. Gelation properties were rather different, with acid gels not necessarily being related to the change in CM size. The final G′ values of acid gels of pH adjusted milk at 6 h were similar to those for control milk. Rennet gels made from control and restored milk was similar. Renneting acid gels resulted in the shortening of gelation time and firmer gels, confirming the optimum rennet activity as a potential alternative for improving rennet gelation. These findings provide further insights into how far the restoration of milk influences milk properties. The results of the study might have potential for commercial application in modifying the functional characteristics of milk in relation to pH variation.
Acknowledgment
The authors are grateful for Dr John M. Schiller (Honorary Senior Fellow, School of Agriculture and Food Sciences, The University of Queensland), for his assistance in the proofreading of this manuscript.
Funding
The authors would like to thank Dairy Innovation Australia Ltd. (DIAL) for the financial support provided to undertake this research, DIKTI for the financial support granted to Hotnida Sinaga during her study.
References
- Phadungath, C. Casein Micelles Structure: A Concise Review. Songklanakann Journal of Science Technology 2005, 27 (1), 201–212.
- Fox, P.F.; Brodkorb, A. The Casein Micelle: Historical Aspects, Current Concepts, and Significance. International Dairy Journal 2008, 18 (7), 677–684.
- Liu, Y.; Guo, R. pH-Dependent Structures and Properties of Casein Micelles. Biophysical Chemistry 2008, 136 (2–3), 67–73.
- Vaia, B.; Smiddy, M.A.; Kelly, A.L.; Huppertz, T. Solvent-Mediated Disruption of Bovine Casein Micelles at Alkaline pH. Journal of Agricultural and Food Chemistry 2006, 54 (21), 8288–8293.
- Huppertz, T.; Vaia, B.; Smiddy, M.A. Reformation of Casein Particles from Alkaline-Disrupted Casein Micelles. Journal of Dairy Research 2008, 75 (1), 44–47.
- Madadlou, A.; Mousavi, M.E.; Emam-Djomeh, Z.; Sheehan, D.; Ehsani, M. Alkaline pH Does Not Disrupt Re-Assembled Casein Micelles. Food Chemistry 2009, 116 (4), 929–932.
- McMahon, D.J.; Du, H.; McManus, W.R.; Larsen, K.M. Microstructural Changes in Casein Supramolecules During Acidification of Skim Milk. Journal of Dairy Science 2009, 92 (12), 5854–5867.
- Roefs, S.; Walstra, P.; Dalgleish, D.G.; Horne, D.S. Preliminary Note on the Change in Casein Micelles Caused by Acidification. Netherlands Milk and Dairy Journal 1985, 39 (2), 119–122.
- Dalgleish, D.G.; Horne, D.S.; Law, A.J.R. Size-Related Differences in Bovine Casein Micelles. Biochimica et Biophysica Acta (BBA)—General Subjects 1989, 991 (3), 383–387.
- De Kruif, C.G. Skim Milk Acidification. Journal of Colloid and Interface Science 1997, 185 (1), 19–25.
- De Kruif, C.G. Casein Micelle Interactions. International Dairy Journal 1999, 9 (3–6), 183–188.
- Alexander, M.; Dalgleish, D.G. Application of Transmission Diffusing Wave Spectroscopy to the Study of Gelation of Milk by Acidification and Rennet. Colloids and Surfaces B-Biointerfaces 2004, 38 (1–2), 83–90.
- Lucey, J.A.; Dick, C.; Singh, H.; Munro, P.A. Dissociation of Colloidal Calcium Phosphate-Depleted Casein Particles as Influenced by pH and Concentration of Calcium and Phosphate. Milchwissenschaft-Milk Science International 1997, 52 (11), 603–606.
- Lucey, J.A.; Gorry, C.; Okennedy, B.; Kalab, M.; TanKinita, R.; Fox, P.F. Effect of Acidification and Neutralization of Milk on Some Physico-Chemical Properties of Casein Micelles. International Dairy Journal 1996, 6 (3), 257–272.
- Ezeh, V.N.; Lewis, M.J. Milk Reversibility Following Reduction and Restoration of pH. International Journal of Dairy Technology 2011, 64 (2), 179–187.
- Ahmad, S.; Piot, M.; Rousseau, F.; Grongnet, J.F.; Gaucheron, F. Physico-Chemical Changes in Casein Micelles of Buffalo and Cow Milks as a Function of Alkalinisation. Dairy Science & Technology 2009, 89 (3–4), 387–403.
- Vandijk, H.J.M. The Properties of Casein Micelles 6. Behavior Above pH 9, and Implications for the Micelle Model. Netherlands Milk and Dairy Journal 1992, 46 (2), 101–113.
- Orlien, V.; Boserup, L.; Olsen, K. Casein Micelle Dissociation in Skim Milk During High-Pressure Treatment: Effects of Pressure, pH, and Temperature. Journal of Dairy Science 2010, 93 (1), 12–18.
- Oh, H.E.; Wong, M.; Pinder, D.N.; Hemar, Y.; Anema, S.G. Effect of pH Adjustment at Heating on the Rheological Properties of Acid Skim Milk Gels with Added Potato Starch. International Dairy Journal 2007, 17 (12), 1384–1392.
- Anema, S.G.; Lee, S.K.; Klostermeyer, H. Effect of pH at Heat Treatment on the Hydrolysis of Kappa-Casein and the Gelation of Skim Milk by Chymosin. LWT–Food Science and Technology 2007, 40 (1), 99–106.
- Gastaldi, E.; Trial, N.; Guillaume, C.; Bourret, E.; Gontard, N.; Cuq, J.L. Effect of Controlled Kappa-Casein Hydrolysis on Rheological Properties of Acid Milk Gels. Journal of Dairy Science 2003, 86 (3), 704–711.
- Titapiccolo, G.I.; Corredig, M.; Alexander, M. Modification to the Renneting Functionality of Casein Micelles Caused by Nonionic Surfactants. Journal of Dairy Science 2010, 93 (2), 506–514.
- Marchin, S.; Putaux, J.L.; Pignon, F.; Leonil, J. Effects of the Environmental Factors on the Casein Micelle Structure Studied by Cryo Transmission Electron Microscopy and Small-Angle X-Ray Scattering/Ultrasmall-Angle X-Ray Scattering. Journal of Chemical Physics 2007, 126 (4), 1–10.
- Faka, M.; Lewis, M.J.; Grandison, A.S.; Deeth, H. The Effect of Free Ca2+ on the Heat Stability and Other Characteristics of Low-Heat Skim Milk Powder. International Dairy Journal 2009, 19 (6–7), 386–392.
- Guyomarc’h, F.; Mahieux, O.; Renan, M.; Chatriot, M.; Gamerre, V.; Famelart M.H. Changes in the Acid Gelation of Skim Milk as Affected by Heat-Treatment and Alkaline pH Conditions. Lait 2007, 87 (2), 119–137.
- Renan, M.; Guyomarc’h, F.; Chatriot, M.; Gamerre, V.; Famelart, H. Limited Enzymatic Treatment of Skim Milk Using Chymosin Affects the Micelle/Serum Distribution of the Heat-Induced Whey Protein/Kappa-Casein Aggregates. Journal of Agricultural and Food Chemistry 2007, 55 (16), 6736–6745.
- Sandra, S.; Cooper, C.; Alexander, M.; Corredig, M. Coagulation Properties of Ultrafiltered Milk Retentates Measured Using Rheology and Diffusing Wave Spectroscopy. Food Research International 2011, 44 (4), 951–956.
- Huppertz, T.; Grosman, S.; Fox, P.F.; Kelly, A. Heat and Ethanol Stabilities of High-Pressure-Treated Bovine Milk. International Dairy Journal 2004, 14 (2), 125–133.
- O’Sullivan, M.M.; Kelly, A.L.; Fox, P.F. Influence of Transglutaminase Treatment on Some Physico-Chemical Properties of Milk. Journal of Dairy Research 2002, 69 (3), 433–442.
- Anema, S.G. Heat and/or High-Pressure Treatment of Skim Milk: Changes to the Casein Micelle Size, Whey Proteins, and the Acid Gelation Properties of the Milk. International Journal of Dairy Technology 2008, 61 (3), 245–252.
- Anema, S.G. Effect of pH at Pressure Treatment on the Acid Gelation of Skim Milk. Innovative Food Science & Emerging Technologies 2010, 11 (2), 265–273.
- Anema, S.G. Role of Colloidal Calcium Phosphate in the Acid Gelation Properties of Heated Skim Milk. Food Chemistry 2009, 114 (1), 161–167.
- Nian, Y.; Chen, B.Y.; Aikman, P.; Grandison, A.; Lewis, M. Naturally Occurring Variations in Milk pH and Ionic Calcium and Their Effects on Some Properties and Processing Characteristics of Milk. International Journal of Dairy Technology 2012, 65 (4), 490–497.
- Daviau, C.; Famelart, M.H.; Pierre, A.; Goudedranche, H.; Maubois, J.L. Rennet Coagulation of Skim Milk and Curd Drainage: Effect of pH, Casein Concentration, Ionic Strength, and Heat Treatment. Lait 2000, 80 (4), 397–415.
- McDonald, K.L.; Webb, R.I. Freeze Substitution in 3 Hours or Less. Journal of Microscopy 2011, 243 (3), 227–233.
- Madadlou, A.; Mousavi, M.E.; Emam-djomeh Z.; Ehsani, M.R.; Sheehan, D. Sonodisruption of Re-Assembled Casein Micelles at Different pH Values. Ultrasonics Sonochemistry 2009, 16 (5), 644–648.
- Arroyo-Maya, I.J.; Rodiles-Lopez, J.O.; Cornejo-Mazon, M.; Gutierrez-Lopez, G.F.; Hernandez-Arana, A.; Toledo-Nunez, C.; Barbosa-Canovas, G.V.; Flores-Flores, J.O.; Hernandez-Sanchez, H. Effect of Different Treatments on the Ability of Alpha-Lactalbumin to Form Nanoparticles. Journal of Dairy Science 2012, 95 (11), 6204–6214.
- Law, A.J.R.; Leaver, J. Effects of Acidification and Storage of Milk on Dissociation of Bovine Casein Micelles. Journal of Agricultural and Food Chemistry 1998, 46 (12), 5008–5016.
- Holt, C.; Davies, D.T.; Law, A.J.R. Effects of Colloidal Calcium-Phosphate Content and Free Calcium-Ion Concentration in the Milk Serum on the Dissociation of Bovine Casein Micelles. Journal of Dairy Research 1986, 53 (4), 557–572.
- Famelart, M.H.; Gauvin, G.; Paquet, D.; Brule, G. Acid Gelation of Colloidal Calcium Phosphate Depleted Preheated Milk. Dairy Science & Technology 2009, 89 (3–4), 335–348.
- Bak, M.; Rasmussen, L.K.; Petersen, T.E.; Nielsen, N.C. Colloidal Calcium Phosphates in Casein Micelles Studied by Slow-Speed-Spinning P-31 Magic Angle Spinning Solid-State Nuclear Magnetic Resonance. Journal of Dairy Science 2001, 84 (6), 1310–1319.
- Tuinier, R.; Rolin, C.; De Kruif, C.G. Electrosorption of Pectin onto Casein Micelles. Biomacromolecules 2002, 3, 632–638.
- Ouanezar, M.; Guyomarc’h, F.; Bouchoux, A. AFM Imaging of Milk Casein Micelles: Evidence for Structural Rearrangement upon Acidification. Langmuir 2012, 28 (11), 4915–4919.
- Lucey, J.A.; Singh, H. Formation and Physical Properties of Acid Milk Gels: A Review. Food Research International 1997, 30 (7), 529–542.
- Gastaldi, E.; Lagaude, A.; DelAfuente, B.T. Micellar Transition State in Casein Between pH 5.5 and 5.0. Journal of Food Science 1996, 61 (1), 59–64.
- Wade, T.; Beattie, J.K.; Rowlands, W.N.; Augustin, M.A. Electroacoustic Determination of Size and Zeta Potential of Casein Micelles in Skim Milk. Journal of Dairy Research 1996, 63 (3), 387–404.
- Huppertz, T.; Fox, P.F.; Kelly, A.L. Properties of Casein Micelles in High Pressure-Treated Bovine Milk. Food Chemistry 2004, 87 (1), 103–110.
- Kulozik, U. Variation of the Calcium Content in Skim Milk by Diafiltration and Ion Exchange—Effects on Permeation Rate and Structure of Deposited Layers in the RO. Journal of Membrane Science 1998, 145 (1), 91–97.
- Lin, M.J.; Grandison, A.; Chryssanthou, X.; Goodwin, C.; Tsioulpas, A.; Koliandris, A.; Lewis, M. Calcium Removal from Milk by Ion Exchange. Milchwissenschaft-Milk Science International 2006, 61 (4), 370–374.
- Horne, D.S.; Muir, D.D. Alcohol and Heat Stability of Milk Protein. Journal of Dairy Science 1990, 73 (12), 3613–3626.
- Johnston, D.E.; Rutherford, J.A.; McCreedy, R.W. Ethanol Stability and Chymosin-Induced Coagulation Behaviour of High Pressure Treated Milk. Milchwissenschaft-Milk Science International 2002, 57 (7), 363–366.
- Tsioulpas, A.; Lewis, M.J.; Grandison, A.S. Effect of Minerals on Casein Micelle Stability of Cows’ Milk. Journal of Dairy Research 2007, 74 (2), 167–173.
- Horne, D.S.; Parker, T.G. Factors Affecting the Ethanol Stability of Bovine Milk: II. The Origin of the pH Transition. Journal of Dairy Research 1981, 48 (02), 285–291.
- Shew, D.I. Technical Aspects of Quality Assurance; International Dairy Federation: Brussels, Belgium, 1981.
- Tsioulpas, A.; Grandison, A.S.; Lewis, M.J. Changes in Physical Properties of Bovine Milk from the Colostrum Period to Early Lactation. Journal of Dairy Science 2007c, 90 (11), 5012–5017.
- Muthukumarappan, K.; Karunanithy, C. Texture. In Handbook of Dairy Food Analysis, Nollet, L.M.L.; Toldra, F.; Eds.; CRC Press: Boca Raton, FL, 2010.
- Dalgleish, D.G. A Mechanism for the Chymosin-Induced Flocculation of Casein Micelles. Biophysical Chemistry 1980, 11 (2), 147–155.
- McMahon, D.J.; Brown, R.J. Enzymic Coagulation of Casein Micelles: A Review. Journal of Dairy Science 1984, 67 (5), 919–929.
- Mistry, V.V. Chymosin in Cheese Making. In Food Biochemistry and Food Processing, 2nd Ed; Simpson, B.K.; Ed.; Wiley-Blackwell, Ames, IA, 2012.
- Vanhooydonk, A.C.M.; Hagedoorn, H.G.; Boerrigter, I.J. pH-Induced Physicochemical Changes of Casein Micelles in Milk and Their Effect on Renneting 1. Effect of Acidification on Physicochemical Properties. Netherlands Milk and Dairy Journal 1986, 40 (2–3), 281–296.
- Lucey, J.A.; Johnson, M.E.; Horne, D.S. Invited Review: Perspectives on the Basis of the Rheology and Texture Properties of Cheese. Journal of Dairy Science 2003, 86 (9), 2725–2743.
- Zoon, P.; Vanvliet, T.; Walstra, P. Rheological Properties of Rennet-Induced Skim Milk Gels 4. The Effect of pH and NaCl. Netherlands Milk and Dairy Journal 1989, 43 (1), 17–34.
- Li, Y.; Wang, W. Serum Protein Aggregates in the High-Heated Milk and Their Gelation Properties in Rennet-Induced Milk Gel. International Journal of Food Properties 2015. DOI:10.1080/10942912.2015.1091474
- Choi, J.; Horne, D.S.; Lucey, J.A. Effect of Insoluble Calcium Concentration on Rennet Coagulation Properties of Milk. Journal of Dairy Science 2007, 90 (6), 2612–2623.
- Mellema, M.; Walstra, P.; van Opheusden, J.H.J.; van Vliet, T. Effects of Structural Rearrangements on the Rheology of Rennet-Induced Casein Particle Gels. Advances in Colloid and Interface Science 2002, 98 (10), 25–50.
- Ramaswamy, H.S.; Chen, C.R.; Rattan, N.S. Comparison of Viscoelastic Properties of Set and Stirred Yogurts Made from High Pressure and Thermally Treated Milks. International Journal of Food Properties 2015, 18 (7), 1513–1523.
- Lodaite, K.; Östergren, K.; Paulsson, M.; Dejmek, P. One-Dimensional Syneresis of Rennet-Induced Gels. International Dairy Journal 2000, 10 (12), 829–834.