
ABSTRACT
The aim of this study was to determine the anisotropy of three strawberry varieties (Coral, Darselect, and Elsanta) related to texture profile analysis and texture parameters of creep curves. Color and physico-chemical properties were determined and a correlation was established with texture properties. The texture parameters were negatively related with moisture content, whereas the coefficient of anisotropy showed a significant positive correlation with hardness and texture parameters of creep curves (p < 0.01). The Darselect variety in different stages of ripeness (nearly ripe, ripe, and over ripe) showed the highest coefficient of anisotropy, the highest hardness, and simultaneously, a greater resistance to mechanical stress.
Introduction
It is a well-known fact that strawberries are fruit consumed by many people, each consumer expecting them to be tasty and good-looking. However, apart from being appealing to the senses, they represent a healthy food choice, due to its dietary fibers and fructose content, phenolic compounds, and a high content of vitamin C, which makes them an important source for human nutrition.[Citation1–Citation3] As for quality, the sweetness of strawberries is one of the most important aspects, depending on the balance between sugars and acids in fruit. Total soluble sugars in fruits are carbohydrates of low molecular weight; they are the most soluble solids of strawberries and are related to sweetness, flavor, aroma, attractive color, and texture.[Citation4]
Another aspect of emphasis is food texture, which is an important quality attribute, perceived with the sense of touch, either when the product is picked up by hand or placed in the mouth and chewed.[Citation5,Citation6] In contrast to flavor attributes, texture characteristics are fairly easily measured using instrumental analysis.[Citation7,Citation8] The texture of fruits and vegetables is derived from their turgor pressure, the composition of individual plant cell walls, and the middle lamella that holds individual cells together.[Citation9,Citation10]
An aspect worth taking into account when having to deal with food texture measurement is represented by food anisotropy, considering the fact that some foods are isotropic while other foods are anisotropic. In case of isotropic food the testing direction does not matter, but for anisotropic food samples it is important that the testing should be made in the same direction.[Citation11,Citation12] Food products of animal origin (meat) show a pronounced anisotropy, while vegetable products show a moderate anisotropy due to polyhedral cells’ form.[Citation13]
In the case of bending tests, the homogeneous and isotropic samples give accurate results as long as the sample length is about ten times greater than its thickness, but if the material is moderately anisotropic and heterogeneous, the length should be 100 times, or even higher than, the sample’s thickness to obtain correct results.[Citation12] The texture profile analysis (TPA) is one of the most used methods to determine the primary texture parameters (hardness, cohesiveness, viscosity, elasticity, adhesiveness) and secondary texture parameters (fracturability, gumminess, chewiness), and it is based on chewing process.[Citation14,Citation15]
These measured and calculated values of primary and secondary texture parameters are correct only in the case of isotropic products, but in the case of anisotropic products the texture properties vary with direction and errors occur.[Citation16] The TPA profile has been used to determine the textural properties of fruit,[Citation17,Citation18] vegetables,[Citation19] mushrooms,[Citation20] meat products,[Citation21] gelled food systems,[Citation22] and cheese.[Citation23] To the authors’ knowledge, no other study related to the measurement of strawberry anisotropy and creep curves has been reported. Consequently, this study aimed to focus on the measurement of the anisotropy and texture properties of three strawberry varieties correlated with their chemical composition and appearance.
Materials and Methods
Darselect, Elsanta, and Coral strawberries were purchased from a local producer from Romania in three different stages of ripeness: nearly ripe, ripe, and over ripe, all fruits having the same shape and size, and weighing 20 g each. The harvesting stages (nearly ripe, ripe, and over ripe) were influenced by ripening time and fruit color, so that the nearly ripe strawberries were harvested two days in advance compared to the ripe ones, whereas the over ripe ones were harvested two days later than the ripe ones.
In order to determine the texture parameters of these three varieties of strawberries, a TPA was performed.[Citation24,Citation25] This analysis was made by a Mark 10 texturometer (Mark 10 Corporation, USA) with a loading speed of 10 mm∙min−Citation1 using compression discs of 50 mm diameter, and the sample was compressed to 60%, and 20 mm of its original size, respectively. The data obtained from TPA curve were used to calculate primary and secondary texture parameters.
Hardness is expressed as the maximum force for the first compression, and adhesiveness is expressed as the negative force area for the first bite or the work necessary to pull the compressing plunger away from the sample. Elasticity is calculated as the ratio between displacement from the start of the second area up to the second sample reversal and the displacement between the start of the first area and the first sample reversal. Cohesiveness is a parameter of the difficulty degree in breaking down the samples’ internal structure. Gumminess and chewiness have been reported as products between hardness and cohesiveness. Chewiness is calculated as hardness × cohesiveness × elasticity.[Citation26]
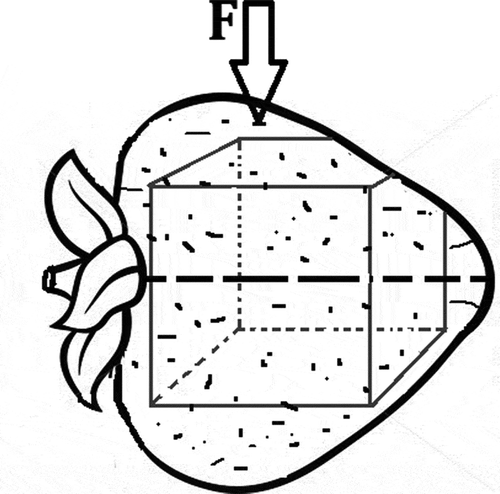
An optoelectronic measuring device has been built and patented for anisotropy measurement (see ), which measures unevenness of the sample’s deformation in two directions perpendicularly to each one during stress of compression and transforms these deformation values into a coefficient of anisotropy (Ka) through a specialized software.[Citation15] The sample has cubic shape (), with sides of 20 mm.
Figure 1. Device for determining the food anisotropy: 1: metal box; 2: video camera; 3: capture and shielding con; 4: thick glass disc; 5: food sample; 6: ring of LEDs; 10: compression discs; 13: electronic power source; 14: PC.
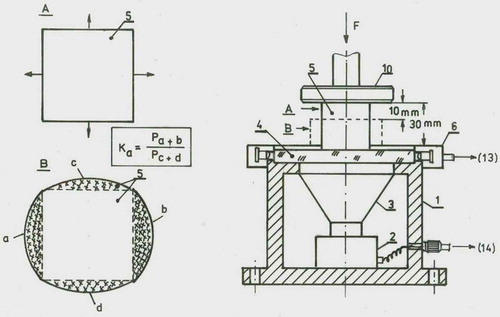
Figure 2. The testing direction and the preparation of the strawberry samples for the anisotropy measurement.
where Pa+b was the highest amount of two opposing ellipse segments. Pc+d was the lower amount of the other two opposing ellipse segments. Another destructive test used in this study to determine some texture properties was the creep test, performed with a device equipped with a sensory system for displacement and time measurement from Mitutoyo (Mitutoyo Corporation, USA).[Citation27] To conduct this analysis a creep method without preload was used. The stress time was 2000 s, and the weight stress was 300 g.[Citation28,Citation29]
Strawberries’ concentration of soluble substances expressed as °Brix was determined by refractometry, using a Leica Mark II Plus refractometer with a measurement accuracy of 0.1%. The pH was measured using a pH meter and moisture content was determined by oven drying at 103 ± 2°C to a constant weight. The measurement of the surface colour of each strawberry was achieved with a USB 4000 Ocean Optics spectrophotometer by using the CIE L*a*b* uniform color space method, where: L* represents brightness (0 black and 100 white), a* represents red–green axis (+a* red and –a* green) and b* represents yellow–blue axis (+b* yellow and –b* blue). The illuminant used was D65 in reflective mode and the color measurement was made at an angle of 45 degrees to the sample. Strawberries’ color difference (ΔE*) was calculated by the formula:[Citation30]
where ΔL* is the brightness difference between the two samples, Δa* is the difference between red-green coordinates, Δb* is the difference between yellow–blue coordinates.In addition, hue angle (tone; h°) and chroma (color intensity; C*) was calculated by the following formulas:[Citation31,Citation32]
Statistical Analysis
Principal components analysis (PCA) was performed using Unscrambler 9.7 (CAMO Process AS, Oslo, Norway), all the physico-chemical, color, and textural parameters were weighted and normalized in order to perform the PCA. The PCA was applied to describe the relationship between the physico-chemical, color, and textural parameters. Statistical analysis was performed using the Statgraphics Plus software system—trial version. Pearson correlation was made using SPSS 13 (USA).
Results and Discussion
The moisture content, °Brix concentration and pH value of strawberry samples are shown in . The moisture content of the strawberries has ranged between 87.251–89.997%, and we can see that their humidity increased with fruits ripening. The pH value was in the acid region (3.81–4.22), while the °Brix has ranged between 8.4–14.2. In terms of physico-chemical parameters these three strawberry varieties have similar properties, a difference being recorded in the over ripe Elsanta category which has a higher concentration of soluble substances than the rest of the samples analyzed. The pH values and the concentration of soluble substances are in the same range with those reported by various authors.[Citation33–Citation35] Strawberries’ brightness (L*) ranges between 99.5–84.2; nearly ripe samples have the highest brightness, and over ripe samples have the lowest brightness of these three varieties: Elsanta, Darselect, and Coral strawberries. In the case of a*, all samples are situated in the positive region on the red–green axis, more toward red. In contrast, the b* parameter of nearly ripe samples is situated in the negative region on the yellow–blue axis, more toward yellow, while the other samples (ripe and overripe) have the b* parameter situated in the positive region on the yellow–blue axis, more toward blue (). The research data demonstrate that the Darselect, Elsanta, and Coral over ripe samples have the highest color intensity (C*) 4.534–6.940.
Table 1. Physico-chemical and color parameters of strawberry samples.
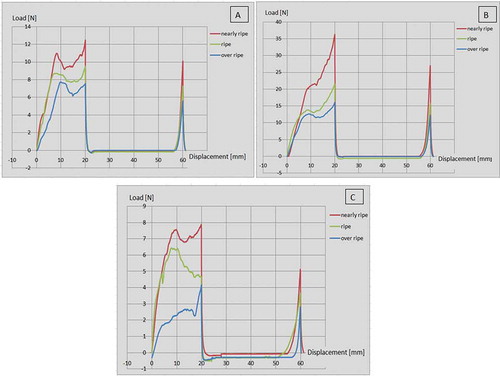
For color parameters, Pearson correlation () indicates a significant negative correlation (r = –0.712, p < 0.05) between brightness (L*) and a* (red–green axis) and a positive significant Pearson correlation between b* (yellow–blue axis; r = 0.963**, p < 0.01), color intensity (r = 0.859**, p < 0.01), tone (0.731*, p < 0.05) and concentration of soluble substances. The color difference between samples of the same variety is greater than three, which indicates that the color difference of the strawberries analyzed can be appreciated by the human eye (). The highest color difference between over ripe and nearly ripe strawberry samples is registered by the Coral variety (ΔE =14.427). shows the TPA profile of Elsanta, Darselect, and Coral strawberries in three different stages of ripeness, and it can be observed that some of the textural parameters are influenced by the ripening process.
Table 2. The color difference.
Table 3. The anisotropy coefficient of elsanta, darselect and coral strawberry.
Table 4. Textural properties of elsanta, darselect and coral strawberry.
Table 5. Pearson corelation matrix between the textural, physico-chemical and color parameters.
Figure 3. A: Elsanta texture profile analysis; B: Darselect texture profile analysis; C: Coral texture profile analysis.
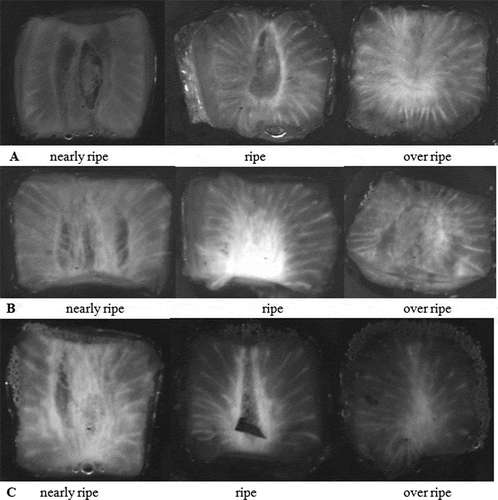
For anisotropic food products the coefficient of anisotropy is a number higher than one (Ka > 1). The results of TPA will be multiplied by the value of anisotropy coefficient, except chewiness for which the anisotropy influence is more complex, and we can not correct the measured value by simple multiplication by the anisotropy coefficient.[Citation15] presents the results of strawberries’ anisotropy coefficient which was calculated based on , , and , Darselect strawberries () having the most pronounced level of anisotropy between 1.224–1.260.
Figure 4. The strawberry anisotropy: A: The anisotropy of Elsanta strawberry; B: The anisotropy of Darselect strawberry; C: The anisotropy of Coral strawberry.
The anisotropy coefficient shows a significant positive correlation with hardness, cohesiveness (p < 0.01) and elasticity, gumminess, and chewiness (p < 0.05), whereas a negative Pearson correlation is between the texture properties of creep curves (penetration depth and mechanical work) and the coefficient of strawberry anisotropy (r = –0.948**, p < 0.01). Besides the storage conditions, in terms of consumer’s acceptability, strawberries’ hardness is a very important property for producers, processors, and retailers. Strawberries’ hardness ranges between 4.202–44.382 N, the lowest values being recorded by the Coral variety (over ripe – 4.202 N), while the Darselect variety presents the highest hardness (nearly ripe – 44.382 N), gumminess, and chewiness among the varieties analyzed. Elsanta presents the highest fracturability ().
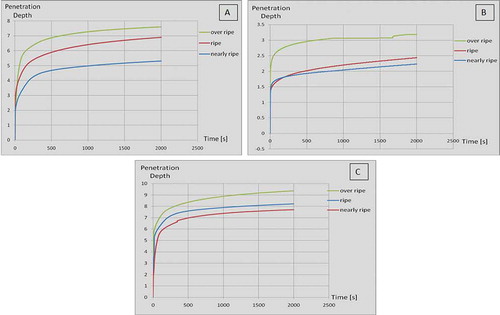
Creep tests were also made by other scientists on dough, bread, or butter to investigate the failure of soft viscoelastic solids.[Citation28,Citation29,Citation36] In terms of texture properties, creep curves are characterized by penetration depth and mechanical work of compression. , , and show the creep curve of strawberry samples, and it can be observed that the penetration depth and mechanical work of compression increase with the fruit ripeness, so we can conclude that the creep texture parameters are influenced positively by the ripening process. The penetration depths vary between 2.23 mm in Darselect nearly ripe fruit to 9.37 mm in Coral over ripe fruit (), while the Darselect variety shows the lowest values of penetration depth, being followed by the Elsanta variety. The result shows that the Coral variety was the most fragile of all the strawberries analyzed.
Figure 5. A: Elsanta creep curves; B: Darselect creep curves; C: Coral creep curves.
presents the Pearson corelation matrix between the textural, physico-chemical, and color parameters. It seems that some textural parameters (hardness, elasticity cohesiveness, gumminess, chewiness) are highly positively influenced one by the other (p < 0.01) and the viscosity has a positive influence on adhesiveness (p < 0.01). Another consideration is that the penetration depth and work of compression from creep curves are negatively correlated with the texture parameters: hardness, elasticity, cohesiveness, gumminess, and chewiness (p < 0.01).
The moisture content has a negative influence on strawberry hardness (r = –0.729*, p < 0.05), another negative corelation exists between elasticity (E) and yellow–blue axis (b*; r = –0.713*, p < 0.05), between elasticity (E) and brightness (L*), the Pearson correlation indicating a significant positive correlation (r = 0.798*, p < 0.05). A high positive correlation exists also between cohesiveness (Co) and brightness (L*; r = 0.725*, p < 0.05).
The scores and correlations of PCA are presented in and , and the two main components (PCs) explain 99% of variation in the data set. The PC1 explained 81% of the variation and PC2 18%. PCA analysis showed clear differences between strawberry varieties and between different stages of strawberry ripening, . The PC-2 allows dividing the strawberry samples into three major groups: on the left side there are the Darselect samples, which in terms of texture parameters have a high hardness; on the right side there are the samples of Coral varieties,which are the most fragile strawberries; and in the center the Elsanta variety is found.
Figure 6. PCA scores of strawberry samples: p1: nearly ripe; p2: ripe; and p3: over ripe.
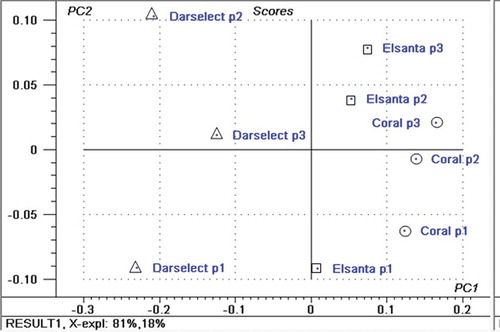
Figure 7. PCA loadings of strawberry samples. H: hardness; F: fracturability; V: viscosity; A: adhesiveness; E: elasticity; Co: cohesiveness; G: gumminess; Ch: chewiness; B: Brix concentration; M: moisture content; L*: brightness; a*: red–green axis; b*: yellow–blue axis; C*: chroma; h°: tone; P: penetration depth; W: mechanical work; Ka: anisotropy coefficient.
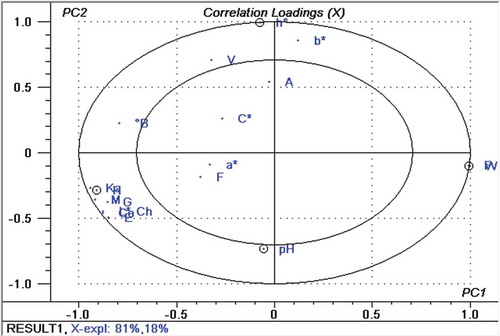
The loadings of each parameter on the principal components show that the grouping of different types is primarily influenced by certain parameters (see ). In the central part of the ellipse the following parameters are identified: adhesiveness, fracturability, a*, color intensity, pH, and °Brix, which influence less the differentiation of strawberry samples, while in the outer ellipse the parameters with a higher influence are found: hardness, penetration depth, mechanical work, the anisotropy coefficient, elasticity, cohesiveness, gumminess, chewiness, moisture, brightness (L*), and tone (h°).
Conclusions
The advantage of applying this device of anisotropy measurement increases the accuracy in determining the individual characteristics of texture which together define the texture profile of a product or food raw materials. The Darselect strawberry samples showed the highest anisotropy, toughness, and resistance to mechanical stress, followed by the samples of Elsanta and Coral variety, the mechanical stress resistance being a very important property for both producers and retailers. Of these three samples of each strawberry variety, the nearly ripe ones showed the highest toughness, whereas the Coral variety is the most fragile one. Another conclusion of the strawberry samples analyzed in this study is that the textural profile is influenced by the moisture content and that the Pearson correlation showed a conection between TPA texture characteristics and texture characteristics of creep curves.
References
- Giampieri, F.; Tulipani, S.; Alvarez-Suarez, J.; Quiles, J.; Mezzetti, B.; M. Battino, The Strawberry: Composition, Nutritional Quality, and Impact on Human Health. Nutrition 2012, 28, 9–19.
- Vandendriessche, T.; Vermeir, S.; Martinez, C.M.; Hendrickx, Y.; Lammertyn, J.; Nicolaï, B.M.; Hertog, M.L.A.T.M. Effect of Ripening and Inter-Cultivar Differences on Strawberry Quality. LWT–Food Science and Technology 2013, 52(2), 62–70.
- Voca, S.; Jakobek, L.; Druzic, J.; Sindrak, Z.; Dobricevic, N.; Seruga, M.; Kovac, A. Quality of Strawberries Produced Applying Two Different Growing Systems Calidad de Fresas Producidas Aplicando Dos Diferentes Sistemas de Cultivo. Cyta-Journal of Food 2009, 7(3), 201–207.
- Rodas, C.L.; Pereira da Silva, I.; Amaral, V.; Coelho, T.; Monteiro, D.; Ferreira, D.; Souza, R.J.; Carvalho, J.G. Chemical Properties and Rates of External Color of Strawberry Fruits Grown Using Nitrogen and Potassium Fertigation. IDESIA (Arica, Chile) Enero–Abril, 31, 2013; Number 1; 53–58.
- Stokes, J.R.; Boehm, M.W.; Baier, S.K. Oral Processing, Texture, and Mouthfeel: From Rheology to Tribology and Beyond. Current Opinion in Colloid & Interface Science 2013, 18(4), 349–359.
- Kopjar, M.; Pilizota, V.; Hribar, J.; Nedic Tiban, N.; Subaric, D.; Babic, J.; Pozrl, T. Influence of Trehalose Addition on Instrumental Textural Properties of Strawberry Pastes. International Journal of Food Properties 2008, 11(3), 646–655.
- Arana, I. Physical Properties of Foods Novel Measurement Techniques and Applications; Taylor & Francis Group, LLC.: New York, NY, 2012.
- Chen, L.; Opara, U.L. Approaches to Analysis and Modelling Texture in Fresh and Processed Foods—A Review. Journal of Food Engineering 2013, 119, 497–507.
- Barrett, D.; Somogyi, L.; Ramaswamy, H. Processing Fruits, Science, and Technology; CRC Press LLC.: Boca Raton, FL, 2005. ISBN 0-8493-1478-X.
- Barrett, D.; Beaulieu, J.; Shewfelt, R. Color, Flavor, Texture, and Nutritional Quality of Fresh-Cut Fruits and Vegetables: Desirable Levels, Instrumental, and Sensory Measurement, and the Effects of Processing. Critical Reviews in Food Science and Nutrition 2010, 50(5), 369–389.
- Bourne, M. Food Texture and Viscosity: Concept and Measurement, 2nd Ed; Academic Press: New York, NY, 2002.
- Vincent, J.F.V.; Lillford, P.J. Feeding and the Texture of Food; Press Syndicate of the University of Cambridge: New York, NY, 1991.
- Bulancea, M.; Iordăchescu, G. Textura Produselor Alimentare; Editura Aius: Craiova, Romania, 2006.
- SR ISO 11036. Senzory Analysis—Methods–Texture Profile; Asociația de Standardizare din România (ASRO): Bucharest, Romania, 2007.
- Chen, L.; Opara, U.L. Texture Measurement Approaches in Fresh and Processed Foods. Food Research International 2013, 51, 823–835.
- Amariei, S.; Gutt, G.; Oroian, M.A.; Sanduleac, E.; Paduret, S. Device for determining food anisotropy, proposal of invention. OSIM file A00674, 2013.
- Ferreira, D.; Da Silva, A.J.L.; Pinto, G.; Santos, C.; Delgadillo, I.; Coimbra, A.M. Effect of Sun-Drying on Microstructure and Texture of S. Bartolomeu Pears (Pyrus Communis L.). European Food Research and Technology 2008, 226, 1545–1552.
- Zhu, B.; Dong, X.; Sun, L.; Xiao, G.; Chen, X.; Murata, Y.; Yu, C. Effect of Thermal Treatment on the Texture and Microstructure of Abalone Muscle (Haliotis Discus). Food Science and Biotechnology 2011, 20(6), 1467–1473.
- Zareifard, M.R.; Savard, T.; Marcotte, M.; Lecompte, J.Y.; Grabowski, S. Combined Effects of Mild Acidification and Thermal Treatment on Color and Texture of Green Beans. International Journal of Food Properties 2015, 18(8), 1847–1862.
- Jaworska, G.; Bernas, E. Effects of Pre-Treatment, Freezing and Frozen Storage on the Texture of Boletus Edulis (Bull: Fr.) Mushrooms. International Journal of Refrigeration 2010, 33(4), 877–885.
- De Avila, M.D.R.; Cambero, M.I.; Ordonez, J.A.; de La Hoz, L.; Herrero, A.M. Rheological Behaviour of Commercial Cooked Meat Products Evaluated by Tensile Test and Texture Profile Analysis (TPA). Meat Science 2014, 98(2), 310–315.
- Pons, M.; Fiszman, S.M. Instrumental Texture Profile Analysis with Particular Reference to Gelled Systems. Journal of Texture Studies 1996, 27(6), 597–624.
- Leiva, J.; Figueroa, H. Texture of Chanco Cheese: Projection of a Sensory Map Based Onmultivariate Analysis. Ciencia e investigación agraria: revista latinoamericana de ciencias de la agricultura 2010, 37(1), 85–91.
- Zhu, B.; Li, B.; Gao, Q.; Fan, J.; Gao, P.; Ma, M.; Feng, X. Predicting Texture of Cooked Blended Rice with Pasting Properties. International Journal of Food Properties 2013, 16(3), 485–499.
- Rosenthal, A.J. Texture Profile Analysis—How Important Are The Parameters? Journal Of Texture Studies 2010, 41(5), 672–684.
- Chang, H.; Wang, Q.; Xu, X.; Li, C.; Huang, M.; Zhou, G.; Dai, Y. Effect of Heat-Induced Changes of Connective Tissue and Collagen on Meat Texture Properties of Beef Semitendinosus Muscle. International Journal of Food Properties 2011, 14(2), 381–396.
- Pădureț, S.; Gutt, G. The Use of Texture Destructive Methods to Assess the State of Pork Freshness. Food & Environment Safety 2015, 14(2), 190–195.
- Betten, J. Creep Mechanics, 2nd Ed; Springer: Berlin/Heidelberg, Germany, 2005.
- Vithanage, C.R.; Grimson, M.J.; Smith, B.G.; Wills, P.R. Creep Test Observation of Viscoelastic Failure of Edible Fats, Condensed Matter, and Materials Physics Conference (CMMP10). Journal of Physics 2011, Conference Series 286, 012008.
- Sanz, T.; Salvador, A.; Baixauli, R.; Fiszman, S.M. Evaluation of Four Types of Resistant Starch in Muffins. II. Effectsin Texture, Colour, and Consumer Response. European Food Research and Technology 2009, 229, 197–204.
- Kilcast, D. Instrumental Assessment of Food Sensory Quality; Woodhead Publishing Limited: Cambridge, UK, 2013. ISBN 978-0-85709-885-6.
- Alves de Oliveira, E.N.; Costa Santos, D.; Gomes, J.P.; Trindade Rocha, A.P.; Da Silva, W.P. Physicochemical Stability of Diet Umbu-Caja Jams Stored Under Ambient Conditions. Journal of Food Processing and Preservation 2015, 39, 70–79.
- Azodanlou, R.; Darbellay, C.; Luisier, J.L.; Villettaz, J.C.; Amadò, R. Changes in Flavour and Texture During the Ripening of Strawberries. European Food Research and Technology 2004, 218(2), 167–172.
- Tõnutare, T.; Keert, K.; Szajdak, L.; Moor, U. Composition of Commercially Produced Organic and Conventional Strawberries. Nutrition & Food Science 2014, 44(6), 562–575.
- Caner, C.; Aday, M.S.; Demir, M. Extending the Quality of Fresh Strawberries by Equilibrium Modified Atmosphere Packaging. European Food Research and Technology 2008, 227(6), 1575–1583.
- Leo, M.L.; Terri, B.; Feng, C.; Coggins, P.; Gloria, M.; Hui, H.Y. Handbook of Meat, Poultry, and Seafood Quality; Blackwell Publishing: Ames, IA, 2007.